Jacksonville, FL, and East Seattle, WA, situated in entirely different environments and cultures, offer unique living experiences. Jacksonville offers an attractive blend of vibrant urban life and natural beauty, while East Seattle is a lively cultural hub nestled near the breathtaking Cascade Mountains. Weighing these cities against one another, it's crucial to consider factors such as crime and safety, weather, cost of living, and more. Whether you're considering these locations for relocation or a tourist visit, this comprehensive comparison should aid in your decision.
Jacksonville's crime rate is somewhat higher than the national average, though it varies significantly by neighborhood. Travelers and new inhabitants should remain conscious of their surroundings, particularly after dark. Safety-wise, East Seattle displays lower crime rates and is generally safer, which makes it a favorable destination for tourists and families alike.
Cost of Living
One great advantage of living in Jacksonville is its relatively low cost of living. This cost-effectiveness extends to housing, transportation, and groceries. On the contrary, East Seattle's cost of living is considerably higher due to its prime location and high demand. However, Seattle's higher wages somewhat offset these costs.
Income Tax
Neither Florida nor Washington state imposes a state income tax, which can be a major perk for those considering relocation or establishing a business.
Property Tax
In Jacksonville, homeowners can expect slightly lower property taxes compared to the national average. Meanwhile, East Seattle's property tax rates are considerably higher due to the high property values in the area.
Sales Tax
Florida, including Jacksonville, benefits from no state income tax but carries a 7% sales tax. Washington, on the other hand, has no state income tax but levies a higher sales tax of 9.6% in East Seattle.
Income
Type
Jacksonville
East Seattle
Estimated median household income
$58,621
$135,835
Estimated per capita income
$32,953
$77,151
Cost of living index (U.S. average is 100)
88.3
128.6
If you make $50,000 in Jacksonville, you will have to make $72,820 in East Seattle to maintain the same standard of living.
Geographical Conditions
Jacksonville offers a beautiful coastal landscape with miles of beaches and the sprawling St. Johns River. East Seattle's geography is arguably its greatest asset, bound by the spectacular Lake Washington and Cascade Mountains.
Geographical information
Type
Jacksonville
East Seattle
Land area
757.7 sq. miles
217.1 sq. miles
Population density
1,259.9 people per sq. mile
2,361.6 people per sq. mile
Relative area comparison
Jacksonville, FL East Seattle, WA
Education
Both locations boast excellent educational opportunities. Jacksonville provides a great range of public, private, and charter schools and is home to several universities. East Seattle has exceptional public schools highly-rated nationally and houses reputable higher education institutions, including the University of Washington.
Jacksonville's economy is diverse, with significant sectors in financial services, healthcare, and logistics. Conversely, East Seattle is a tech hub, hosting large companies like Microsoft and T-Mobile. However, both cities have thriving economies, ensuring a wide range of job opportunities.
Biggest Employers
The City of Jacksonville, Duval County Public Schools, and Naval Air Station are among Jacksonville's most significant employers. In East Seattle, the job market is dominated by companies like Microsoft, Amazon, and Starbucks, literally giants in their respective fields.
In Jacksonville (Duval County), 47.9% voted for Democrats and 51.5% for Republicans in 2012 Presidential Election. In East Seattle (King County), 69.0% voted for Democrats and 28.5% for Republicans.
Elections
Type
Democrats
Republicans
Other
Year
Jacksonville
East Seattle
Jacksonville
East Seattle
Jacksonville
East Seattle
2020
51.3%
75.1%
47.5%
22.3%
1.2%
2.6%
2016
47.2%
70.0%
48.6%
21.1%
4.2%
8.9%
2012
47.9%
69.0%
51.5%
28.5%
0.6%
2.5%
2008
49.0%
70.2%
51.0%
28.1%
0.0%
1.7%
2004
41.7%
65.1%
57.9%
33.8%
0.3%
1.1%
2000
40.9%
60.3%
57.7%
34.5%
1.4%
5.2%
1996
44.2%
56.4%
50.0%
31.4%
5.8%
12.2%
Breakdown of population affiliated with a religious congregation
Type
Adherents
Congregations
Religion
Jacksonville
East Seattle
Jacksonville
East Seattle
SOUTHERN BAPTIST CONVENTION
15.8%
0.3%
22.3%
3.8%
CATHOLIC CHURCH
9.0%
14.4%
2.8%
4.9%
EPISCOPAL CHURCH
1.2%
0.8%
2.3%
2.4%
MUSLIM ESTIMATE
0.7%
0.6%
0.6%
1.4%
EVANGELICAL LUTHERAN CHURCH IN AMERICA
0.3%
1.3%
0.9%
4.7%
LUTHERAN CHURCH
0.3%
0.5%
0.7%
2.0%
SEVENTH DAY ADVENTIST CHURCH
0.3%
0.6%
1.4%
2.3%
AMERICAN BAPTIST CHURCHES IN THE USA
0.1%
0.6%
0.2%
2.9%
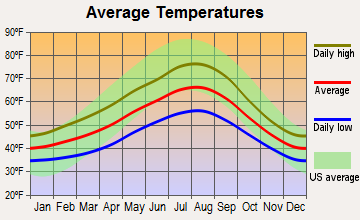
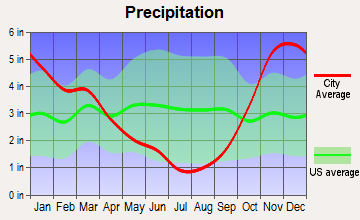
Weather
Florida is famous for its sunny and warm climate, and Jacksonville is no exception. It's an ideal destination for those who enjoy outdoor activities year-round. East Seattle, on the other hand, experiences a more temperate climate with frequent rain. However, the cooler climate is perfect for those who enjoy the four seasons without the harsh winter conditions seen in other parts of the country.
Weather and climate
Type
Jacksonville
East Seattle
Temperature - Average
68.3°F
52.5°F
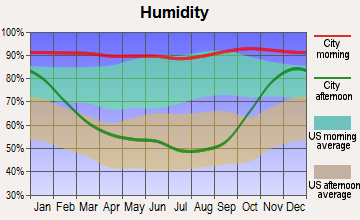
Humidity - Average morning or afternoon humidity
78.4%
78.5%
Humidity - Differences between morning and afternoon humidity
44%
38%
Humidity - Maximum monthly morning or afternoon humidity
92%
86%
Humidity - Minimum monthly morning or afternoon humidity
48%
48%
Precipitation - Yearly average
51.8 in
36.8 in
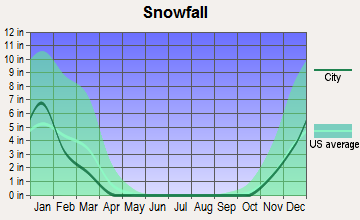
Snowfall - Yearly average
0 in
21.4 in
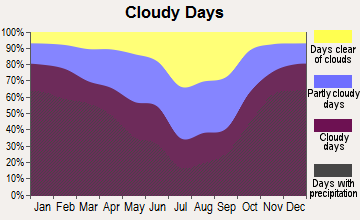
Clouds - Number of days clear of clouds
15.8%
11.7%
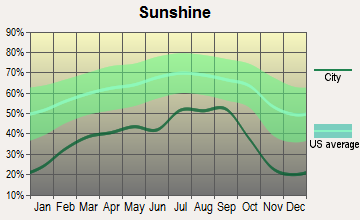
Sunshine amount - Average
69.6%
49.4%
Sunshine amount - Differences during a year
16%
44%
Sunshine amount - Maximum monthly
74%
64%
Sunshine amount - Minimum monthly
58%
20%
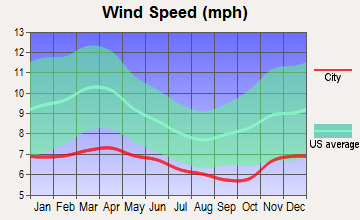
Wind speed - Average
7.2 mph
8.6 mph
Average climate in Jacksonville, Florida
Average climate in East Seattle, Washington
Air pollution
Type
AQI
CO
NO2
OZONE
PB
PM10
PM25
SO2
Year
Jacksonville
East Seattle
Jacksonville
East Seattle
East Seattle
Jacksonville
East Seattle
Jacksonville
East Seattle
East Seattle
Jacksonville
East Seattle
Jacksonville
East Seattle
2018
78
85
N/A
0.21
10.6
N/A
24.5
21.0
N/A
N/A
N/A
N/A
7.1
5.1
N/A
0.7
2017
74
100
N/A
0.23
11.1
N/A
24.7
21.2
N/A
N/A
N/A
N/A
5.8
4.6
0.7
0.3
2016
65
67
0.50
0.22
11.9
N/A
24.9
20.2
N/A
N/A
N/A
N/A
5.2
3.8
0.4
0.6
2015
63
88
0.35
0.23
10.8
N/A
25.4
19.4
N/A
N/A
N/A
N/A
4.9
5.6
0.3
0.8
2014
66
75
0.27
0.24
11.5
N/A
24.3
19.5
N/A
N/A
N/A
N/A
5.9
5.7
0.7
N/A
2013
68
81
0.18
0.24
N/A
N/A
23.0
17.2
N/A
N/A
N/A
N/A
5.3
5.9
0.7
0.8
2012
66
83
0.10
0.23
N/A
N/A
24.0
19.3
N/A
N/A
N/A
N/A
5.8
5.2
0.6
1.0
2011
88
73
0.28
0.24
N/A
N/A
26.6
18.6
N/A
N/A
N/A
N/A
8.1
5.2
0.8
1.1
2010
77
73
0.31
0.24
N/A
N/A
26.4
18.0
N/A
N/A
N/A
N/A
7.1
4.4
0.8
1.1
2009
72
94
0.16
0.27
N/A
N/A
25.0
18.3
N/A
N/A
N/A
N/A
8.5
6.0
0.6
1.4
2008
75
80
0.15
0.30
N/A
N/A
27.6
17.8
N/A
N/A
N/A
N/A
10.0
5.4
0.9
1.3
2007
92
85
0.29
0.30
N/A
N/A
28.4
17.7
N/A
N/A
19.0
N/A
11.4
6.4
1.2
1.5
2006
87
102
0.35
N/A
N/A
N/A
29.0
18.4
N/A
N/A
21.1
N/A
10.8
7.2
1.4
N/A
2005
93
104
0.42
0.80
18.3
N/A
26.5
N/A
N/A
N/A
22.9
N/A
12.2
7.6
1.8
3.5
2004
92
110
0.40
0.81
17.9
N/A
25.2
N/A
N/A
N/A
N/A
N/A
12.4
8.3
1.4
3.0
2003
55
100
0.43
0.85
18.5
N/A
21.6
N/A
N/A
N/A
N/A
N/A
N/A
8.3
1.6
2.4
2002
59
90
0.49
1.07
19.3
N/A
22.2
N/A
0.003
N/A
N/A
N/A
N/A
10.7
1.7
2.7
2001
74
91
0.49
1.08
20.5
N/A
24.0
N/A
0.009
0.004
N/A
N/A
N/A
11.1
2.5
3.7
2000
85
99
0.52
1.21
20.9
N/A
25.1
N/A
0.017
N/A
N/A
N/A
N/A
12.1
3.0
3.2
Natural disasters
Type
Jacksonville
East Seattle
Tornado activity compared to U.S. average
75.2%
5.5%
Earthquake activity compared to U.S. average
18.1%
1,403%
Natural disasters compared to U.S. average
24%
30%
Transportation
While Jacksonville relies heavily on driving, East Seattle's public transportation offers options such as buses, light rail, and ferries. Commuting in both cities is manageable, but commuting in East Seattle may offer more alternatives.
Transport
Type
Jacksonville
East Seattle
Amtrak stations
1
0
Amtrak stations nearby
1
3
FAA registered aircraft
566
0
FAA registered aircraft manufacturers and dealers
34
0
Means of transportation to work
Type
Jacksonville
East Seattle
Bicycle
0.2%
0.3%
Bus
1.1%
5%
Carpooled
9%
11%
Car alone
86.5%
76.3%
Motorcycle
0.2%
0.1%
Taxicab
0.2%
0%
Walked
1.2%
1.7%
Average travel time to work
Type
Jacksonville
East Seattle
Average
27.5 min
25 min
Real Estate
Jacksonville's real estate market is comparatively affordable, offering a range of options from urban living to coastal getaways. East Seattle's real estate, while pricier, provides access to a wide array of properties from modern apartments to stunning waterside homes.
Neighborhoods
Jacksonville's neighbourhoods range from downtown city vibes to beachfront gems like Neptune Beach. East Seattle, bordered by Lake Washington and the mountains, offers highly sought-after neighbourhoods such as Mercer Island and Bellevue.
Houses and residents
Type
Jacksonville
East Seattle
Houses
422,315
199,933
Average household size (people)
2.5
2.5
Houses occupied
386,283 (91.5%)
191,630 (95.8%)
Houses occupied by owners
226,429 (58.6%)
128,209 (66.9%)
Houses occupied by renters
159,854 (41.4%)
63,421 (33.1%)
Median rent asked for vacant for-rent units
$1,444
$2,281
Median price asked for vacant for-sale houses and condos
$260,045
$820,468
Estimated median house or condo value
$239,400
$877,325
Median number of rooms in apartments
4.3
3.5
Median number of rooms in houses and condos
6.3
7.8
Housing density (houses/condos per square mile)
557.4
920.9
Household income disparities
44.2%
34.9%
Housing units without a mortgage
2,439 (1.6%)
22,582 (20.8%)
Housing units with both a second mortgage and home equity loan
8,460 (5.5%)
352 (0.3%)
Housing units with a mortgage
150,468 (98.4%)
85,751 (79.2%)
Housing units with a home equity loan
255 (0.2%)
11,674 (10.8%)
Housing units with a second mortgage
11,378 (7.4%)
9,796 (9%)
Housing units lacking complete kitchen facilities
1.5%
0.8%
Housing units lacking complete plumbing facilities
Self-employed workers in own not incorporated business
19,601
16,907
State government workers
13,692
10,270
Unpaid family workers
1,066
584
Industries and Occupations
In Jacksonville, the transportation and healthcare industries are prominent. East Seattle, in contrast, showcases a thriving tech industry. As for job occupations, Jacksonville has significant job growth in healthcare, education, and logistics, while East Seattle offers ample opportunities within the technological and educational fields.
Both cities offer high-quality healthcare options. Jacksonville is home to numerous reputable hospitals including the Mayo Clinic. East Seattle, likewise, has superb healthcare facilities including the prestigious University of Washington Medical Center.
Health (county statistics)
Type
Jacksonville
East Seattle
General health status score of residents in this county from 1 (poor) to 5 (excellent)
Both cities have well-developed infrastructures. Jacksonville possesses a robust network of highways and bridges perfect for commuting, while East Seattle boasts advanced tech infrastructure and impressive transport links with downtown Seattle.
Infrastructure
Type
Jacksonville
East Seattle
TV stations
17
16
Schools
School facilities
Type
Jacksonville
East Seattle
Private elementary/middle schools
38
1
Private high schools
56
1
Public elementary/middle schools
145
2
Public high schools
55
2
Colleges/Universities
30
0
Culture and Food
Jacksonville flaunts an eclectic mix of cultures, resulting in a rich culinary scene with notable southern influences. East Seattle offers a fusion of global cuisines with a healthy dose of fresh regional seafood available. Both cities offer vibrant arts scenes, though East Seattle's music and creative scenes are known worldwide.
Sports Teams
Football fans will be delighted with Jacksonville's NFL team, the Jaguars. While East Seattle doesn't have its own teams, Seattle's professional sports leagues, like the NFL's Seahawks, and MLB's Mariners are a big draw.
 Jacksonville, FL
 East Seattle, WA