Jacksonville, FL vs Fresno, CA - Advanced U.S. city comparison tool

Jacksonville, FL vs Fresno, CA

Understanding how Jacksonville, FL compares with Fresno, CA, is crucial to relocation or travel planning. The two cities differ significantly in terms of crime rates, weather, cost of living, employment, infrastructure, education, and more. Relocators and tourists alike can better plan their trips by exploring the two cities' unique aspects. This comprehensive comparison provides potential movers and visitors vital information to make an informed choice.
 
 
Distance between Jacksonville, FL and Fresno, CA : 2,225.4 miles

Jacksonville's population is larger by 75%. Its population has grown by 218,997 people (29.8%) since 2000. The population of Fresno has grown by 116,858 people (27.3%) during that time.

Population
Type Jacksonville Fresno
Population 954,614 544,510
Female / male percentage 51.4% / 48.6%
51.4%
48.6%
50.3% / 49.7%
50.3%
49.7%
Racial makeup - percentage
Ethnicity JacksonvilleFresno
White Non-Hispanic 48.1% 24.9%
Black 29.7% 6.0%
Hispanic 11.6% 49.7%
Two or more 5.0% 3.8%
Asian 4.9% 14.3%
American Indian 0.1% 0.5%
Pacific Islander 0.1% 0.2%
Racial makeup - absolute values
Ethnicity JacksonvilleFresno
White Non-Hispanic 459,054 135,441
Black 283,190 32,833
Hispanic 110,306 270,662
Two or more 47,991 20,849
Asian 46,726 77,924
American Indian 1,019 2,543
Pacific Islander 544 1,277

Crime and Safety

Fresno's crime rates are higher than the national average, making safety a concern for both residents and tourists. By contrast, Jacksonville has lower crime rates, offering a safer environment. However, both cities have implemented numerous strategic initiatives to promote safety, making their downtown areas safer and attracting more tourists and potential residents.

Cost of Living

Living in Jacksonville, Florida, tends to be cheaper than living in Fresno, California. This is due to lower housing, grocery, and utility costs in Jacksonville. However, Fresno does tend to have lower transportation costs due to its investment in public transit.

Income Tax

Florida does not have a state income tax, which benefits Jacksonville residents. California does have a state income tax, impacting Fresno residents more significantly.

Property Tax

Property taxes are lower in Jacksonville compared to Fresno, which is largely due to the overall lower cost of living in Florida versus California.

Sales Tax

California generally has a higher sales tax than Florida. As such, Fresno's sales tax is higher than Jacksonville's.
Income
Type Jacksonville Fresno
Estimated median household income $58,621 $61,250
Estimated per capita income $32,953 $28,499
Cost of living index (U.S. average is 100) 88.3 96.3

If you make $50,000 in Jacksonville, you will have to make $54,530 in Fresno to maintain the same standard of living.

Geographical Conditions

Jacksonville is located on the Atlantic coast and boasts beautiful beaches, marshes, and nature reserves. Fresno is located in California's Central Valley and is close to three national parks: Yosemite, Sequoia, and Kings Canyon.
Geographical information
Type Jacksonville Fresno
Land area 757.7 sq. miles 104.4 sq. miles
Population density 1,259.9 people per sq. mile 5,217.4 people per sq. mile
Elevation 12 feet 296 feet
Relative area comparison
Jacksonville, FL Fresno, CA
First ancestry reported - percentage
Ancestry JacksonvilleFresno
English 4.5% 1.5%
Irish 4.1% 1.6%
German 3.7% 2.7%
Italian 2.2% 1.2%
Scottish 0.8% 0.3%
Scotch-Irish 0.7% 0.2%
Polish 0.6% 0.1%
French 0.5% 0.2%
Russian 0.4% 0.1%
Arab 0.3% 0.4%
Ukrainian 0.3% 0.1%
Dutch 0.3% 0.2%
Norwegian 0.2% 0.2%
Greek 0.2% 0.1%
French Canadian 0.2% 0.0%
Swedish 0.2% 0.2%
Portuguese 0.1% 0.5%
Population origin - absolute values
Ancestry JacksonvilleFresno
English 24,028 4,921
Irish 21,841 5,490
German 19,924 9,151
Italian 11,889 4,187
Scottish 4,351 917
Scotch-Irish 3,942 794
Polish 3,334 357
French 2,532 529
Russian 2,198 379
Dutch 1,581 508
Ukrainian 1,461 439
Arab 1,349 1,234
French Canadian 1,331 136
Norwegian 1,129 632
Greek 1,107 490
Swedish 945 799
West Indian 936 0
Welsh 744 294
Portuguese 658 1,687
Hungarian 609 174
Foreign born residents - absolute values
Type Count
Region JacksonvilleFresno
All 115,577 102,381
Africa 5,768 1,314
Asia 40,318 43,128
Europe 18,002 3,665
Latin America 48,096 54,338
North America 1,647 706
Oceania 393 323
Foreign born residents - percentage
Type Percentage
Region JacksonvilleFresno
All 12.1% 18.8%
Africa 0.6% 0.2%
Asia 4.2% 7.9%
Europe 1.9% 0.7%
Latin America 5.0% 10.0%
North America 0.2% 0.1%

Education

Both cities boast an array of educational opportunities. Jacksonville is home to the University of North Florida and Jacksonville University. Fresno, on the other hand, is home to California State University, Fresno, offering diverse study programs.
School enrollment
Type Jacksonville Fresno
Nursery, preschool 12,987 (5.9%) 5,551 (3.6%)
Kindergarten 12,436 (5.6%) 8,615 (5.7%)
Grade 1 to 4 49,038 (22.2%) 30,954 (20.3%)
Grade 5 to 8 44,676 (20.2%) 33,276 (21.9%)
Grade 9 to 12 47,624 (21.6%) 33,683 (22.1%)
College undergrad 44,825 (20.3%) 30,959 (20.3%)
Graduate or professional 9,213 (4.2%) 9,136 (6%)
Students in private schools - absolute values
Type Count
Grade JacksonvilleFresno
Grades 1 to 8 (elementary and middle school) 15,629 3,647
Grades 9 to 12 (high school) 5,824 1,687
Undergraduate colleges 10,300 4,746
Students in private schools - percentage
Type Percentage
Grade JacksonvilleFresno
Grades 1 to 8 (elementary and middle school) 16.7% 5.7%
Grades 9 to 12 (high school) 12.2% 5.0%
Undergraduate colleges 23.0% 15.3%
Educational attainment
Type Jacksonville Fresno
Less than high school 9.2% 19.9%
High school or equiv. 27.5% 23.8%
Less than 1 year of college 7.2% 6.1%
1 or more years of college 14.4% 16.7%
Associate degree 9.5% 7.4%
Bachelor's degree 21.8% 17.8%
Master's degree 7.7% 5.5%
Profess. school degree 1.6% 1.8%
Doctorate degree 1.2% 1%
Education level (25-year-olds and older)
Type Jacksonville Fresno
Bachelor's degree or higher 32.3% 26.1%
Graduate or professional degree 10.5% 8.3%
High school or higher 90.8% 80.1%

Work and Economy

Both cities have diverse economies. Jacksonville's economy focuses on banking, healthcare, and logistics, while Fresno's economy is based on agriculture, manufacturing, and healthcare.

Biggest Employers

In Jacksonville, major employers include Baptist Health, Bank of America Merrill Lynch, and CSX Corporation. Fresno's major employers are Community Medical Centers, Saint Agnes Medical Center, and City of Fresno.
Employment and residency - absolute values
Kind JacksonvilleFresno
Work and live in this city 319,728 118,757
Work and live in this county 426,890 205,890
Workers who work outside the city they live in 415,889 308,895
Workers who work outside the county they live in 33,250 16,861
Working at home 73,598 27,136
Not working at home 386,542 195,615
Daytime population change due to commuting 62,223 31,387
Employment and residency - percentage
Kind JacksonvilleFresno
Work and live in this city 91.2% 75.8%
Work and live in this county 92.8% 92.4%
Workers who work outside the city they live in 8.8% 24.2%
Workers who work outside the county they live in 7.2% 7.6%
Working at home 16.0% 12.2%
Not working at home 84.0% 87.8%
Daytime population change due to commuting 8.5% 7.3%
Geographical mobility: all
Type all
Mobility JacksonvilleFresno
Same house 1 year ago 84.4% 87.6%
Moved from abroad 0.3% 0.3%
Moved within same county 9.4% 8.8%
Moved from different state 3.3% 0.8%
Moved within same state 2.6% 2.5%
Geographical mobility: Asian
Type Asian
Mobility JacksonvilleFresno
Same house 1 year ago 92.0% 91.9%
Moved from abroad 0.2% 1.3%
Moved within same county 4.1% 2.8%
Moved from different state 2.7% 0.4%
Moved within same state 1.0% 3.6%
Geographical mobility: Black
Type Black
Mobility JacksonvilleFresno
Same house 1 year ago 85.8% 86.0%
Moved within same county 9.9% 10.9%
Moved from different state 2.1% 0.5%
Moved within same state 2.1% 2.5%
Geographical mobility: White
Type White
Mobility JacksonvilleFresno
Same house 1 year ago 84.6% 86.6%
Moved from abroad 0.2% 0.2%
Moved within same county 8.3% 9.3%
Moved from different state 4.3% 1.2%
Moved within same state 2.6% 2.7%
Building permits
Type Average valueCount
City JacksonvilleFresnoJacksonvilleFresno
1997 $111,100 $119,300 3,483 1,323
1998 $110,500 $118,900 3,796 1,576
1999 $119,800 $128,900 3,878 1,459
2000 $114,700 $138,800 3,497 1,398
2001 $120,300 $138,900 4,832 1,588
2002 $122,700 $132,000 5,397 1,139
2003 $126,700 $156,900 5,766 1,547
2004 $138,800 $163,900 6,067 2,109
2005 $152,600 $165,700 8,175 2,247
2006 $157,400 $165,200 6,291 1,600
2007 $159,100 $156,200 3,449 2,016
2008 $173,500 $156,200 2,592 1,230
2009 $179,500 $142,700 1,467 1,090
2010 $175,800 $187,700 1,397 990
2011 $181,500 $186,500 957 706
2012 $192,500 $239,600 1,310 755
2013 $0 $272,500 0 1,160
2014 $0 $270,800 0 641
2015 $0 $286,000 0 844
2016 $0 $292,500 0 1,005
2017 $0 $290,700 0 680
2018 $0 $312,400 0 821
2019 $0 $313,100 0 1,153
2020 $0 $300,200 0 1,214
2021 $0 $267,900 0 1,911

There were 1,310 building permits issued in Jacksonville in 2012 (353 more than in 2011) compared to 1,911 building permits issued in Fresno in 2012 (1205 more than in 2011).

In Jacksonville (Duval County), 47.9% voted for Democrats and 51.5% for Republicans in 2012 Presidential Election. In Fresno (Fresno County), 49.8% voted for Democrats and 48.0% for Republicans.

Elections
Type DemocratsRepublicansOther
Year JacksonvilleFresnoJacksonvilleFresnoJacksonvilleFresno
2020 51.3% 53.0% 47.5% 45.2% 1.2% 1.8%
2016 47.2% 49.2% 48.6% 43.2% 4.2% 7.5%
2012 47.9% 49.8% 51.5% 48.0% 0.6% 2.2%
2008 49.0% 50.2% 51.0% 48.1% 0.0% 1.8%
2004 41.7% 42.0% 57.9% 57.8% 0.3% 0.3%
2000 40.9% 43.2% 57.7% 53.3% 1.4% 3.5%
1996 44.2% 45.3% 50.0% 47.4% 5.8% 7.3%
Breakdown of population affiliated with a religious congregation
Type AdherentsCongregations
Religion JacksonvilleFresnoJacksonvilleFresno
SOUTHERN BAPTIST CONVENTION 15.8% 1.6% 22.3% 8.1%
CATHOLIC CHURCH 9.0% 31.0% 2.8% 6.1%
EPISCOPAL CHURCH 1.2% 0.0% 2.3% 0.1%
MUSLIM ESTIMATE 0.7% 0.3% 0.6% 0.6%
EVANGELICAL LUTHERAN CHURCH IN AMERICA 0.3% 0.5% 0.9% 2.0%
SEVENTH DAY ADVENTIST CHURCH 0.3% 0.7% 1.4% 2.6%
AMERICAN BAPTIST CHURCHES IN THE USA 0.1% 0.6% 0.2% 2.4%

Weather

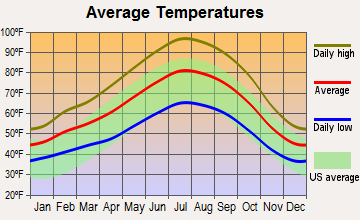
With its Mediterranean climate, Fresno offers hot, dry summers and mild, wet winters. On the other hand, Jacksonville experiences a humid subtropical climate, with hot, humid summers and mild to cool winters.
Weather and climate
Type Jacksonville Fresno
Temperature - Average 68.3°F 63°F
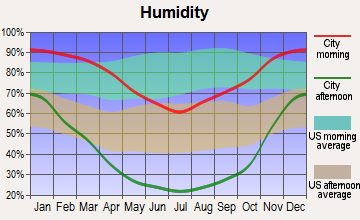
Humidity - Average morning or afternoon humidity 78.4% 60.9%
Humidity - Differences between morning and afternoon humidity 44% 67%
Humidity - Maximum monthly morning or afternoon humidity 92% 88%
Humidity - Minimum monthly morning or afternoon humidity 48% 21%
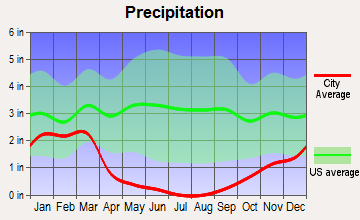
Precipitation - Yearly average 51.8 in 11.6 in
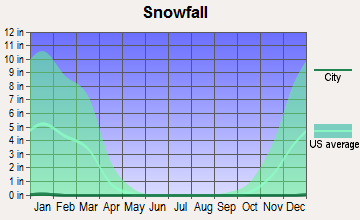
Snowfall - Yearly average 0 in 0 in
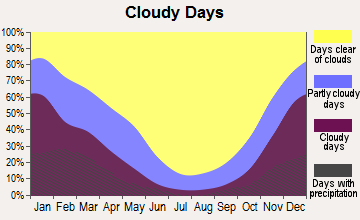
Clouds - Number of days clear of clouds 15.8% 32.4%
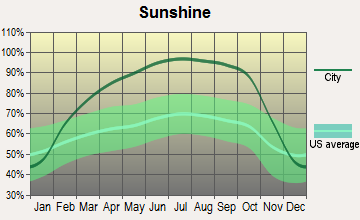
Sunshine amount - Average 69.6% 82.8%
Sunshine amount - Differences during a year 16% 52%
Sunshine amount - Maximum monthly 74% 96%
Sunshine amount - Minimum monthly 58% 44%
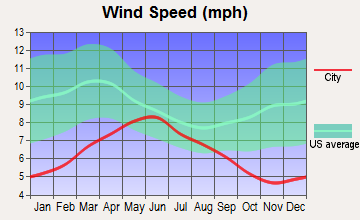
Wind speed - Average 7.2 mph 6.5 mph

Average climate in Jacksonville, Florida

Chicago, Illinois average temperatures Chicago, Illinois average precipitation Chicago, Illinois humidity Chicago, Illinois wind speed Chicago, Illinois snowfall Chicago, Illinois sunshine Chicago, Illinois clear and cloudy days
 

Average climate in Fresno, California

Chicago, Illinois average temperatures Chicago, Illinois average precipitation Chicago, Illinois humidity Chicago, Illinois wind speed Chicago, Illinois snowfall Chicago, Illinois sunshine Chicago, Illinois clear and cloudy days
 

Air pollution
Type AQICONO2OZONEPBPM10PM25SO2
Year JacksonvilleFresnoJacksonvilleFresnoFresno JacksonvilleFresnoJacksonvilleFresnoFresno JacksonvilleFresnoJacksonvilleFresno
2018 78 128 N/A 0.35 9.7 N/A 24.5 31.7 N/A N/A 39.7 N/A 7.1 14.8 N/A 0.6
2017 74 132 N/A 0.35 9.2 N/A 24.7 33.2 N/A N/A 38.3 N/A 5.8 14.3 0.7 0.6
2016 65 128 0.50 0.35 8.4 N/A 24.9 31.4 N/A N/A 34.7 N/A 5.2 13.5 0.4 0.5
2015 63 134 0.35 0.32 8.7 N/A 25.4 31.1 N/A N/A 34.2 N/A 4.9 13.9 0.3 0.5
2014 66 139 0.27 0.33 10.1 N/A 24.3 32.4 N/A 0.004 39.3 N/A 5.9 16.4 0.7 0.5
2013 68 136 0.18 0.37 11.1 N/A 23.0 31.0 N/A 0.005 43.3 N/A 5.3 19.1 0.7 0.6
2012 66 140 0.10 0.36 9.7 N/A 24.0 31.9 N/A 0.004 36.1 N/A 5.8 14.2 0.6 0.6
2011 88 139 0.28 0.34 8.7 N/A 26.6 33.5 N/A N/A 30.2 N/A 8.1 21.1 0.8 0.8
2010 77 121 0.31 0.27 6.9 N/A 26.4 31.1 N/A N/A N/A N/A 7.1 N/A 0.8 0.7
2009 72 107 0.16 0.31 7.3 N/A 25.0 29.6 N/A N/A N/A N/A 8.5 N/A 0.6 1.6
2008 75 130 0.15 0.33 9.3 N/A 27.6 31.1 N/A N/A N/A N/A 10.0 22.2 0.9 1.0
2007 92 146 0.29 0.34 10.0 N/A 28.4 28.4 N/A N/A N/A N/A 11.4 26.0 1.2 0.7
2006 87 104 0.35 0.36 11.3 N/A 29.0 29.7 N/A 0.006 N/A N/A 10.8 N/A 1.4 N/A
2005 93 101 0.42 0.33 10.7 N/A 26.5 28.1 N/A N/A N/A N/A 12.2 N/A 1.8 N/A
2004 92 103 0.40 0.34 11.5 N/A 25.2 30.8 N/A N/A N/A N/A 12.4 N/A 1.4 N/A
2003 55 115 0.43 0.44 15.0 N/A 21.6 31.2 N/A N/A N/A N/A N/A N/A 1.6 1.2
2002 59 139 0.49 0.43 15.2 N/A 22.2 44.8 0.003 N/A N/A N/A N/A N/A 1.7 N/A
2001 74 143 0.49 0.42 15.1 N/A 24.0 47.3 0.009 N/A N/A N/A N/A N/A 2.5 N/A
2000 85 136 0.52 0.51 15.4 N/A 25.1 41.0 0.017 N/A N/A N/A N/A N/A 3.0 N/A
Natural disasters
Type Jacksonville Fresno
Tornado activity compared to U.S. average 75.2% 9.9%
Earthquake activity compared to U.S. average 18.1% 8,613%
Natural disasters compared to U.S. average 24% 12%

Transportation

Jacksonville offers various public transportation options, including buses, ferries, and trains. Fresno, on the other hand, focuses more on bus services, with its well-maintained city bus network and Greyhound intercity bus service.
Transport
Type Jacksonville Fresno
Amtrak stations 1 1
Amtrak stations nearby 1 2
FAA registered aircraft 566 408
FAA registered aircraft manufacturers and dealers 34 36
Means of transportation to work
Type Jacksonville Fresno
Bicycle 0.2% 0.8%
Bus 1.1% 1.3%
Carpooled 9% 10.7%
Car alone 86.5% 84.4%
Motorcycle 0.2% 0.2%
Taxicab 0.2% 0.1%
Walked 1.2% 1.4%
Means of transportation to work
Average travel time to work
Type Jacksonville Fresno
Average 27.5 min 23.7 min
Other means 25 min 21.5 min
Public transportation 43.7 min 45.3 min
Travel time to work
Time leaving to work
Travel time to work
Time leaving to work
Private vehicle occupancy
Type Jacksonville Fresno
Average 1.1 1.2
Drove alone 89.4% 88.3%
In 2 person carpool 8% 8.5%
In 3 person carpool 1.7% 1.8%
In 4 person carpool 0.7% 0.8%
In 5-6 person carpool 0% 0.5%
In 7+ person carpool 0.2% 0.1%

How many people usually rode to work in the car, truck or van.

Real Estate

In comparison, home prices in Fresno tend to be higher than in Jacksonville. However, rental prices are fairly comparable.

Neighborhoods

Both Jacksonville and Fresno offer diverse neighborhoods that cater to various lifestyle needs. From the scenic beaches of Jacksonville Beach to the historic charm of Fresno's Tower District, there's a neighborhood for everyone.
Houses and residents
Type Jacksonville Fresno
Houses 422,315 188,756
Average household size (people) 2.5 3.1
Median year apartment built 1985 1977
Median year house/condo built 1987 1983
Length of stay in the house since moving in 12.5 years 12.6 years
Houses occupied 386,283 (91.5%) 181,841 (96.3%)
Houses occupied by owners 226,429 (58.6%) 91,233 (50.2%)
Houses occupied by renters 159,854 (41.4%) 90,608 (49.8%)
Median rent asked for vacant for-rent units $1,444 $958.34
Median monthly housing costs $1,154 $1,209
Median price asked for vacant for-sale houses and condos $260,045 $285,919
Estimated median house or condo value $239,400 $321,300
Median numbers of rooms 5.6 5
Median number of rooms in apartments 4.3 4
Median number of rooms in houses and condos 6.3 5.9
Median house price - detached houses $282,276 $375,492
Median house price - in 2-unit structures $177,341 $184,112
Median house price - in 3-to-4-unit structures $144,947 $196,355
Median house price - in 5 or more unit structures $220,508 $287,684
Median house price - mobile homes $87,589 $100,122
Median house price - Townhouses or other attached units $213,709 $260,277
Median house price - All housing units $266,926 $358,028
Median house age 36 42
Renting percentage 38.3% 50.9%
Housing density (houses/condos per square mile) 557.4 1,808.6
House value disparities 33.2% 29.4%
Household income disparities 44.2% 46.4%
Median household income for houses/condes with a mortgage $83,160 $97,354
Median household income for apartments without a mortgage $59,777 $73,445
Housing units without a mortgage 2,439 (1.6%) 1,037 (1.7%)
Housing units with both a second mortgage and home equity loan 8,460 (5.5%) 2,880 (4.8%)
Housing units with a mortgage 150,468 (98.4%) 59,354 (98.3%)
Housing units with a home equity loan 255 (0.2%) 68 (0.1%)
Housing units with a second mortgage 11,378 (7.4%) 4,120 (6.8%)
House/condo owner moved in on average (years ago) 10 10
House/condo renter moved in on average (years ago) 1 3
Housing units lacking complete kitchen facilities 1.5% 1.5%
Housing units lacking complete plumbing facilities 1.4% 0.4%
Housing units in structures
Housing units in structures JacksonvilleFresno
One, detached 59.4% 59.0%
One, attached 6.1% 3.2%
Two 2.1% 3.0%
3 or 4 5.3% 7.8%
5 to 9 5.0% 9.6%
10 to 19 7.9% 3.6%
20 to 49 4.9% 3.4%
50 or more 5.3% 7.5%
Mobile homes 3.8% 2.6%
Boats, RVs, vans, etc. 0.2% 0.1%
Median real estate property taxes paid for housing units
Type Jacksonville Fresno
With mortgages $1,976 (0.8%) $2,634 (0.8%)
With no mortgages $1,563 (0.7%) $1,869 (0.6%)
Marital status
Type Jacksonville Fresno
Divorced 14.3% 9.2%
Never married 35.3% 41.7%
Now married 43.3% 41.2%
Separated 1.9% 2.6%
Widowed 5.1% 5.2%
Class of workers - percentage
Class of Workers JacksonvilleFresno
Employee of private company 69.3% 61.5%
Private not-for-profit wage and salary workers 9.4% 9.7%
Local government workers 6.3% 11.6%
Self-employed workers in own not incorporated business 4.3% 6.3%
Self-employed in own incorporated business 4.1% 3.0%
Federal government workers 3.3% 3.2%
State government workers 3.0% 4.3%
Unpaid family workers 0.2% 0.4%
Class of workers - absolute values
Class of Workers JacksonvilleFresno
Employee of private company 314,902 141,742
Federal government workers 15,074 7,428
Local government workers 28,766 26,826
Private not-for-profit wage and salary workers 42,775 22,470
Self-employed in own incorporated business 18,575 6,920
Self-employed workers in own not incorporated business 19,601 14,428
State government workers 13,692 9,836
Unpaid family workers 1,066 890

Industries and Occupations

Jacksonville is home to industries like banking, logistics, and healthcare. On the other hand, Fresno's primary industries include agriculture, food processing, and manufacturing.
Most common male industries
Industry JacksonvilleFresno
Retail trade 12.8% 11.6%
Construction 10.4% 11.8%
Transportation and warehousing 10.3% 8.5%
Finance and insurance 8.0% 2.5%
Accommodation and food services 7.9% 6.7%
Professional, scientific, and technical services 7.7% 5.2%
Manufacturing 7.4% 8.0%
Administrative and support and waste management services 6.8% 4.6%
Other services, except public administration 5.6% 4.9%
Public administration 5.1% 7.1%
Health care and social assistance 5.0% 9.1%
Educational services 3.7% 6.5%
Wholesale trade 3.2% 3.8%
Real estate and rental and leasing 1.8% 0.6%
Arts, entertainment, and recreation 1.8% 1.2%
Utilities 1.3% 1.2%
Information 0.8% 1.8%
Agriculture, forestry, fishing and hunting 0.2% 4.9%
Management of companies and enterprises 0.2% 0.1%
Most common female industries
Industry JacksonvilleFresno
Health care and social assistance 22.6% 27.1%
Finance and insurance 11.4% 4.5%
Retail trade 11.1% 9.1%
Educational services 8.6% 11.0%
Accommodation and food services 8.4% 7.0%
Professional, scientific, and technical services 7.3% 5.8%
Public administration 4.6% 7.2%
Other services, except public administration 4.5% 6.4%
Administrative and support and waste management services 4.4% 3.4%
Manufacturing 3.9% 3.7%
Transportation and warehousing 3.5% 4.1%
Construction 2.4% 1.8%
Arts, entertainment, and recreation 1.9% 1.1%
Real estate and rental and leasing 1.7% 1.7%
Wholesale trade 1.5% 1.5%
Information 1.4% 0.9%
Utilities 0.7% 0.5%
Agriculture, forestry, fishing and hunting 0.1% 3.3%
Most common male occupations
Occupation JacksonvilleFresno
Management occupations 11.4% 9.0%
Sales and related occupations 9.5% 9.1%
Office and administrative support occupations 8.9% 8.2%
Transportation occupations 8.4% 6.5%
Construction and extraction occupations 7.4% 9.6%
Installation, maintenance, and repair occupations 6.3% 4.6%
Material moving occupations 5.9% 6.0%
Food preparation and serving related occupations 5.6% 5.7%
Computer and mathematical occupations 5.5% 2.5%
Business and financial operations occupations 5.4% 4.3%
Production occupations 4.4% 5.5%
Building and grounds cleaning and maintenance occupations 4.2% 4.0%
Architecture and engineering occupations 2.6% 2.1%
Educational instruction, and library occupations 2.3% 3.7%
Health diagnosing and treating practitioners and other technical occupations 1.8% 2.3%
Law enforcement workers including supervisors 1.7% 1.4%
Arts, design, entertainment, sports, and media occupations 1.5% 1.6%
Firefighting and prevention, and other protective service workers including supervisors 1.4% 1.9%
Health technologists and technicians 1.4% 1.8%
Personal care and service occupations 1.0% 1.1%
Most common female occupations
Occupation JacksonvilleFresno
Office and administrative support occupations 19.3% 17.4%
Management occupations 10.2% 9.1%
Sales and related occupations 8.7% 9.1%
Health diagnosing and treating practitioners and other technical occupations 7.9% 5.4%
Educational instruction, and library occupations 7.4% 8.5%
Business and financial operations occupations 6.2% 5.8%
Food preparation and serving related occupations 5.8% 4.6%
Healthcare support occupations 4.6% 9.2%
Building and grounds cleaning and maintenance occupations 3.7% 3.4%
Community and social service occupations 3.1% 3.7%
Personal care and service occupations 2.9% 3.9%
Arts, design, entertainment, sports, and media occupations 2.8% 1.9%
Production occupations 2.7% 2.7%
Material moving occupations 2.6% 3.7%
Health technologists and technicians 2.5% 3.7%
Computer and mathematical occupations 2.3% 0.6%
Legal occupations 1.5% 0.9%
Firefighting and prevention, and other protective service workers including supervisors 1.3% 0.2%
Transportation occupations 1.3% 1.0%
Life, physical, and social science occupations 0.9% 1.1%
Food environment data per 10,000 residents
Food environment statistics JacksonvilleFresno
Number of convenience stores (no gas) 3.3 2.1
Number of convenience stores (with gas) 1.5 1.2
Number of full-service restaurants 7.3 5.8
Number of grocery stores 2.7 2.4
Number of supercenters and club stores 0.1 0.0
Food environment - absolute values
Food environment statistics JacksonvilleFresno
Number of convenience stores (no gas) 281 190
Number of convenience stores (with gas) 130 108
Number of full-service restaurants 614 516
Number of grocery stores 225 215
Number of supercenters and club stores 10 4
Obesity and diabetes
Food environment statistics rate JacksonvilleFresno
Adult diabetes rate 10.4% 7.6%
Adult obesity rate 27.5% 26.4%
Low-income preschool obesity rate 10.9% 17.5%

Health Care

Both cities have quality healthcare systems. Jacksonville is home to well-respected institutions like the Mayo Clinic, while Fresno has Community Medical Centers and Saint Agnes Medical Center.

Fatal vehicle accidents per 100,000 residents
Type Total count per 100,000Drunk per 100,000Fatal count per 100,000Pedestrian count per 100,000Person count per 100,000Vehicle count per 100,000
Year JacksonvilleFresnoJacksonvilleFresnoJacksonvilleFresnoJacksonvilleFresnoJacksonvilleFresnoJacksonvilleFresno
2021 18.4 14.9 0.0 0.0 19.8 15.8 5.3 6.6 37.8 33.6 29.4 23.3
2020 18.1 12.4 4.7 3.0 19.5 13.5 6.1 7.4 35.1 24.5 27.8 17.2
2019 16.5 8.5 4.2 2.6 17.0 8.9 5.9 4.7 33.7 18.1 25.4 13.0
2018 14.2 5.3 4.2 0.8 15.5 5.3 5.2 2.7 31.9 10.3 22.2 7.2
2017 16.2 10.7 4.1 3.2 16.6 11.8 5.3 5.5 36.4 25.6 26.1 17.9
2016 16.2 9.4 4.9 2.3 17.2 9.6 5.3 4.8 34.7 18.8 25.4 12.5
2015 13.6 3.7 4.2 1.0 14.7 3.7 4.8 1.4 27.2 9.5 20.9 5.6
2014 12.3 4.7 4.7 0.8 13.0 4.7 4.2 2.3 29.5 9.7 18.9 7.2
2013 14.6 5.1 5.2 0.6 15.5 5.3 4.9 3.3 28.0 14.1 20.9 8.0
2012 13.3 6.7 5.0 2.6 13.7 7.1 4.8 4.7 26.8 11.9 19.6 8.9
2011 9.9 7.2 3.4 1.8 10.3 7.2 3.1 3.4 20.1 15.0 15.6 10.4
2010 12.4 6.1 4.7 1.2 13.0 7.7 3.3 3.6 25.1 19.4 18.4 9.7
2009 12.4 6.3 4.2 2.3 13.5 6.9 4.1 2.1 33.4 16.3 17.8 10.4
2008 14.2 7.6 5.9 3.6 14.7 8.2 2.5 3.4 35.7 17.3 21.7 10.1
2007 18.3 7.9 8.2 3.7 19.6 8.4 5.1 2.8 45.3 20.8 28.8 12.0
2006 16.3 8.9 5.4 3.5 17.0 9.1 3.8 3.0 45.2 20.6 27.2 13.0
2005 17.2 10.3 7.0 3.7 19.1 10.3 5.1 3.9 47.9 25.0 29.6 14.9
2004 15.0 10.6 5.7 6.6 15.8 11.0 4.4 2.2 37.9 27.8 22.5 16.8
2003 14.7 12.9 4.3 7.1 15.4 14.2 2.6 6.0 38.8 40.3 23.4 20.7
2002 13.6 13.1 4.5 6.1 15.4 15.1 3.0 5.2 36.8 41.5 20.9 20.5
2001 14.4 9.6 7.2 5.1 15.9 10.1 3.9 3.0 40.1 24.8 22.3 15.4
2000 13.5 7.5 5.7 2.1 13.9 8.2 3.5 1.6 33.7 23.4 19.3 13.1
1999 14.3 11.1 6.2 5.2 15.6 13.6 4.0 4.5 43.7 37.9 23.2 17.6
1998 12.2 10.5 3.6 4.0 13.7 10.8 4.8 4.8 36.6 36.8 18.3 17.8
1997 12.3 9.1 2.7 2.0 14.4 10.6 3.6 4.0 31.1 26.4 18.6 12.8
1996 14.4 12.7 3.8 6.1 15.8 13.4 3.9 4.6 40.5 33.7 21.4 18.3
1995 14.6 11.5 4.0 4.1 15.5 12.2 2.8 3.3 35.8 40.0 22.3 19.1
1994 13.6 13.3 4.7 5.4 15.5 15.4 3.7 3.1 39.1 43.1 22.5 21.5
1993 11.9 14.0 4.9 4.2 12.7 14.8 3.3 5.5 37.3 44.7 21.0 22.1
1992 11.4 12.7 5.8 6.4 12.0 15.4 2.9 3.4 30.9 44.0 16.2 22.2
1991 10.9 13.6 5.6 7.3 12.7 14.6 2.4 3.8 27.2 41.2 16.5 22.8
1990 14.0 15.1 7.3 6.7 15.2 15.9 0.0 0.0 36.3 38.9 20.8 21.5
1989 17.2 15.6 8.9 6.8 18.1 17.0 0.0 0.0 45.3 40.2 25.7 21.7
1988 14.7 13.5 6.6 6.4 16.1 14.4 0.0 0.0 40.6 41.6 22.5 21.1
1987 13.2 14.0 6.5 6.7 15.6 16.0 0.0 0.0 38.6 39.3 21.8 20.4
1986 18.7 13.7 6.5 5.0 20.2 14.7 0.0 0.0 50.8 36.7 28.0 21.0
1985 13.3 15.0 4.7 4.2 14.1 15.7 0.0 0.0 36.3 41.6 21.4 20.6
1984 15.4 15.1 6.4 7.7 17.3 17.3 0.0 0.0 39.4 44.1 23.9 22.4
1983 19.1 12.4 8.0 3.5 21.4 12.8 0.0 0.0 48.7 28.6 26.3 17.4
1982 18.8 11.4 5.9 4.1 19.4 11.8 0.0 0.0 46.8 29.0 25.0 16.3
1981 17.9 16.0 3.1 8.7 18.8 17.7 0.0 0.0 45.8 42.0 24.4 25.5
1980 19.6 15.6 4.2 4.6 21.2 16.1 0.0 0.0 51.0 41.4 25.9 23.0
1979 22.1 20.3 5.8 7.5 24.3 20.7 0.0 0.0 53.8 46.6 28.4 29.7
1978 18.3 14.5 4.8 6.3 19.9 18.8 0.0 0.0 52.8 45.9 24.7 23.2
1977 16.8 18.8 4.7 8.4 17.7 18.8 0.0 0.0 44.4 50.0 22.7 30.7
1976 18.8 11.7 1.4 2.5 19.9 12.2 0.0 0.0 48.5 33.0 24.4 20.8
1975 18.9 12.0 1.5 2.6 20.0 12.5 0.0 0.0 48.9 33.9 24.5 21.4

Fatal vehicle accidents
Type Total countDrunkFatal countPedestrian countPerson countVehicle count
Year JacksonvilleFresnoJacksonvilleFresnoJacksonvilleFresnoJacksonvilleFresnoJacksonvilleFresnoJacksonvilleFresno
1975 104 23 8 5 110 24 0 0 269 65 135 41
1976 104 23 8 5 110 24 0 0 269 65 135 41
1977 94 38 26 17 99 38 0 0 248 101 127 62
1978 103 30 27 13 112 39 0 0 297 95 139 48
1979 125 43 33 16 138 44 0 0 305 99 161 63
1980 112 34 24 10 121 35 0 0 291 90 148 50
1981 104 37 18 20 109 41 0 0 266 97 142 59
1982 111 28 35 10 115 29 0 0 277 71 148 40
1983 115 32 48 9 129 33 0 0 293 74 158 45
1984 94 41 39 21 106 47 0 0 241 120 146 61
1985 83 43 29 12 88 45 0 0 226 119 133 59
1986 118 41 41 15 128 44 0 0 321 110 177 63
1987 85 44 42 21 100 50 0 0 248 123 140 64
1988 96 44 43 21 105 47 0 0 265 136 147 69
1989 114 53 59 23 120 58 0 0 300 137 170 74
1990 94 54 49 24 102 57 0 0 244 139 140 77
1991 74 50 38 27 86 54 16 14 185 152 112 84
1992 78 48 40 24 82 58 20 13 212 166 111 84
1993 82 54 34 16 88 57 23 21 258 172 145 85
1994 95 52 33 21 108 60 26 12 273 168 157 84
1995 103 45 28 16 109 48 20 13 252 157 157 75
1996 102 50 27 24 112 53 28 18 288 133 152 72
1997 88 36 19 8 103 42 26 16 223 105 133 51
1998 88 42 26 16 99 43 35 19 265 147 132 71
1999 104 45 45 21 114 55 29 18 319 153 169 71
2000 99 32 42 9 102 35 26 7 248 100 142 56
2001 108 42 54 22 119 44 29 13 300 108 167 67
2002 103 58 34 27 117 67 23 23 279 184 159 91
2003 113 58 33 32 118 64 20 27 298 181 180 93
2004 117 48 44 30 123 50 34 10 295 126 175 76
2005 135 47 55 17 150 47 40 18 377 114 233 68
2006 130 41 43 16 136 42 30 14 361 95 217 60
2007 147 37 66 17 158 39 41 13 365 97 232 56
2008 115 36 48 17 119 39 20 16 289 82 176 48
2009 101 30 34 11 110 33 33 10 272 78 145 50
2010 102 30 39 6 107 38 27 18 206 96 151 48
2011 82 36 28 9 85 36 26 17 166 75 129 52
2012 111 34 42 13 115 36 40 24 224 60 164 45
2013 123 26 44 3 131 27 41 17 236 72 176 41
2014 105 24 40 4 111 24 36 12 252 50 161 37
2015 118 19 36 5 127 19 42 7 236 49 181 29
2016 143 49 43 12 152 50 47 25 306 98 224 65
2017 145 56 37 17 148 62 47 29 325 134 233 94
2018 128 28 38 4 140 28 47 14 288 54 201 38
2019 151 45 38 14 155 47 54 25 308 96 232 69
2020 172 67 45 16 185 73 58 40 334 133 264 93
2021 176 81 0 0 189 86 51 36 361 183 281 127
Local government: full-time employees
Job JacksonvilleFresno
Airports 289 97
Correction 870 0
Financial administration 693 100
Firefighters 1,283 301
Fire - other 92 47
Health 122 0
Judicial and legal 102 40
Local libraries 319 0
Other and unallocable 814 199
Other government administration 577 96
Parks and recreation 220 71
Police - other 572 242
Police protection - officers 1,681 816
Sewerage 350 163
Solid waste management 179 156
Streets and highways 18 305
Totals for government 9,314 3,361
Water supply 146 262
Water transport and terminals 146 0
Welfare 142 0
Local government: part-time employees
Job JacksonvilleFresno
Airports 1 23
Financial administration 3 9
Gas supply 1 0
Other and unallocable 0 22
Other government administration 0 5
Parks and recreation 0 301
Police - other 0 39
Streets and highways 0 23
Totals for government 9 457
Transit 0 16
Water supply 0 11
Water transport and terminals 4 0
Place of birth - Foreign born
Residents JacksonvilleFresno
All residents 12.3% 19.2%
American Indian / Alaska Native residents 3.4% 16.3%
Asian residents 73.5% 46.9%
Black or African American residents 5.7% 4.1%
Native Hawaiian / Pacific Islander residents 24.9% 26.1%
Other race residents 35.6% 27.1%
Two or more races residents 16.7% 13.3%
White residents 6.9% 6.8%
White alone, not Hispanic / Latino residents 5.9% 6.4%
Place of birth - Native, outside of US
Residents JacksonvilleFresno
All residents 2.6% 1.1%
American Indian / Alaska Native residents 7.0% 1.5%
Asian residents 1.0% 1.7%
Black or African American residents 1.3% 1.1%
Native Hawaiian / Pacific Islander residents 10.5% 6.9%
Other race residents 15.2% 1.2%
Two or more races residents 7.6% 0.8%
White residents 1.4% 1.0%
White alone, not Hispanic / Latino residents 1.3% 0.8%
Place of birth - Born in state of residence
Residents JacksonvilleFresno
All residents 46.9% 70.3%
American Indian / Alaska Native residents 47.8% 75.9%
Asian residents 14.5% 47.1%
Black or African American residents 62.0% 77.6%
Native Hawaiian / Pacific Islander residents 13.0% 42.8%
Other race residents 27.6% 67.3%
Two or more races residents 45.1% 80.1%
White residents 43.9% 74.7%
White alone, not Hispanic / Latino residents 45.7% 72.2%
Place of birth - Born in other state
Residents JacksonvilleFresno
All residents 38.2% 9.4%
American Indian / Alaska Native residents 41.8% 6.3%
Asian residents 10.9% 4.3%
Black or African American residents 30.9% 17.2%
Native Hawaiian / Pacific Islander residents 51.5% 24.3%
Other race residents 21.6% 4.4%
Two or more races residents 30.6% 5.8%
White residents 47.8% 17.5%
White alone, not Hispanic / Latino residents 47.0% 20.6%
English speakers (speaking English at home)
Type Jacksonville Fresno
Born in the United States residents 94.4% 80%
Foreign born residents 22.4% 8.7%
Native, born elsewhere residents 47.2% 55.1%
Total residents 84.3% 56.9%
Mechanisms of homicide
Mechanism JacksonvilleFresno
Homicides from 2000 to 2006 721 458
Cut / Pierce 76 79
Firearm 492 313
Struck by / against 22 0
Suffocation 31 0
Mechanisms of homicide per 1,000,000 residents
Mechanism JacksonvilleFresno
Homicides from 2000 to 2006 126.9 77.8
Cut / Pierce 13.4 13.4
Firearm 86.6 53.2
Struck by / against 3.9 0
Suffocation 5.5 0
Mechanisms of suicide per 1,000,000 residents
Mechanism JacksonvilleFresno
Suicides from 2000 to 2006 140.7 84.8
Firearm 79.2 42.5
Poisoning 27.5 8.8
Suffocation 22.7 25.3

Infrastructure

Jacksonville and Fresno have invested significantly in infrastructure. Jacksonville boasts a modern road network and a renovated downtown area, while Fresno has developed its public transit system and invested in sustainable infrastructure.
Infrastructure
Type Jacksonville Fresno
Hospitals 25 32
TV stations 17 4
Arenas or stadiums 2 2
Bank branches located here 191 98
Bank institutions located here 31 25
Main business address for public companies 23 1
Drinking water stations with no reported violations in the past 20 5
Drinking water stations with reported violations in the past 20 43

Schools

School facilities
Type Jacksonville Fresno
Private elementary/middle schools 38 8
Private high schools 56 9
Public elementary/middle schools 145 131
Public high schools 55 44
Colleges/Universities 30 14
HMDA - Conventional home purchase loans - Applications denied
Year JacksonvilleFresno
1999 5,422 717
2000 4,132 484
2001 3,038 462
2002 2,017 569
2003 3,563 1,510
2004 4,781 2,462
2005 7,134 3,394
2006 8,812 3,441
2007 5,298 2,138
2008 1,719 760
2009 676 354

Culture and Food

Both cities boast rich cultural histories. Jacksonville has a vibrant arts scene, while Fresno is known for its agricultural roots and food-oriented festivals.

Sports Teams

Sports fans will find something to love in both cities. Jacksonville is home to the Jaguars of the NFL, while Fresno hosts the Fresno Grizzlies, a minor league baseball team.
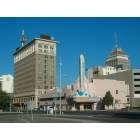