Jacksonville, Florida and Jersey City, New Jersey, cater to different lifestyles and preferences with distinctive characteristics. Jacksonville, the largest city in terms of land area within the continental US, avails residents and tourists an expansive Southern charm, outdoor recreational activities, and a more relaxing lifestyle. In contrast, Jersey City, directly across the Hudson River from Lower Manhattan, offers urban living, proximity to New York City, and a vibrant mix of cultures. Comparing their aspects in terms of crime and safety, weather, cost of living, education, work and economy, infrastructure, industries and occupations, biggest employers, real-estate, neighborhoods, transportation, city and state taxes, culture, sports teams, geographical conditions and health care will provide a well-rounded picture of life in both cities.
Distance between
Jacksonville, FL and
Jersey City, NJ : 835.2 miles
Jacksonville's population is larger by 236%. Its population has grown by 218,997 people (29.8%) since 2000. The population of Jersey City has grown by 43,872 people (18.3%) during that time.
Historically, both cities have had issues with crime but have seen improvements. Jacksonville's crime rate is higher than the U.S. average but varies by neighborhood. Local law enforcement is undertaking new initiatives to tackle crime. Jersey City, too, has decreased its crime rates over time, largely due to significant urban renewal projects. Its crime rate is close to the national average. As in any city, the safety level can vary vastly depending on the specific area.
Cost of Living
Living in Jacksonville is significantly cheaper than in Jersey City. This applies to housing, groceries, utilities, and transportation. Jacksonville's cost of living is below the national average, while Jersey City's is considerably higher, particularly due to high housing costs.
Income Tax
Jacksonville residents benefit from the absence of a state income tax in Florida. Jersey City residents are subject to New Jersey's state income tax, which ranges from 1.4% to 10.75%, plus a city payroll tax for work performed within the city.
Property Tax
Property tax rates are higher in Jersey City compared to Jacksonville. Property owners in Jersey City may apply for abatements to reduce their property tax burden. Lower property taxes and costs make Jacksonville attractive for potential homeowners.
Sales Tax
Florida does not have a state income tax, making Jacksonville an attractive choice for people aiming to lower their tax burden. The local sales tax rate in Jacksonville is 7%. New Jersey does not have a city sales tax and the state rate is 6.625%. Jersey City residents also incur a local income tax.
Income
Type
Jacksonville
Jersey City
Estimated median household income
$58,621
$81,958
Estimated per capita income
$32,953
$51,119
Cost of living index (U.S. average is 100)
88.3
123.5
If you make $50,000 in Jacksonville, you will have to make $69,932 in Jersey City to maintain the same standard of living.
Geographical Conditions
Jacksonville's spread-out geography offers a variety of landscapes, from riverfront views to Atlantic Ocean beaches. Jersey City benefits from its waterfront location with spectacular views of Manhattan and the Statue of Liberty.
Both cities are served by large public school districts. Jacksonville schools generally have lower ratings, but there are highly rated public and private schools. Jersey City offers some highly rated schools with a variety of choice programs. Notable colleges in Jacksonville include University of North Florida and Jacksonville University. Jersey City houses schools like New Jersey City University and Saint Peter's University.
Jacksonville has a broad economic base with sectors like health care, education, finance, and logistics playing significant roles. Jersey City is a key player in sectors such as finance, insurance, real estate, and health care. Unemployment rates in both cities are similar to the national average.
Biggest Employers
Jacksonville's largest employers include Naval Air Station Jacksonville, Duval County Public Schools, and the city government. In Jersey City, the largest employers are financial institutions like Goldman Sachs and Chase Bank, as well as the local government and the Jersey City Medical Center.
There were 1,310 building permits issued in Jacksonville in 2012 (353 more than in 2011) compared to 245 building permits issued in Jersey City in 2012 (245 more than in 2011).
In Jacksonville (Duval County), 47.9% voted for Democrats and 51.5% for Republicans in 2012 Presidential Election. In Jersey City (Hudson County), 77.7% voted for Democrats and 21.5% for Republicans.
Elections
Type
Democrats
Republicans
Other
Year
Jacksonville
Jersey City
Jacksonville
Jersey City
Jacksonville
Jersey City
2020
51.3%
72.8%
47.5%
26.4%
1.2%
0.8%
2016
47.2%
74.6%
48.6%
22.3%
4.2%
3.1%
2012
47.9%
77.7%
51.5%
21.5%
0.6%
0.9%
2008
49.0%
73.3%
51.0%
26.3%
0.0%
0.4%
2004
41.7%
67.4%
57.9%
32.1%
0.3%
0.5%
2000
40.9%
71.0%
57.7%
26.3%
1.4%
2.7%
1996
44.2%
69.9%
50.0%
23.1%
5.8%
7.0%
Breakdown of population affiliated with a religious congregation
Type
Adherents
Congregations
Religion
Jacksonville
Jersey City
Jacksonville
Jersey City
SOUTHERN BAPTIST CONVENTION
15.8%
0.4%
22.3%
3.4%
CATHOLIC CHURCH
9.0%
44.3%
2.8%
13.9%
EPISCOPAL CHURCH
1.2%
0.3%
2.3%
3.2%
MUSLIM ESTIMATE
0.7%
3.3%
0.6%
3.4%
EVANGELICAL LUTHERAN CHURCH IN AMERICA
0.3%
0.4%
0.9%
5.8%
SEVENTH DAY ADVENTIST CHURCH
0.3%
0.5%
1.4%
3.9%
AMERICAN BAPTIST CHURCHES IN THE USA
0.1%
0.8%
0.2%
4.7%
COPTIC ORTHODOX CHURCH
0.0%
0.7%
0.2%
1.1%
Weather
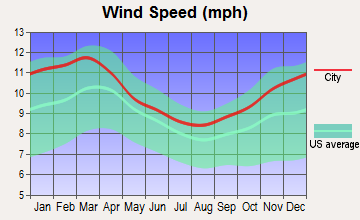
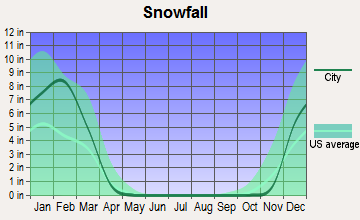
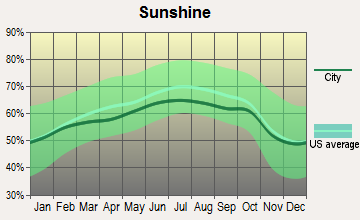
Jacksonville boasts a subtropical climate with mild winters and hot, humid summers. Natural disasters such as hurricanes can happen. Jersey City experiences a humid subtropical climate with cold winters and hot, humid summers. Both cities receive considerable precipitation throughout the year, but Jacksonville receives more sunshine.
Weather and climate
Type
Jacksonville
Jersey City
Temperature - Average
68.3°F
54.7°F
Humidity - Average morning or afternoon humidity
78.4%
67.3%
Humidity - Differences between morning and afternoon humidity
44%
29.7%
Humidity - Maximum monthly morning or afternoon humidity
92%
76.9%
Humidity - Minimum monthly morning or afternoon humidity
48%
47.2%
Precipitation - Yearly average
51.8 in
47.5 in
Snowfall - Yearly average
0 in
58.8 in
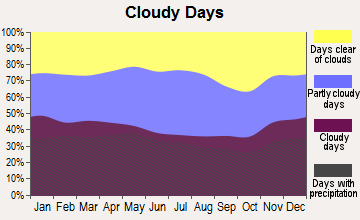
Clouds - Number of days clear of clouds
15.8%
16.5%
Sunshine amount - Average
69.6%
60.2%
Sunshine amount - Differences during a year
16%
20%
Sunshine amount - Maximum monthly
74%
64%
Sunshine amount - Minimum monthly
58%
44%
Wind speed - Average
7.2 mph
9.2 mph
Average climate in Jacksonville, Florida
Average climate in Jersey City, New Jersey
Air pollution
Type
AQI
CO
NO2
OZONE
PB
PM10
PM25
SO2
Year
Jacksonville
Jersey City
Jacksonville
Jersey City
Jersey City
Jacksonville
Jersey City
Jacksonville
Jersey City
Jersey City
Jacksonville
Jersey City
Jacksonville
Jersey City
2018
78
93
N/A
0.33
19.2
N/A
24.5
23.9
N/A
N/A
N/A
N/A
7.1
9.2
N/A
0.6
2017
74
95
N/A
0.33
20.1
N/A
24.7
23.6
N/A
N/A
N/A
N/A
5.8
10.6
0.7
0.5
2016
65
93
0.50
0.37
20.5
N/A
24.9
24.1
N/A
N/A
N/A
N/A
5.2
9.6
0.4
0.7
2015
63
100
0.35
0.58
17.8
N/A
25.4
24.0
N/A
N/A
N/A
N/A
4.9
7.5
0.3
0.5
2014
66
95
0.27
0.56
18.5
N/A
24.3
23.3
N/A
N/A
N/A
N/A
5.9
7.1
0.7
0.7
2013
68
96
0.18
0.63
18.8
N/A
23.0
23.7
N/A
N/A
N/A
N/A
5.3
8.0
0.7
0.6
2012
66
98
0.10
0.69
18.2
N/A
24.0
23.5
N/A
N/A
N/A
N/A
5.8
9.3
0.6
1.0
2011
88
107
0.28
0.59
20.4
N/A
26.6
22.6
N/A
N/A
N/A
N/A
8.1
10.1
0.8
2.3
2010
77
112
0.31
0.52
19.0
N/A
26.4
24.6
N/A
N/A
N/A
N/A
7.1
10.4
0.8
1.8
2009
72
104
0.16
0.53
20.8
N/A
25.0
20.4
N/A
N/A
N/A
N/A
8.5
12.4
0.6
2.4
2008
75
108
0.15
0.57
21.9
N/A
27.6
21.2
N/A
0.013
N/A
N/A
10.0
17.3
0.9
3.5
2007
92
120
0.29
0.65
22.8
N/A
28.4
21.6
N/A
0.016
N/A
N/A
11.4
14.0
1.2
4.1
2006
87
116
0.35
0.86
23.8
N/A
29.0
20.9
N/A
0.018
N/A
N/A
10.8
12.7
1.4
6.0
2005
93
107
0.42
1.04
25.2
N/A
26.5
19.9
N/A
N/A
N/A
N/A
12.2
N/A
1.8
7.8
2004
92
106
0.40
1.06
24.8
N/A
25.2
18.8
N/A
0.030
N/A
N/A
12.4
N/A
1.4
8.3
2003
55
107
0.43
1.07
26.5
N/A
21.6
18.2
N/A
0.019
26.8
N/A
N/A
N/A
1.6
8.6
2002
59
122
0.49
1.02
27.4
N/A
22.2
19.7
0.003
0.008
26.3
N/A
N/A
N/A
1.7
7.0
2001
74
121
0.49
1.02
28.9
N/A
24.0
23.8
0.009
0.020
28.2
N/A
N/A
N/A
2.5
9.0
2000
85
115
0.52
1.13
29.3
N/A
25.1
22.2
0.017
0.022
22.2
N/A
N/A
N/A
3.0
7.8
Natural disasters
Type
Jacksonville
Jersey City
Tornado activity compared to U.S. average
75.2%
60.7%
Earthquake activity compared to U.S. average
18.1%
31.3%
Natural disasters compared to U.S. average
24%
21%
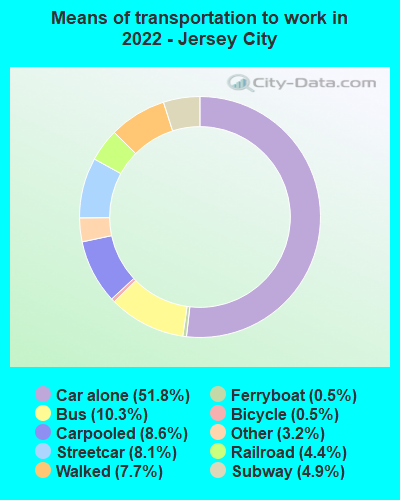
Transportation
Jacksonville is more car-centric given its sprawl. It has public transportation but the service is less frequent. Jersey City's compact area results in a better public transportation network, including PATH train service to Manhattan and extensive bus services. Both cities have international airports.
Transport
Type
Jacksonville
Jersey City
Amtrak stations
1
0
Amtrak stations nearby
1
3
FAA registered aircraft
566
0
FAA registered aircraft manufacturers and dealers
34
0
Means of transportation to work
Type
Jacksonville
Jersey City
Bicycle
0.2%
1%
Bus
1.1%
8.5%
Carpooled
9%
10.9%
Car alone
86.5%
56.2%
Ferryboat
0%
0.5%
Motorcycle
0.2%
0%
Railroad
0%
2.2%
Streetcar
0%
6.8%
Subway
0%
1.8%
Taxicab
0.2%
0.4%
Walked
1.2%
10.6%
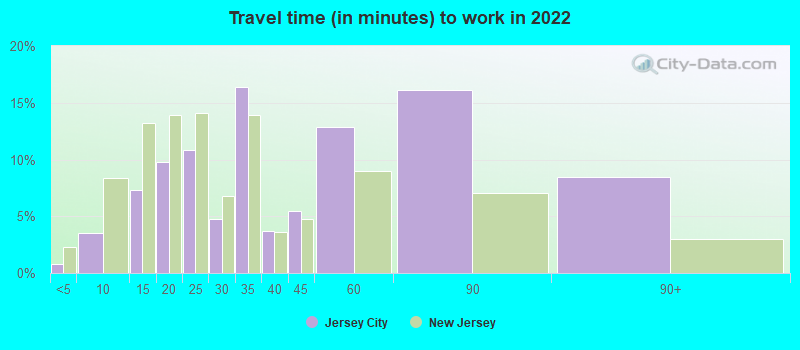
Average travel time to work
Type
Jacksonville
Jersey City
Average
27.5 min
37.9 min
Other means
25 min
29.3 min
Public transportation
43.7 min
43.3 min
Private vehicle occupancy
Type
Jacksonville
Jersey City
Average
1.1
1.2
Drove alone
89.4%
86.9%
In 2 person carpool
8%
11.4%
In 3 person carpool
1.7%
1%
In 4 person carpool
0.7%
0.6%
In 7+ person carpool
0.2%
0%
How many people usually rode to work in the car, truck or van.
Real Estate
Real estate in Jacksonville is generally cheaper, with a mix of residential options from urban condos to suburban homes. Jersey City's housing market is pricier with high demand for multi-story apartments and condos, particularly with views of Manhattan.
Neighborhoods
Jacksonville offers a wide array of neighborhoods, each with a unique personality, from the beach vibes of Neptune Beach to the historic charm of Riverside. Jersey City, on the other hand, is known for diverse neighborhoods like Downtown Jersey City, which is popular for its waterfront and urban conveniences, and Journal Square, known for its rich cultural diversity and Victorian architecture.
Houses and residents
Type
Jacksonville
Jersey City
Houses
422,315
131,609
Average household size (people)
2.5
2.5
Median year apartment built
1985
1973
Median year house/condo built
1987
1958
Length of stay in the house since moving in
12.5 years
14.7 years
Houses occupied
386,283 (91.5%)
119,158 (90.5%)
Houses occupied by owners
226,429 (58.6%)
34,358 (28.8%)
Houses occupied by renters
159,854 (41.4%)
84,800 (71.2%)
Median rent asked for vacant for-rent units
$1,444
$3,976
Median monthly housing costs
$1,154
$1,802
Median price asked for vacant for-sale houses and condos
$260,045
$189,931
Estimated median house or condo value
$239,400
$487,400
Median numbers of rooms
5.6
3.8
Median number of rooms in apartments
4.3
3.5
Median number of rooms in houses and condos
6.3
4.9
Median house price - detached houses
$282,276
$528,884
Median house price - in 2-unit structures
$177,341
$575,313
Median house price - in 3-to-4-unit structures
$144,947
$573,856
Median house price - in 5 or more unit structures
$220,508
$607,790
Median house price - Townhouses or other attached units
$213,709
$605,198
Median house price - All housing units
$266,926
$579,559
Median house age
36
51
Renting percentage
38.3%
70.5%
Housing density (houses/condos per square mile)
557.4
8,823.3
House value disparities
33.2%
26.6%
Household income disparities
44.2%
47.2%
Median household income for houses/condes with a mortgage
$83,160
$134,110
Median household income for apartments without a mortgage
$59,777
$76,768
Housing units without a mortgage
2,439 (1.6%)
238 (1.1%)
Housing units with both a second mortgage and home equity loan
8,460 (5.5%)
1,275 (5.8%)
Housing units with a mortgage
150,468 (98.4%)
21,710 (98.9%)
Housing units with a home equity loan
255 (0.2%)
0 (0%)
Housing units with a second mortgage
11,378 (7.4%)
1,438 (6.6%)
House/condo owner moved in on average (years ago)
10
12
House/condo renter moved in on average (years ago)
1
1
Housing units lacking complete kitchen facilities
1.5%
2.1%
Housing units lacking complete plumbing facilities
1.4%
0.6%
Housing units in structures
Housing units in structures
Jacksonville
Jersey City
One, detached
59.4%
7.6%
One, attached
6.1%
6.0%
Two
2.1%
20.0%
3 or 4
5.3%
10.7%
5 to 9
5.0%
10.0%
10 to 19
7.9%
5.8%
20 to 49
4.9%
10.4%
50 or more
5.3%
29.4%
Mobile homes
3.8%
0.1%
Boats, RVs, vans, etc.
0.2%
0.1%
Median real estate property taxes paid for housing units
Self-employed workers in own not incorporated business
19,601
6,079
State government workers
13,692
4,015
Unpaid family workers
1,066
400
Industries and Occupations
In Jacksonville, the most common industries include health care, finance, and logistics. The city is home to several military bases. Jersey City, part of the New York metropolitan area, has a strong presence in finance, insurance, and real estate, with many working in management and sales roles.
Jacksonville houses several hospitals, including the highly regarded Mayo Clinic. Jersey City Medical Center is the largest provider of healthcare services in Hudson County.
Health (county statistics)
Type
Jacksonville
Jersey City
General health status score of residents in this county from 1 (poor) to 5 (excellent)
Jacksonville's expansive size means infrastructure varies by area. Its downtown is seeing redevelopment. Jersey City's infrastructure is well-developed, especially in its downtown and waterfront areas. Both cities have significant ongoing construction and redevelopment projects.
Infrastructure
Type
Jacksonville
Jersey City
Hospitals
25
6
TV stations
17
30
Bank branches located here
191
58
Bank institutions located here
31
18
Main business address for public companies
23
11
Drinking water stations with no reported violations in the past
20
0
Drinking water stations with reported violations in the past
HMDA - Conventional home purchase loans - Applications denied
Year
Jacksonville
Jersey City
1999
5,422
427
2000
4,132
603
2001
3,038
514
2002
2,017
580
2003
3,563
756
2004
4,781
1,127
2005
7,134
1,625
2006
8,812
1,929
2007
5,298
1,618
2008
1,719
932
2009
676
348
Culture and Food
Jacksonville's Southern roots influence its culture, evident in its food scene with delicious Southern cuisine and seafood. Cultural institutions like the Cummer Museum of Art provide cultural enrichment. In contrast, Jersey City boasts a multicultural vibe with a food scene reflecting its ethnic diversity. It benefits from proximity to the rich cultural landscape of New York City.
Sports Teams
Jacksonville is home to the Jacksonville Jaguars (NFL). It also hosts the annual Florida vs. Georgia college football rivalry. Jersey City doesn't have professional sports teams, but sports fans have easy access to New York City's numerous pro teams.


 Jacksonville, FL
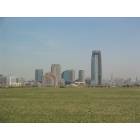
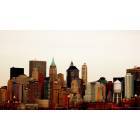
 Jersey City, NJ