Jacksonville, Florida and Norfolk, Virginia are two cities that are uniquely compelling and provide distinct lifestyles. As one navigates the decision to relocate or visit, factors such as crime and safety, cost of living, education, economy, and culture can greatly impact the choice. With Jacksonville's tropical climate and Norfolk's vibrant waterfront, the two cities offer different experiences to both residents and tourists. This comparison covers significant areas to guide individuals in making an informed choice.
Distance between
Jacksonville, FL and
Norfolk, VA : 549.6 miles
Jacksonville's population is larger by 306%. Its population has grown by 218,997 people (29.8%) since 2000. The population of Norfolk has grown by 686 people (0.3%) during that time.
Comparatively, both Jacksonville and Norfolk have higher crime rates than the national average. According to the FBI Uniform Crime reports, Jacksonville's rate of property crime is above average, signaling caution to potential residents and visitors. Similarly, Norfolk's crime rates are not the lowest and demonstrate a concern for safety. In both cities, there is a safer neighbourhood discrepancy with some places safer than others.
Cost of Living
Jacksonville's cost of living is somewhat lower than that of Norfolk. The primary differences lie in the costs of housing and transportation, which are higher in Norfolk. However, Norfolk has a more robust public transportation network which may offset some of these costs.
Income Tax
Florida, where Jacksonville is located, does not have any state income tax. Virginia, however, imposes a state income tax of up to 5.75%, which might be significant for potential residents considering Norfolk.
Property Tax
Property tax rates vary largely based on the county. Jacksonville's property tax rates are generally lower than that of Norfolk, making it more affordable in the long term for prospective homeowners.
Sales Tax
Jacksonville residents enjoy the benefits of low taxes, with a combined city and state sales tax rate of 7%. However, Norfolk has a marginally higher combined city and state sales tax rate of 6%.
Income
Type
Jacksonville
Norfolk
Estimated median household income
$58,621
$58,591
Estimated per capita income
$32,953
$33,362
Cost of living index (U.S. average is 100)
88.3
96.6
If you make $50,000 in Jacksonville, you will have to make $54,700 in Norfolk to maintain the same standard of living.
Geographical Conditions
Jacksonville is located on the northeastern coast of Florida, with Atlantic Ocean beaches. Norfolk, positioned in the southeastern corner of Virginia, has rivers and the Chesapeake Bay, offering excellent waterfront views.
In the domain of education, Norfolk has a higher percentage of residents with college degrees compared to Jacksonville. Norfolk is also home to several higher education institutes including the prestigious Eastern Virginia Medical School and Old Dominion University. Jacksonville has a number of post-secondary institutions too, but Norfolk has a slight edge in higher education options.
Both cities have diverse economies with multiple industries contributing to job creation. Jacksonville’s economy is driven by sectors such as finance, healthcare, aviation and logistics. Norfolk, on the other hand, has a strong presence of the military and defense sectors, along with healthcare, transportation and education.
Biggest Employers
In Jacksonville, the largest employers are the local school boards, followed by the federal government and hospitals. On the other hand, in Norfolk, the biggest employers are the U.S. Department of Defense, including the Navy and Norfolk City School Board.
There were 1,310 building permits issued in Jacksonville in 2012 (353 more than in 2011) compared to 303 building permits issued in Norfolk in 2012 (78 more than in 2011).
In Jacksonville (Duval County), 47.9% voted for Democrats and 51.5% for Republicans in 2012 Presidential Election. In Norfolk (Norfolk city), 72.5% voted for Democrats and 26.8% for Republicans.
Elections
Type
Democrats
Republicans
Other
Year
Jacksonville
Norfolk
Jacksonville
Norfolk
Jacksonville
Norfolk
2020
51.3%
71.7%
47.5%
26.1%
1.2%
2.2%
2016
47.2%
68.4%
48.6%
25.8%
4.2%
5.8%
2012
47.9%
72.5%
51.5%
26.8%
0.6%
0.8%
2008
49.0%
71.5%
51.0%
28.2%
0.0%
0.3%
2004
41.7%
61.7%
57.9%
37.4%
0.3%
0.9%
2000
40.9%
61.8%
57.7%
35.5%
1.4%
2.7%
1996
44.2%
62.6%
50.0%
31.1%
5.8%
6.3%
Breakdown of population affiliated with a religious congregation
Type
Adherents
Congregations
Religion
Jacksonville
Norfolk
Jacksonville
Norfolk
SOUTHERN BAPTIST CONVENTION
15.8%
6.3%
22.3%
11.6%
CATHOLIC CHURCH
9.0%
4.7%
2.8%
2.6%
EPISCOPAL CHURCH
1.2%
2.0%
2.3%
3.7%
MUSLIM ESTIMATE
0.7%
4.2%
0.6%
1.1%
EVANGELICAL LUTHERAN CHURCH IN AMERICA
0.3%
0.6%
0.9%
1.1%
SEVENTH DAY ADVENTIST CHURCH
0.3%
0.4%
1.4%
0.7%
AMERICAN BAPTIST CHURCHES IN THE USA
0.1%
3.4%
0.2%
3.7%
PRESBYTERIAN CHURCH IN AMERICA
0.1%
0.3%
0.9%
1.5%
Weather
In terms of weather, the two locations offer quite different experiences. Jacksonville’s climate is humid subtropical, with hot summers and mild winters. On the other hand, Norfolk experiences a humid subtropical climate with moderately cold winters. This means that Jacksonville has a more attractive weather for those who prefer warm temperatures year-round.
Weather and climate
Type
Jacksonville
Norfolk
Temperature - Average
68.3°F
59.6°F
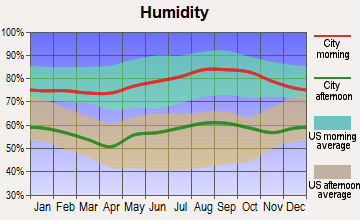
Humidity - Average morning or afternoon humidity
78.4%
73%
Humidity - Differences between morning and afternoon humidity
44%
32%
Humidity - Maximum monthly morning or afternoon humidity
92%
83%
Humidity - Minimum monthly morning or afternoon humidity
48%
51%
Precipitation - Yearly average
51.8 in
46.3 in
Snowfall - Yearly average
0 in
15.4 in
Clouds - Number of days clear of clouds
15.8%
17.6%
Sunshine amount - Average
69.6%
66.8%
Sunshine amount - Differences during a year
16%
14%
Sunshine amount - Maximum monthly
74%
67%
Sunshine amount - Minimum monthly
58%
53%
Wind speed - Average
7.2 mph
10.4 mph
Average climate in Jacksonville, Florida
Average climate in Norfolk, Virginia
Air pollution
Type
AQI
CO
NO2
OZONE
PB
PM25
SO2
Year
Jacksonville
Norfolk
Jacksonville
Norfolk
Norfolk
Jacksonville
Norfolk
Jacksonville
Norfolk
Jacksonville
Norfolk
Jacksonville
Norfolk
2018
78
57
N/A
0.29
7.0
N/A
24.5
30.9
N/A
0.002
7.1
6.1
N/A
0.3
2017
74
60
N/A
0.23
7.6
N/A
24.7
33.0
N/A
0.002
5.8
6.9
0.7
0.3
2016
65
66
0.50
0.22
7.3
N/A
24.9
31.5
N/A
0.002
5.2
6.1
0.4
0.3
2015
63
57
0.35
0.27
8.1
N/A
25.4
33.5
N/A
0.002
4.9
6.4
0.3
0.5
2014
66
59
0.27
0.28
8.3
N/A
24.3
33.5
N/A
0.002
5.9
6.8
0.7
1.2
2013
68
66
0.18
0.28
7.8
N/A
23.0
30.9
N/A
0.002
5.3
6.8
0.7
1.2
2012
66
76
0.10
0.30
8.4
N/A
24.0
34.2
N/A
0.002
5.8
8.1
0.6
1.2
2011
88
66
0.28
0.27
10.2
N/A
26.6
34.8
N/A
0.003
8.1
8.8
0.8
1.7
2010
77
80
0.31
0.24
6.4
N/A
26.4
38.2
N/A
0.004
7.1
N/A
0.8
2.2
2009
72
54
0.16
0.24
9.8
N/A
25.0
31.5
N/A
0.012
8.5
N/A
0.6
2.5
2008
75
77
0.15
0.24
10.3
N/A
27.6
36.2
N/A
0.004
10.0
N/A
0.9
3.5
2007
92
81
0.29
0.17
12.2
N/A
28.4
36.4
N/A
0.004
11.4
N/A
1.2
4.6
2006
87
62
0.35
0.34
N/A
N/A
29.0
36.3
N/A
0.004
10.8
N/A
1.4
3.4
2005
93
67
0.42
0.28
N/A
N/A
26.5
35.5
N/A
N/A
12.2
N/A
1.8
3.5
2004
92
80
0.40
0.29
15.9
N/A
25.2
33.4
N/A
N/A
12.4
N/A
1.4
4.4
2003
55
84
0.43
0.33
16.2
N/A
21.6
34.3
N/A
N/A
N/A
N/A
1.6
4.1
2002
59
99
0.49
0.41
17.8
N/A
22.2
38.0
0.003
N/A
N/A
N/A
1.7
6.4
2001
74
92
0.49
0.41
18.2
N/A
24.0
36.4
0.009
N/A
N/A
N/A
2.5
6.3
2000
85
85
0.52
0.43
15.7
N/A
25.1
36.6
0.017
N/A
N/A
N/A
3.0
6.8
Natural disasters
Type
Jacksonville
Norfolk
Tornado activity compared to U.S. average
75.2%
69.9%
Earthquake activity compared to U.S. average
18.1%
36.4%
Natural disasters compared to U.S. average
24%
0%
Transportation
Jacksonville transportation network is primarily car-dependent, with some public transit options provided by the Jacksonville Transportation Authority. Norfolk has a more robust public transit system which includes buses, light rail, and ferries operated by Hampton Roads Transit.
Transport
Type
Jacksonville
Norfolk
Amtrak stations
1
1
Amtrak stations nearby
1
3
FAA registered aircraft
566
106
FAA registered aircraft manufacturers and dealers
34
4
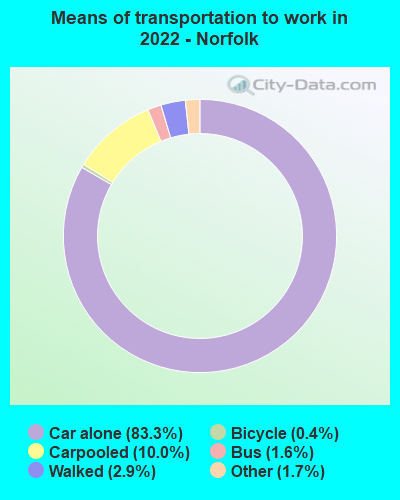
Means of transportation to work
Type
Jacksonville
Norfolk
Bicycle
0.2%
0.4%
Bus
1.1%
1.7%
Carpooled
9%
9.2%
Car alone
86.5%
83%
Motorcycle
0.2%
0.2%
Taxicab
0.2%
0.3%
Walked
1.2%
4.1%
Average travel time to work
Type
Jacksonville
Norfolk
Average
27.5 min
26.5 min
Other means
25 min
21.4 min
Public transportation
43.7 min
43.4 min
Private vehicle occupancy
Type
Jacksonville
Norfolk
Average
1.1
1.1
Drove alone
89.4%
89.2%
In 2 person carpool
8%
8.4%
In 3 person carpool
1.7%
1.6%
In 4 person carpool
0.7%
0.3%
In 5-6 person carpool
0%
0.4%
In 7+ person carpool
0.2%
0%
How many people usually rode to work in the car, truck or van.
Real Estate
Both cities offer attractive real estate markets, with Jacksonville generally being more affordable than Norfolk. Jacksonville presents more new construction and suburban-style living while Norfolk offers more historic homes and urban living.
Neighborhoods
Each city has distinct neighborhoods with unique characteristics. Jacksonville's beachside communities such as Atlantic Beach offer a laid-back lifestyle. Downtown Jacksonville has seen significant growth and development. Norfolk's Ghent neighborhood is known for its historic homes, while the Downtown area offers more urban living options.
Houses and residents
Type
Jacksonville
Norfolk
Houses
422,315
102,423
Average household size (people)
2.5
2.4
Median year apartment built
1985
1970
Median year house/condo built
1987
1958
Length of stay in the house since moving in
12.5 years
12.3 years
Houses occupied
386,283 (91.5%)
97,596 (95.3%)
Houses occupied by owners
226,429 (58.6%)
44,867 (46%)
Houses occupied by renters
159,854 (41.4%)
52,729 (54%)
Median rent asked for vacant for-rent units
$1,444
$517.27
Median monthly housing costs
$1,154
$1,196
Median price asked for vacant for-sale houses and condos
$260,045
$166,683
Estimated median house or condo value
$239,400
$250,300
Median numbers of rooms
5.6
5.3
Median number of rooms in apartments
4.3
4.2
Median number of rooms in houses and condos
6.3
6.6
Median house price - detached houses
$282,276
$306,640
Median house price - in 2-unit structures
$177,341
$250,782
Median house price - in 3-to-4-unit structures
$144,947
$117,518
Median house price - in 5 or more unit structures
$220,508
$260,910
Median house price - mobile homes
$87,589
$23,245
Median house price - Townhouses or other attached units
$213,709
$267,013
Median house price - All housing units
$266,926
$296,270
Median house age
36
56
Renting percentage
38.3%
54.6%
Housing density (houses/condos per square mile)
557.4
1,906.3
House value disparities
33.2%
33.9%
Household income disparities
44.2%
44.5%
Median household income for houses/condes with a mortgage
$83,160
$101,012
Median household income for apartments without a mortgage
$59,777
$66,099
Housing units without a mortgage
2,439 (1.6%)
741 (2.2%)
Housing units with both a second mortgage and home equity loan
8,460 (5.5%)
1,418 (4.1%)
Housing units with a mortgage
150,468 (98.4%)
33,471 (97.8%)
Housing units with a home equity loan
255 (0.2%)
128 (0.4%)
Housing units with a second mortgage
11,378 (7.4%)
2,277 (6.7%)
House/condo owner moved in on average (years ago)
10
9
House/condo renter moved in on average (years ago)
1
1
Housing units lacking complete kitchen facilities
1.5%
1.8%
Housing units lacking complete plumbing facilities
1.4%
1%
Housing units in structures
Housing units in structures
Jacksonville
Norfolk
One, detached
59.4%
48.2%
One, attached
6.1%
7.7%
Two
2.1%
4.8%
3 or 4
5.3%
10.2%
5 to 9
5.0%
10.1%
10 to 19
7.9%
6.0%
20 to 49
4.9%
4.1%
50 or more
5.3%
8.2%
Mobile homes
3.8%
0.7%
Boats, RVs, vans, etc.
0.2%
0.0%
Median real estate property taxes paid for housing units
Self-employed workers in own not incorporated business
19,601
4,402
State government workers
13,692
5,009
Unpaid family workers
1,066
102
Industries and Occupations
In Jacksonville, the dominant industries are health care, finance, and logistics. In Norfolk, however, the presence of naval bases and ports shape the economy, making the military and port operations significant employers.
Both Jacksonville and Norfolk have excellent healthcare facilities. Jacksonville is home to the renowned Mayo Clinic, while Norfolk has Sentara Norfolk General Hospital, both of which are ranked among the best hospitals in their respective states.
Health (county statistics)
Type
Jacksonville
Norfolk
General health status score of residents in this county from 1 (poor) to 5 (excellent)
Jacksonville with its larger area boasts of more expansive and modern infrastructure, especially in the domain of real estate. Norfolk's infrastructure is more traditional with a definitive maritime influence, thanks to its prime location on the Chesapeake Bay.
Infrastructure
Type
Jacksonville
Norfolk
Hospitals
25
13
TV stations
17
26
Arenas or stadiums
2
1
Bank branches located here
191
59
Bank institutions located here
31
14
Main business address for public companies
23
4
Nuclear power plants nearby
0
2
Drinking water stations with no reported violations in the past
20
1
Drinking water stations with reported violations in the past
HMDA - Conventional home purchase loans - Applications denied
Year
Jacksonville
Norfolk
1999
5,422
0
2000
4,132
0
2001
3,038
0
2002
2,017
0
2003
3,563
520
2004
4,781
804
2005
7,134
854
2006
8,812
929
2007
5,298
604
2008
1,719
223
2009
676
92
Culture and Food
When it comes to culture and food, both cities have a diverse scene. Jacksonville is known for its southern culture, seafood cuisine, and music festivals. Norfolk, on the other hand, has a blend of Southern and coastal culture with seafood and international cuisines to enjoy.
Sports Teams
Jacksonville is home to the NFL's Jacksonville Jaguars. Norfolk does not have a major professional sports team, but it hosts minor league teams and is near Virginia Beach, which is home to various professional sports.


 Jacksonville, FL
 Norfolk, VA