Jacksonville, Florida, and Providence, Rhode Island, offer starkly different living experiences due to their unique geographical locations, weather patterns, economies, and cultures. Both cities are known for certain attributes that might make them attractive or less appealing depending on individual’s preferences and lifestyle choices. This comprehensive comparison will examine both the similarities and contrasts across several key domains: crime and safety, weather, cost of living, education, work and economy, industries and occupations, real-estate, transportation and commuting, taxes, culture and food, sports, geographical conditions, and health care.
Distance between
Jacksonville, FL and
Providence, RI : 977.5 miles
Jacksonville's population is larger by 403%. Its population has grown by 218,997 people (29.8%) since 2000. The population of Providence has grown by 16,074 people (9.3%) during that time.
When it comes to safety, both Jacksonville and Providence have their challenges. Jacksonville, despite its ongoing efforts to improve safety, has a relatively high crime rate compared to the national average, particularly violent crime. However, Providence, while having a lower overall crime rate, has specific areas with increased crime incidents. As with any city, safety can fluctuate greatly depending on the neighborhood. Tourists should do their research ahead of time and residents should stay alert and aware.
Cost of Living
Generally, the cost of living in Jacksonville is lower compared to Providence. This primarily reflects differences in housing costs, where Providence ranks significantly higher. Additionally, certain expenses like groceries and healthcare tend to be more affordable in Jacksonville. However, Providence may be a more affordable choice when it comes to state taxes.
Income Tax
As mentioned above, Jacksonville residents benefit from Florida's lack of a state income tax. In contrast, Providence residents are subject to Rhode Island's state income tax, which may be a significant factor for those considering relocating.
Property Tax
Property tax rates in Providence are significantly higher than in Jacksonville, which can be a significant consideration for home buyers. However, this might be offset by Rhode Island having lower homeowners insurance rates, given Florida's vulnerability to hurricanes.
Sales Tax
Florida does not have a state income tax, making Jacksonville potentially more appealing to many. On the other hand, Rhode Island has a state income tax, but a slightly lower sales tax compared to Florida. Tax considerations can make a significant difference depending on an individual's income and spending habits.
Income
Type
Jacksonville
Providence
Estimated median household income
$58,621
$60,970
Estimated per capita income
$32,953
$32,495
Cost of living index (U.S. average is 100)
88.3
93.9
If you make $50,000 in Jacksonville, you will have to make $53,171 in Providence to maintain the same standard of living.
Geographical Conditions
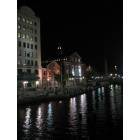
Jacksonville is known for its wide expanse and access to the Atlantic coast, offering beautiful beaches and water-based activities. Providence, the third-largest city in New England, offers a more urban feel with a charming historical downtown area and access to both the Atlantic Ocean and several rivers.
For education, Providence enjoys the privilege of boasting several renowned higher education institutions, most famously Brown University. The public-school system in Providence, however, struggles with performance. Conversely, Jacksonville doesn't have as many prestigious universities but manages a better public education system. For families, the decision might depend on the age of the children and access to private education resources.
The economy of Jacksonville is bolstered by sectors such as the military, banking, logistics, and healthcare. Providence's economy is more diversified, with strong sectors in healthcare, education, and manufacturing. In terms of job growth, Jacksonville tends to perform better, but Providence provides unique job opportunities in industries such as design and education.
Biggest Employers
In Jacksonville, the Naval Air Station, Duval County Public Schools, and the city of Jacksonville are the largest employers. Meanwhile, in Providence, the state of Rhode Island, Lifespan Hospital Group, and Brown University are the largest employers, reflecting the city's focus on public service, healthcare, and education.
There were 1,310 building permits issued in Jacksonville in 2012 (353 more than in 2011) compared to 1 building permits issued in Providence in 2012 (11 less than in 2011).
In Jacksonville (Duval County), 47.9% voted for Democrats and 51.5% for Republicans in 2012 Presidential Election. In Providence (Providence County), 66.7% voted for Democrats and 31.7% for Republicans.
Elections
Type
Democrats
Republicans
Other
Year
Jacksonville
Providence
Jacksonville
Providence
Jacksonville
Providence
2020
51.3%
60.8%
47.5%
37.8%
1.2%
1.3%
2016
47.2%
57.5%
48.6%
36.6%
4.2%
5.9%
2012
47.9%
66.7%
51.5%
31.7%
0.6%
1.7%
2008
49.0%
66.2%
51.0%
32.0%
0.0%
1.7%
2004
41.7%
62.9%
57.9%
35.8%
0.3%
1.3%
2000
40.9%
65.5%
57.7%
28.2%
1.4%
6.3%
1996
44.2%
63.6%
50.0%
23.5%
5.8%
12.9%
Breakdown of population affiliated with a religious congregation
Type
Adherents
Congregations
Religion
Jacksonville
Providence
Jacksonville
Providence
SOUTHERN BAPTIST CONVENTION
15.8%
0.0%
22.3%
1.7%
CATHOLIC CHURCH
9.0%
44.0%
2.8%
23.4%
EPISCOPAL CHURCH
1.2%
1.4%
2.3%
6.3%
MUSLIM ESTIMATE
0.7%
0.2%
0.6%
1.2%
SEVENTH DAY ADVENTIST CHURCH
0.3%
0.3%
1.4%
3.9%
AMERICAN BAPTIST CHURCHES IN THE USA
0.1%
1.5%
0.2%
10.7%
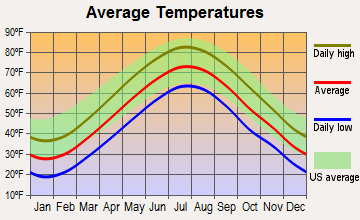
Weather
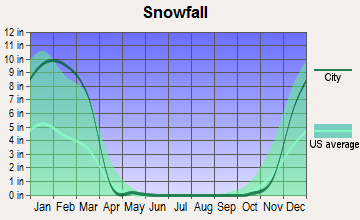
The weather in Jacksonville and Providence is drastically different. Jacksonville has a subtropical climate, with hot, humid summers and mild winters, making it an attractive choice for individuals seeking year-round warm weather and beach access. On the other hand, Providence has a humid continental climate, characterized by warm summers and cold, often snowy winters. This variation might appeal to those who enjoy four distinct seasons.
Weather and climate
Type
Jacksonville
Providence
Temperature - Average
68.3°F
50.7°F
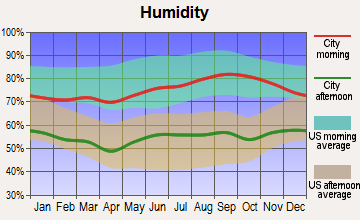
Humidity - Average morning or afternoon humidity
78.4%
70.3%
Humidity - Differences between morning and afternoon humidity
44%
33%
Humidity - Maximum monthly morning or afternoon humidity
92%
82%
Humidity - Minimum monthly morning or afternoon humidity
48%
49%
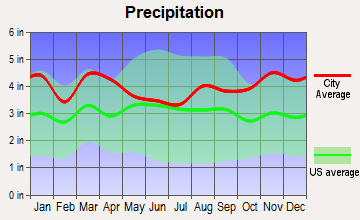
Precipitation - Yearly average
51.8 in
47.7 in
Snowfall - Yearly average
0 in
72.7 in
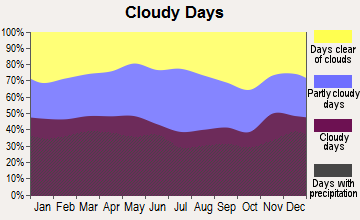
Clouds - Number of days clear of clouds
15.8%
16.2%
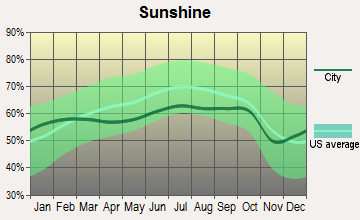
Sunshine amount - Average
69.6%
62%
Sunshine amount - Differences during a year
16%
16%
Sunshine amount - Maximum monthly
74%
64%
Sunshine amount - Minimum monthly
58%
48%
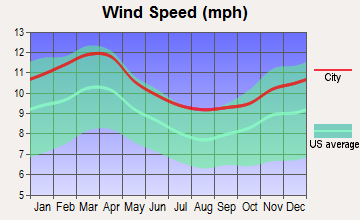
Wind speed - Average
7.2 mph
10 mph
Average climate in Jacksonville, Florida
Average climate in Providence, Rhode Island
Air pollution
Type
AQI
CO
NO2
OZONE
PB
PM25
SO2
Year
Jacksonville
Providence
Jacksonville
Providence
Providence
Jacksonville
Providence
Jacksonville
Providence
Jacksonville
Providence
Jacksonville
Providence
2018
78
77
N/A
0.20
N/A
N/A
24.5
31.1
N/A
N/A
7.1
7.1
N/A
0.3
2017
74
75
N/A
0.21
8.8
N/A
24.7
30.6
N/A
N/A
5.8
6.3
0.7
0.2
2016
65
82
0.50
0.21
9.2
N/A
24.9
30.0
N/A
N/A
5.2
7.5
0.4
0.3
2015
63
86
0.35
0.23
10.6
N/A
25.4
29.3
N/A
N/A
4.9
7.9
0.3
0.4
2014
66
74
0.27
0.23
10.5
N/A
24.3
28.9
N/A
N/A
5.9
6.0
0.7
0.6
2013
68
97
0.18
0.22
10.3
N/A
23.0
30.9
N/A
N/A
5.3
9.7
0.7
0.5
2012
66
94
0.10
0.23
10.1
N/A
24.0
32.6
N/A
N/A
5.8
8.2
0.6
1.4
2011
88
86
0.28
0.23
11.4
N/A
26.6
31.0
N/A
N/A
8.1
8.7
0.8
1.3
2010
77
79
0.31
0.20
9.8
N/A
26.4
31.0
N/A
N/A
7.1
6.3
0.8
1.4
2009
72
75
0.16
0.24
11.2
N/A
25.0
N/A
N/A
N/A
8.5
5.8
0.6
1.8
2008
75
73
0.15
0.24
12.3
N/A
27.6
N/A
N/A
N/A
10.0
N/A
0.9
2.1
2007
92
86
0.29
0.25
13.9
N/A
28.4
N/A
N/A
N/A
11.4
N/A
1.2
4.1
2006
87
81
0.35
0.40
15.2
N/A
29.0
N/A
N/A
N/A
10.8
N/A
1.4
4.6
2005
93
91
0.42
0.40
17.4
N/A
26.5
N/A
N/A
N/A
12.2
N/A
1.8
5.8
2004
92
83
0.40
0.46
17.7
N/A
25.2
N/A
N/A
N/A
12.4
N/A
1.4
6.8
2003
55
86
0.43
0.54
18.9
N/A
21.6
N/A
N/A
N/A
N/A
N/A
1.6
6.3
2002
59
101
0.49
0.61
18.3
N/A
22.2
N/A
0.003
N/A
N/A
N/A
1.7
6.1
2001
74
109
0.49
0.53
20.2
N/A
24.0
N/A
0.009
0.019
N/A
N/A
2.5
7.5
2000
85
91
0.52
0.51
20.1
N/A
25.1
N/A
0.017
N/A
N/A
N/A
3.0
6.7
Natural disasters
Type
Jacksonville
Providence
Tornado activity compared to U.S. average
75.2%
52%
Earthquake activity compared to U.S. average
18.1%
26.6%
Natural disasters compared to U.S. average
24%
17%
Transportation
Jacksonville is spread out and a city where a car is almost necessary. Public transit exists but is not as developed or widespread. On the other hand, Providence, due to its smaller size, offers more efficient public transportation and is also more walkable and bike-friendly.
Transport
Type
Jacksonville
Providence
Amtrak stations
1
1
Amtrak stations nearby
1
1
FAA registered aircraft
566
48
FAA registered aircraft manufacturers and dealers
34
1
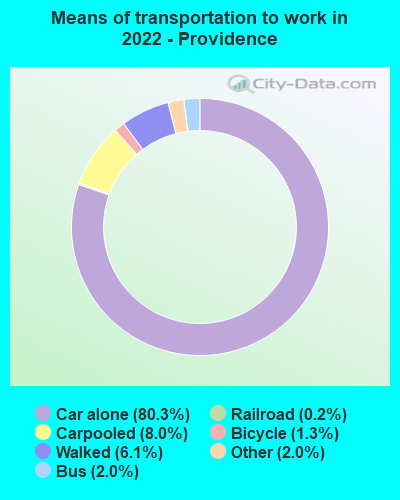
Means of transportation to work
Type
Jacksonville
Providence
Bicycle
0.2%
0.3%
Bus
1.1%
3.2%
Carpooled
9%
10.4%
Car alone
86.5%
78.2%
Motorcycle
0.2%
0%
Railroad
0%
1%
Subway
0%
0.5%
Taxicab
0.2%
0.2%
Walked
1.2%
5.2%
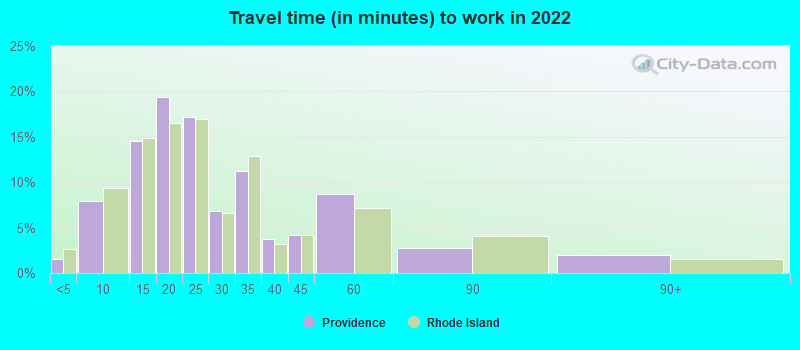
Average travel time to work
Type
Jacksonville
Providence
Average
27.5 min
24.7 min
Other means
25 min
20.9 min
Public transportation
43.7 min
36.9 min
Private vehicle occupancy
Type
Jacksonville
Providence
Average
1.1
1.2
Drove alone
89.4%
83.5%
In 2 person carpool
8%
13.1%
In 3 person carpool
1.7%
1.7%
In 4 person carpool
0.7%
0.7%
In 5-6 person carpool
0%
0.7%
In 7+ person carpool
0.2%
0.3%
How many people usually rode to work in the car, truck or van.
Real Estate
Real estate prices differ significantly, with the Providence market being more expensive than that of Jacksonville. The median home price in Providence is higher, while Jacksonville affords more house for your money, particularly in the suburbs.
Neighborhoods
Jacksonville offers a range of neighborhoods, from beach towns like Neptune Beach to historic areas like Avondale. In Providence, College Hill is known for being home to Brown University and a vibrant cultural scene, while Federal Hill is recognized for its exceptional Italian-American community and cuisine.
Houses and residents
Type
Jacksonville
Providence
Houses
422,315
78,329
Average household size (people)
2.5
2.6
Length of stay in the house since moving in
12.5 years
12 years
Houses occupied
386,283 (91.5%)
68,179 (87%)
Houses occupied by owners
226,429 (58.6%)
27,713 (40.6%)
Houses occupied by renters
159,854 (41.4%)
40,466 (59.4%)
Median rent asked for vacant for-rent units
$1,444
$1,281
Median monthly housing costs
$1,154
$1,343
Median price asked for vacant for-sale houses and condos
$260,045
$266,596
Estimated median house or condo value
$239,400
$291,200
Median numbers of rooms
5.6
4.7
Median number of rooms in apartments
4.3
4.3
Median number of rooms in houses and condos
6.3
5.7
Median house price - detached houses
$282,276
$434,470
Median house price - in 2-unit structures
$177,341
$305,545
Median house price - in 3-to-4-unit structures
$144,947
$338,565
Median house price - in 5 or more unit structures
$220,508
$296,317
Median house price - Townhouses or other attached units
$213,709
$326,633
Median house price - All housing units
$266,926
$379,757
Median house age
36
2,021
Renting percentage
38.3%
65.1%
Housing density (houses/condos per square mile)
557.4
4,241.6
House value disparities
33.2%
33.7%
Household income disparities
44.2%
48.7%
Median household income for houses/condes with a mortgage
$83,160
$98,451
Median household income for apartments without a mortgage
$59,777
$73,826
Housing units without a mortgage
2,439 (1.6%)
555 (2.7%)
Housing units with both a second mortgage and home equity loan
8,460 (5.5%)
2,250 (10.7%)
Housing units with a mortgage
150,468 (98.4%)
20,388 (97.3%)
Housing units with a home equity loan
255 (0.2%)
88 (0.4%)
Housing units with a second mortgage
11,378 (7.4%)
2,692 (12.9%)
House/condo owner moved in on average (years ago)
10
8
House/condo renter moved in on average (years ago)
1
3
Housing units lacking complete kitchen facilities
1.5%
2.7%
Housing units lacking complete plumbing facilities
1.4%
0.6%
Housing units in structures
Housing units in structures
Jacksonville
Providence
One, detached
59.4%
24.2%
One, attached
6.1%
2.9%
Two
2.1%
20.0%
3 or 4
5.3%
29.3%
5 to 9
5.0%
5.3%
10 to 19
7.9%
2.0%
20 to 49
4.9%
2.6%
50 or more
5.3%
13.5%
Mobile homes
3.8%
0.3%
Boats, RVs, vans, etc.
0.2%
0.0%
Median real estate property taxes paid for housing units
Self-employed workers in own not incorporated business
19,601
4,620
State government workers
13,692
3,764
Unpaid family workers
1,066
73
Industries and Occupations
Jacksonville is home to many military and defense contractors, while also having a robust finance and healthcare sector. Meanwhile, Providence has a high concentration of professionals in the education, healthcare, and creative design industries, reflecting the city's academic and creative spirit.
Jacksonville is home to top-tier medical facilities, including the Mayo Clinic. Providence also has a strong healthcare system, anchored by the Lifespan Hospital Group. While the cities offer good healthcare, access and costs should be taken into consideration.
Health (county statistics)
Type
Jacksonville
Providence
General health status score of residents in this county from 1 (poor) to 5 (excellent)
Jacksonville has immense infrastructure due to its size, but public transportation options are limited. Providence, although a smaller city, has better public transport options and is pedestrian and bike-friendly. Both cities offer decent healthcare facilities and have international airports, servicing both tourists and residents.
Infrastructure
Type
Jacksonville
Providence
Hospitals
25
7
TV stations
17
24
Arenas or stadiums
2
3
Bank branches located here
191
43
Bank institutions located here
31
11
Main business address for public companies
23
8
Drinking water stations with no reported violations in the past
20
2
Drinking water stations with reported violations in the past
HMDA - Conventional home purchase loans - Applications denied
Year
Jacksonville
Providence
1999
5,422
381
2000
4,132
421
2001
3,038
447
2002
2,017
425
2003
3,563
786
2004
4,781
1,138
2005
7,134
1,678
2006
8,812
1,738
2007
5,298
1,067
2008
1,719
451
2009
676
149
Culture and Food
Providence has a strong grounding in arts and education with a trusted Italian dining scene. Meanwhile, Jacksonville boasts much in the way of outdoor activities, as well as a growing food and craft beer scene. Both cities are rich in culture, but in different ways, which could make one more appealing than the other depending on personal preferences.
Sports Teams
Jacksonville is home to the NFL team, the Jacksonville Jaguars. Providence, while not hosting any major league teams, is the home of the popular minor league baseball team, the Pawtucket Red Sox, and has the Providence Bruins, a minor league affiliate of the NHL's Boston Bruins.


 Jacksonville, FL
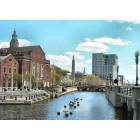
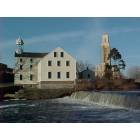
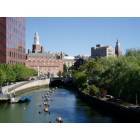
 Providence, RI