**Overview**
If you're considering a relocation or a visit to either Jacksonville, Florida, or St. Louis, Missouri, there are a few elements to keep in mind that may sway your decision. These include factors like safety and crime, weather, cost of living, education, work and the economy, infrastructure, and the prominent industries and occupations in each area. Additionally, consider which are the biggest employers, what the real estate market looks like, available neighborhoods, transportation options, tax rates, the diversity of the culture and food scene, sporting activities, geographical benefits, and the state of healthcare facilities.
Distance between
Jacksonville, FL and
St. Louis, MO : 753.2 miles
Jacksonville's population is larger by 226%. Its population has grown by 218,997 people (29.8%) since 2000. The population of St. Louis has decreased by 54,879 people (15.8%) during that time.
When comparing the safety and crime levels in Jacksonville and St. Louis, residents and visitors may be more at ease in Jacksonville. St. Louis has traditionally had a higher crime rate, particularly in specific neighborhoods. However, there are ongoing initiatives to increase safety and security in the city. Jacksonville, while not entirely crime-free, generally shows lower violent and property crime rates than St. Louis.
Cost of Living
The cost of living in both cities varies. Jacksonville generally has a lower cost of living when stacked up against national averages. This is primarily seen in housing costs. Conversely, St. Louis also has a lower cost of living compared to the national average, but it is mostly reflected in the affordable healthcare, grocery costs, and utilities.
Income Tax
Florida does not have state income tax, which can be a significant draw for individuals considering Jacksonville. In contrast, Missouri does levy state income tax, which can be a factor to consider when comparing the net income potential between the two cities.
Property Tax
While Jacksonville has slightly higher property prices, it has a lower property tax rate (around 0.98%). St. Louis has lower property values but a higher property tax rate (around 1.59%).
Sales Tax
The sales tax in Jacksonville, FL is 7%, whereas the sales tax is a bit higher in St. Louis, MO at 9.679%. These are factors to consider for everyday purchases and budgeting.
Income
Type
Jacksonville
St. Louis
Estimated median household income
$58,621
$49,965
Estimated per capita income
$32,953
$33,810
Cost of living index (U.S. average is 100)
88.3
96.5
If you make $50,000 in Jacksonville, you will have to make $54,643 in St. Louis to maintain the same standard of living.
Geographical Conditions
Jacksonville offers a coastal geography providing direct access to beaches, making it a great spot for outdoor enthusiasts. St. Louis is located along the Mississippi and Missouri Rivers, with rolling hills and plenty of green spaces for outdoor activities.
Both Jacksonville and St. Louis offer quality education. However, according to ranks from U.S. News & World Report, St. Louis offers slightly higher-ranking schools, particularly at the university level, with institutions like Washington University. Jacksonville boasts of reputable schools as well, such as the University of North Florida.
When considering the work and economy of these cities, Jacksonville's economy is more robust, with an unemployment rate lower than the national average. St. Louis’s economy is generally stable, with a slightly higher-than-average unemployment rate.
Biggest Employers
Jacksonville's largest employers are in the healthcare and defense sectors, with Naval Air Station Jacksonville, the U.S Navy, and Baptist Health leading the pack. In St. Louis, the biggest employers are BJC Healthcare, Washington University, and Boeing.
There were 1,310 building permits issued in Jacksonville in 2012 (353 more than in 2011) compared to 146 building permits issued in St. Louis in 2012 (105 more than in 2011).
In Jacksonville (Duval County), 47.9% voted for Democrats and 51.5% for Republicans in 2012 Presidential Election. In St. Louis (St. Louis city), 82.4% voted for Democrats and 15.9% for Republicans.
Elections
Type
Democrats
Republicans
Other
Year
Jacksonville
St. Louis
Jacksonville
St. Louis
Jacksonville
St. Louis
2020
51.3%
82.4%
47.5%
16.1%
1.2%
1.6%
2016
47.2%
79.0%
48.6%
15.8%
4.2%
5.2%
2012
47.9%
82.4%
51.5%
15.9%
0.6%
1.6%
2008
49.0%
83.8%
51.0%
15.5%
0.0%
0.7%
2004
41.7%
80.4%
57.9%
19.2%
0.3%
0.3%
2000
40.9%
77.5%
57.7%
19.9%
1.4%
2.6%
1996
44.2%
74.8%
50.0%
18.1%
5.8%
7.1%
Breakdown of population affiliated with a religious congregation
Type
Adherents
Congregations
Religion
Jacksonville
St. Louis
Jacksonville
St. Louis
SOUTHERN BAPTIST CONVENTION
15.8%
2.5%
22.3%
9.0%
CATHOLIC CHURCH
9.0%
15.4%
2.8%
9.5%
EPISCOPAL CHURCH
1.2%
0.5%
2.3%
1.5%
MUSLIM ESTIMATE
0.7%
1.1%
0.6%
2.4%
LUTHERAN CHURCH
0.3%
2.2%
0.7%
6.1%
SEVENTH DAY ADVENTIST CHURCH
0.3%
0.3%
1.4%
0.5%
AMERICAN BAPTIST CHURCHES IN THE USA
0.1%
1.8%
0.2%
2.4%
Weather
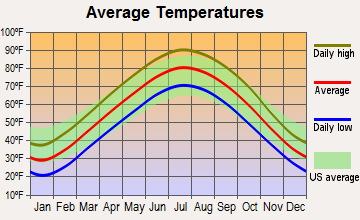
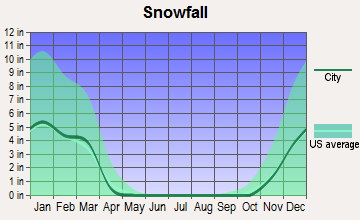
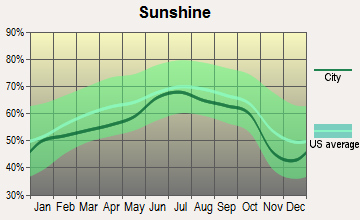
As far as weather is concerned, Jacksonville, FL is warmer with more sunlight year-round, given its proximity to the equator. Summertime is hot and humid, whereas the winters are mild and short. St. Louis, MO experiences a more significant variance in seasons with hot, humid summers, and cold winters – rarely going below freezing but experiencing occasional snowfall.
Weather and climate
Type
Jacksonville
St. Louis
Temperature - Average
68.3°F
56.5°F
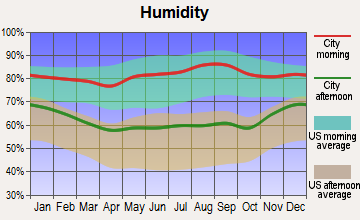
Humidity - Average morning or afternoon humidity
78.4%
74.8%
Humidity - Differences between morning and afternoon humidity
44%
32%
Humidity - Maximum monthly morning or afternoon humidity
92%
85%
Humidity - Minimum monthly morning or afternoon humidity
48%
53%
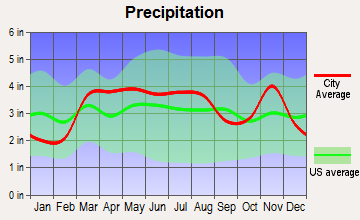
Precipitation - Yearly average
51.8 in
39 in
Snowfall - Yearly average
0 in
37.2 in
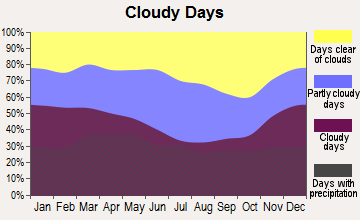
Clouds - Number of days clear of clouds
15.8%
16.7%
Sunshine amount - Average
69.6%
62.2%
Sunshine amount - Differences during a year
16%
30%
Sunshine amount - Maximum monthly
74%
71%
Sunshine amount - Minimum monthly
58%
41%
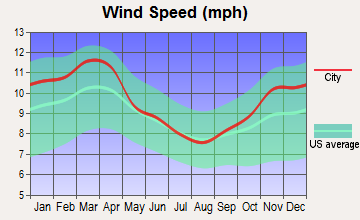
Wind speed - Average
7.2 mph
9.8 mph
Average climate in Jacksonville, Florida
Average climate in St. Louis, Missouri
Air pollution
Type
AQI
CO
NO2
OZONE
PB
PM10
PM25
SO2
Year
Jacksonville
St. Louis
Jacksonville
St. Louis
St. Louis
Jacksonville
St. Louis
Jacksonville
St. Louis
St. Louis
Jacksonville
St. Louis
Jacksonville
St. Louis
2018
78
101
N/A
0.26
10.7
N/A
24.5
27.5
N/A
N/A
19.7
N/A
7.1
9.8
N/A
0.8
2017
74
90
N/A
0.25
10.4
N/A
24.7
28.5
N/A
N/A
16.2
N/A
5.8
8.0
0.7
1.4
2016
65
96
0.50
0.29
11.1
N/A
24.9
25.8
N/A
N/A
15.5
N/A
5.2
8.5
0.4
1.2
2015
63
97
0.35
0.28
11.8
N/A
25.4
22.2
N/A
N/A
16.6
N/A
4.9
10.5
0.3
1.6
2014
66
97
0.27
0.27
12.2
N/A
24.3
25.5
N/A
N/A
17.8
N/A
5.9
10.5
0.7
1.8
2013
68
92
0.18
0.27
12.2
N/A
23.0
26.2
N/A
N/A
16.3
N/A
5.3
10.6
0.7
2.1
2012
66
114
0.10
0.27
14.4
N/A
24.0
27.9
N/A
N/A
17.5
N/A
5.8
10.2
0.6
2.3
2011
88
107
0.28
0.27
13.2
N/A
26.6
27.0
N/A
N/A
17.3
N/A
8.1
12.4
0.8
2.7
2010
77
110
0.31
0.31
12.8
N/A
26.4
23.1
N/A
N/A
16.2
N/A
7.1
12.9
0.8
3.3
2009
72
101
0.16
0.31
12.5
N/A
25.0
22.2
N/A
0.039
21.6
N/A
8.5
12.4
0.6
2.8
2008
75
98
0.15
0.32
12.9
N/A
27.6
22.9
N/A
0.054
32.4
N/A
10.0
12.8
0.9
2.6
2007
92
125
0.29
0.37
14.1
N/A
28.4
24.3
N/A
0.055
38.8
N/A
11.4
14.6
1.2
2.9
2006
87
109
0.35
0.38
15.2
N/A
29.0
23.3
N/A
0.044
38.2
N/A
10.8
14.7
1.4
3.1
2005
93
110
0.42
0.39
16.3
N/A
26.5
24.4
N/A
0.056
41.4
N/A
12.2
N/A
1.8
4.1
2004
92
92
0.40
0.49
20.0
N/A
25.2
19.6
N/A
0.013
38.3
N/A
12.4
N/A
1.4
3.7
2003
55
106
0.43
0.49
19.6
N/A
21.6
21.7
N/A
0.044
37.8
N/A
N/A
N/A
1.6
3.7
2002
59
117
0.49
0.56
21.7
N/A
22.2
21.1
0.003
0.022
45.4
N/A
N/A
N/A
1.7
4.4
2001
74
100
0.49
0.57
22.4
N/A
24.0
20.4
0.009
0.057
46.6
N/A
N/A
N/A
2.5
5.0
2000
85
98
0.52
0.78
23.8
N/A
25.1
20.6
0.017
0.057
N/A
N/A
N/A
N/A
3.0
5.5
Natural disasters
Type
Jacksonville
St. Louis
Tornado activity compared to U.S. average
75.2%
182.4%
Earthquake activity compared to U.S. average
18.1%
413.3%
Natural disasters compared to U.S. average
24%
0%
Transportation
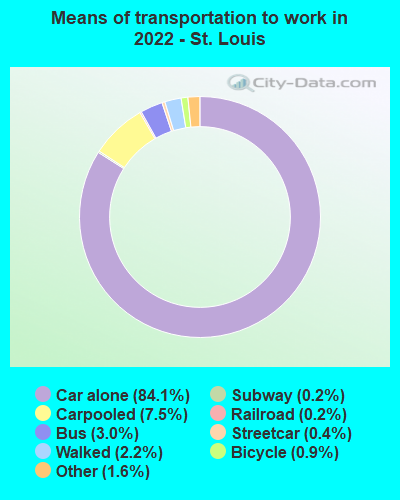
Jacksonville relies heavily on car commuting, with a developing public transportation system. Biking is also popular due to its flat geography. On the other hand, St. Louis offers extensive public transit options, including the MetroLink light rail and MetroBus, along with car commuting.
Transport
Type
Jacksonville
St. Louis
Amtrak stations
1
1
Amtrak stations nearby
1
2
FAA registered aircraft
566
0
FAA registered aircraft manufacturers and dealers
34
0
Means of transportation to work
Type
Jacksonville
St. Louis
Bicycle
0.2%
0.5%
Bus
1.1%
3.7%
Carpooled
9%
7.5%
Car alone
86.5%
83.9%
Motorcycle
0.2%
0.1%
Railroad
0%
0.3%
Streetcar
0%
0.2%
Subway
0%
0.3%
Taxicab
0.2%
0.3%
Walked
1.2%
2.5%
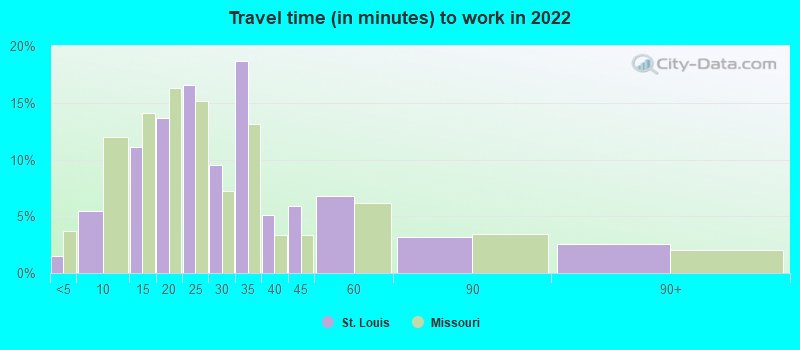
Average travel time to work
Type
Jacksonville
St. Louis
Average
27.5 min
29.4 min
Other means
25 min
22.9 min
Public transportation
43.7 min
42.8 min
Private vehicle occupancy
Type
Jacksonville
St. Louis
Average
1.1
1.1
Drove alone
89.4%
91.6%
In 2 person carpool
8%
6.5%
In 3 person carpool
1.7%
1%
In 4 person carpool
0.7%
0.1%
In 5-6 person carpool
0%
0.1%
In 7+ person carpool
0.2%
0.7%
How many people usually rode to work in the car, truck or van.
Real Estate
The real estate markets in both cities provide affordable options for prospective homebuyers or renters. Though, compared to St. Louis, Jacksonville carries a slightly higher median house price. The housing market in St. Louis leans more towards buyers, with lower house prices but higher property taxes.
Neighborhoods
Both cities offer a blend of residential neighborhoods catering to different lifestyles. Jacksonville is home to coastal neighborhoods like Neptune Beach and historic areas like Riverside. St. Louis has an array of suburban neighborhoods and downtown living options, each with their unique character.
Houses and residents
Type
Jacksonville
St. Louis
Houses
422,315
173,493
Average household size (people)
2.5
2.2
Median year apartment built
1985
1943
Length of stay in the house since moving in
12.5 years
14.2 years
Houses occupied
386,283 (91.5%)
139,736 (80.5%)
Houses occupied by owners
226,429 (58.6%)
63,653 (45.6%)
Houses occupied by renters
159,854 (41.4%)
76,083 (54.4%)
Median rent asked for vacant for-rent units
$1,444
$923.98
Median monthly housing costs
$1,154
$883
Median price asked for vacant for-sale houses and condos
$260,045
$56,913
Estimated median house or condo value
$239,400
$170,800
Median numbers of rooms
5.6
4.8
Median number of rooms in apartments
4.3
4
Median number of rooms in houses and condos
6.3
5.9
Median house price - detached houses
$282,276
$196,007
Median house price - in 2-unit structures
$177,341
$166,673
Median house price - in 3-to-4-unit structures
$144,947
$155,363
Median house price - in 5 or more unit structures
$220,508
$260,843
Median house price - mobile homes
$87,589
$35,054
Median house price - Townhouses or other attached units
$213,709
$272,667
Median house price - All housing units
$266,926
$200,041
Median house age
36
2,021
Renting percentage
38.3%
54.6%
Housing density (houses/condos per square mile)
557.4
2,801.7
House value disparities
33.2%
38.7%
Household income disparities
44.2%
48.3%
Median household income for houses/condes with a mortgage
$83,160
$87,762
Median household income for apartments without a mortgage
$59,777
$55,824
Housing units without a mortgage
2,439 (1.6%)
1,236 (2.9%)
Housing units with both a second mortgage and home equity loan
8,460 (5.5%)
2,537 (6%)
Housing units with a mortgage
150,468 (98.4%)
41,018 (97.1%)
Housing units with a home equity loan
255 (0.2%)
188 (0.4%)
Housing units with a second mortgage
11,378 (7.4%)
3,349 (7.9%)
House/condo owner moved in on average (years ago)
10
10
House/condo renter moved in on average (years ago)
1
2
Housing units lacking complete kitchen facilities
1.5%
9.2%
Housing units lacking complete plumbing facilities
1.4%
5.8%
Housing units in structures
Housing units in structures
Jacksonville
St. Louis
One, detached
59.4%
43.2%
One, attached
6.1%
4.1%
Two
2.1%
14.2%
3 or 4
5.3%
13.5%
5 to 9
5.0%
4.9%
10 to 19
7.9%
2.2%
20 to 49
4.9%
3.8%
50 or more
5.3%
13.5%
Mobile homes
3.8%
0.5%
Boats, RVs, vans, etc.
0.2%
0.0%
Median real estate property taxes paid for housing units
Self-employed workers in own not incorporated business
19,601
8,126
State government workers
13,692
2,962
Unpaid family workers
1,066
315
Industries and Occupations
Jacksonville is primarily known for defense and transportation jobs, given its large military presence and international trade gateway. St. Louis has diverse industries, from aerospace, healthcare, and bio-science to finance and beverages.
Jacksonville is renowned for its healthcare sector, notable for the Mayo Clinic and UF Health Jacksonville. St. Louis also has a robust healthcare scene with world-class facilities such as Barnes-Jewish Hospital.
Health (county statistics)
Type
Jacksonville
St. Louis
General health status score of residents in this county from 1 (poor) to 5 (excellent)
In terms of infrastructure, Jacksonville boasts more modern infrastructure due to its larger geographical size and more recent development. St. Louis maintains a solid infrastructure foundation, with a unique blend of old and new featuring historic neighborhoods and downtown districts.
HMDA - Conventional home purchase loans - Applications denied
Year
Jacksonville
St. Louis
1999
5,422
0
2000
4,132
0
2001
3,038
0
2002
2,017
0
2003
3,563
1,583
2004
4,781
2,101
2005
7,134
2,853
2006
8,812
3,391
2007
5,298
2,022
2008
1,719
841
2009
676
247
Culture and Food
Both cities offer a rich blend of culture and food choices. Jacksonville is influenced by a coastal, Southern charm with a booming food scene that includes seafood, BBQ, and international cuisine. St. Louis boasts a mix of Southern and European influences, evident in its food, which includes renowned BBQ, Italian, and craft beer scenes.
Sports Teams
For the sports enthusiast, Jacksonville is home to the Jacksonville Jaguars (NFL). St. Louis is home to the St. Louis Cardinals (MLB), and St. Louis Blues (NHL), offering more diversity in spectator sports.


 Jacksonville, FL
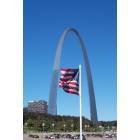
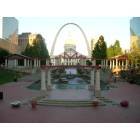
 St. Louis, MO