Jacksonville, FL vs Worcester, MA - Advanced U.S. city comparison tool

Jacksonville, FL vs Worcester, MA

Both Jacksonville, Florida, and Worcester, Massachusetts, offer unique living experiences, each with its own attractions and advantages. Offering warm weather and affordable cost of living, Jacksonville boasts a bustling economy and a vibrant, diverse culture. Worcester, on the other hand, known for its rich history and charming New England vibe, is a hub for education and healthcare. This analysis covers various aspects from crime and safety, to cost of living, education, economy, infrastructure, industries, real estate, neighborhoods, taxes, culture, sports, geography, and healthcare in both cities.


Distance between Jacksonville, FL and Worcester, MA : 989.8 miles

Jacksonville's population is larger by 364%. Its population has grown by 218,997 people (29.8%) since 2000. The population of Worcester has grown by 33,270 people (19.3%) during that time.

Population
Type Jacksonville Worcester
Population 954,614 205,918
Female / male percentage 51.4% / 48.6%
51.4%
48.6%
51.8% / 48.2%
51.8%
48.2%
Racial makeup - percentage
Ethnicity JacksonvilleWorcester
White Non-Hispanic 48.1% 47.9%
Black 29.7% 13.2%
Hispanic 11.6% 26.6%
Two or more 5.0% 5.1%
Asian 4.9% 5.7%
American Indian 0.1% 0.1%
Racial makeup - absolute values
Ethnicity JacksonvilleWorcester
White Non-Hispanic 459,054 98,580
Black 283,190 27,143
Hispanic 110,306 54,733
Two or more 47,991 10,485
Asian 46,726 11,724
American Indian 1,019 117
Pacific Islander 544 78

Crime and Safety

Crime rates are a significant factor when considering relocation or tourism. Jacksonville's overall crime rate is higher than the national average, and also higher than in Worcester. Worcester's crime rate, meanwhile, is slightly higher than the national average, but lower than Jacksonville's. Both cities have ongoing initiatives to improve safety and lower crime. Tourists and residents alike are advised to stay informed about areas of higher crime and take necessary precautions.

Cost of Living

The overall cost of living in Jacksonville is significantly lower than in Worcester, with housing being the most substantial contributing factor. Grocery and transportation costs are also typically higher in Worcester. While Worcester might be costlier, it promises a richer cultural experience and better access to top-quality education and healthcare.

Income Tax

Living in Jacksonville comes with the advantage of no state income tax, while residents in Worcester, MA, are subject to state income tax, contributing to higher living costs within the state of Massachusetts.

Property Tax

Property taxes are higher in Worcester as compared to Jacksonville. This is an important consideration for potential homeowners as it can significantly affect the overall cost of home ownership.

Sales Tax

Florida, including Jacksonville, does not charge a state income tax, making it financially advantageous for residents. Worcester, being part of Massachusetts, imposes a state income tax and has a slightly higher sales tax than Jacksonville.

Income
Type Jacksonville Worcester
Estimated median household income $58,621 $63,194
Estimated per capita income $32,953 $32,772
Cost of living index (U.S. average is 100) 88.3 128.3

If you make $50,000 in Jacksonville, you will have to make $72,650 in Worcester to maintain the same standard of living.

Geographical Conditions

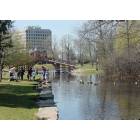
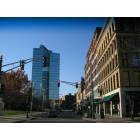
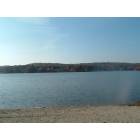
Geographically, Jacksonville offers sandy beaches and riverfront views due to its coastal location in Florida. Worcester, located in central Massachusetts, presents a more hilly landscape with several parks and two prominent lakes.

Geographical information
Type Jacksonville Worcester
Land area 757.7 sq. miles 37.6 sq. miles
Population density 1,259.9 people per sq. mile 5,482.3 people per sq. mile
Elevation 12 feet 480 feet
Relative area comparison
Jacksonville, FL Worcester, MA
First ancestry reported - percentage
Ancestry JacksonvilleWorcester
English 4.5% 1.6%
Irish 4.1% 8.7%
German 3.7% 0.7%
Italian 2.2% 5.4%
Scottish 0.8% 0.3%
Scotch-Irish 0.7% 0.2%
Polish 0.6% 3.1%
French 0.5% 2.3%
Russian 0.4% 0.7%
Arab 0.3% 0.5%
Ukrainian 0.3% 0.1%
Dutch 0.3% 0.1%
Swedish 0.2% 0.7%
West Indian 0.2% 0.3%
Greek 0.2% 0.9%
Norwegian 0.2% 0.1%
French Canadian 0.2% 2.3%
Portuguese 0.1% 0.9%
Lithuanian 0.0% 0.5%
Population origin - absolute values
Ancestry JacksonvilleWorcester
English 24,028 1,757
Irish 21,841 9,817
German 19,924 825
Italian 11,889 6,055
Scottish 4,351 296
Scotch-Irish 3,942 220
Polish 3,334 3,468
French 2,532 2,584
Russian 2,198 771
Dutch 1,581 144
Ukrainian 1,461 111
Arab 1,349 560
French Canadian 1,331 2,607
Norwegian 1,129 122
Greek 1,107 1,040
Swedish 945 788
West Indian 936 286
Welsh 744 106
Portuguese 658 1,020
Hungarian 609 29
Foreign born residents - absolute values
Type Count
Region JacksonvilleWorcester
All 115,577 45,296
Africa 5,768 10,013
Asia 40,318 12,590
Europe 18,002 7,471
Latin America 48,096 14,434
North America 1,647 305
Oceania 393 94
Foreign born residents - percentage
Type Percentage
Region JacksonvilleWorcester
All 12.1% 22.1%
Africa 0.6% 4.9%
Asia 4.2% 6.1%
Europe 1.9% 3.6%
Latin America 5.0% 7.0%
North America 0.2% 0.1%

Education

Worcester shines in the educational aspect with highly regarded institutions such as Worcester Polytechnic Institute and Clark University. On the other hand, Jacksonville hosts the University of North Florida and Jacksonville University, providing quality education but not matching up to Worcester's academic prestige.

School enrollment
Type Jacksonville Worcester
Nursery, preschool 12,987 (5.9%) 1,420 (2.3%)
Kindergarten 12,436 (5.6%) 2,237 (3.6%)
Grade 1 to 4 49,038 (22.2%) 7,863 (12.6%)
Grade 5 to 8 44,676 (20.2%) 10,571 (17%)
Grade 9 to 12 47,624 (21.6%) 9,037 (14.5%)
College undergrad 44,825 (20.3%) 23,527 (37.8%)
Graduate or professional 9,213 (4.2%) 7,614 (12.2%)
Students in private schools - absolute values
Type Count
Grade JacksonvilleWorcester
Grades 1 to 8 (elementary and middle school) 15,629 1,264
Grades 9 to 12 (high school) 5,824 1,075
Undergraduate colleges 10,300 14,549
Students in private schools - percentage
Type Percentage
Grade JacksonvilleWorcester
Grades 1 to 8 (elementary and middle school) 16.7% 6.9%
Grades 9 to 12 (high school) 12.2% 11.9%
Undergraduate colleges 23.0% 61.8%
Educational attainment
Type Jacksonville Worcester
Less than high school 9.2% 16.3%
High school or equiv. 27.5% 25.1%
Less than 1 year of college 7.2% 5.8%
1 or more years of college 14.4% 10.1%
Associate degree 9.5% 8.2%
Bachelor's degree 21.8% 20.9%
Master's degree 7.7% 9.3%
Profess. school degree 1.6% 1.9%
Doctorate degree 1.2% 2.4%
Education level (25-year-olds and older)
Type Jacksonville Worcester
Bachelor's degree or higher 32.3% 34.4%
Graduate or professional degree 10.5% 13.5%
High school or higher 90.8% 83.7%

Work and Economy

Jacksonville's economy is stronger and more diverse, offering broad job opportunities in healthcare, finance, logistics, aviation, and the public sector. In contrast, Worcester's economy is centered on education, healthcare, biotechnology, and services, with less diversity in career options.

Biggest Employers

Jacksonville's biggest employers are the Navy, City of Jacksonville, Duval County Public Schools, and Baptist Health. In Worcester, University of Massachusetts Medical School, Hanover Insurance, and Saint Vincent Hospital are chief employers offering a variety of roles.

Employment and residency - absolute values
Kind JacksonvilleWorcester
Work and live in this city 319,728 42,835
Work and live in this county 426,890 81,300
Workers who work outside the city they live in 415,889 129,813
Workers who work outside the county they live in 33,250 14,955
Working at home 73,598 11,919
Not working at home 386,542 84,336
Daytime population change due to commuting 62,223 20,929
Employment and residency - percentage
Kind JacksonvilleWorcester
Work and live in this city 91.2% 56.7%
Work and live in this county 92.8% 84.5%
Workers who work outside the city they live in 8.8% 43.3%
Workers who work outside the county they live in 7.2% 15.5%
Working at home 16.0% 12.4%
Not working at home 84.0% 87.6%
Daytime population change due to commuting 8.5% 12.1%
Geographical mobility: all
Type all
Mobility JacksonvilleWorcester
Same house 1 year ago 84.4% 83.3%
Moved from abroad 0.3% 1.4%
Moved within same county 9.4% 8.1%
Moved from different state 3.3% 3.7%
Moved within same state 2.6% 3.5%
Geographical mobility: Asian
Type Asian
Mobility JacksonvilleWorcester
Same house 1 year ago 92.0% 71.8%
Moved from abroad 0.2% 12.2%
Moved within same county 4.1% 12.0%
Moved from different state 2.7% 3.6%
Moved within same state 1.0% 0.5%
Geographical mobility: Black
Type Black
Mobility JacksonvilleWorcester
Same house 1 year ago 85.8% 84.9%
Moved from abroad 0.1% 2.2%
Moved within same county 9.9% 5.8%
Moved from different state 2.1% 2.0%
Moved within same state 2.1% 5.2%
Geographical mobility: White
Type White
Mobility JacksonvilleWorcester
Same house 1 year ago 84.6% 82.3%
Moved from abroad 0.2% 0.2%
Moved within same county 8.3% 6.9%
Moved from different state 4.3% 6.3%
Moved within same state 2.6% 4.3%
Building permits
Type Average valueCount
City JacksonvilleWorcesterJacksonvilleWorcester
1997 $111,100 $70,600 3,483 156
1998 $110,500 $63,900 3,796 209
1999 $119,800 $72,400 3,878 227
2000 $114,700 $85,200 3,497 279
2001 $120,300 $86,800 4,832 268
2002 $122,700 $92,200 5,397 410
2003 $126,700 $103,300 5,766 420
2004 $138,800 $94,600 6,067 438
2005 $152,600 $118,300 8,175 366
2006 $157,400 $118,000 6,291 292
2007 $159,100 $148,500 3,449 214
2008 $173,500 $108,900 2,592 61
2009 $179,500 $96,200 1,467 110
2010 $175,800 $100,900 1,397 99
2011 $181,500 $124,300 957 64
2012 $192,500 $117,500 1,310 44
2013 $0 $135,100 0 53
2014 $0 $118,100 0 88
2015 $0 $133,300 0 43
2016 $0 $158,200 0 84
2017 $0 $149,800 0 88
2018 $0 $148,000 0 101
2019 $0 $161,200 0 60
2020 $0 $161,200 0 62
2021 $0 $202,100 0 66

There were 1,310 building permits issued in Jacksonville in 2012 (353 more than in 2011) compared to 66 building permits issued in Worcester in 2012 (2 more than in 2011).

In Jacksonville (Duval County), 47.9% voted for Democrats and 51.5% for Republicans in 2012 Presidential Election. In Worcester (Worcester County), 53.7% voted for Democrats and 44.3% for Republicans.

Elections
Type DemocratsRepublicansOther
Year JacksonvilleWorcesterJacksonvilleWorcesterJacksonvilleWorcester
2020 51.3% 57.6% 47.5% 39.7% 1.2% 2.7%
2016 47.2% 51.0% 48.6% 40.5% 4.2% 8.5%
2012 47.9% 53.7% 51.5% 44.3% 0.6% 2.0%
2008 49.0% 55.8% 51.0% 42.0% 0.0% 2.2%
2004 41.7% 56.6% 57.9% 42.5% 0.3% 0.9%
2000 40.9% 56.2% 57.7% 36.9% 1.4% 6.9%
1996 44.2% 58.3% 50.0% 29.8% 5.8% 11.9%
Breakdown of population affiliated with a religious congregation
Type AdherentsCongregations
Religion JacksonvilleWorcesterJacksonvilleWorcester
SOUTHERN BAPTIST CONVENTION 15.8% 0.2% 22.3% 3.3%
CATHOLIC CHURCH 9.0% 38.4% 2.8% 20.1%
EPISCOPAL CHURCH 1.2% 1.2% 2.3% 4.8%
MUSLIM ESTIMATE 0.7% 0.1% 0.6% 0.3%
EVANGELICAL LUTHERAN CHURCH IN AMERICA 0.3% 0.8% 0.9% 2.2%
SEVENTH DAY ADVENTIST CHURCH 0.3% 0.8% 1.4% 4.6%
AMERICAN BAPTIST CHURCHES IN THE USA 0.1% 0.7% 0.2% 4.6%

Weather

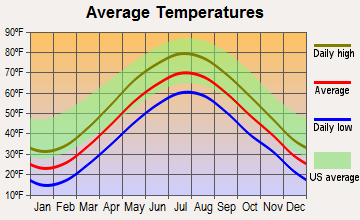
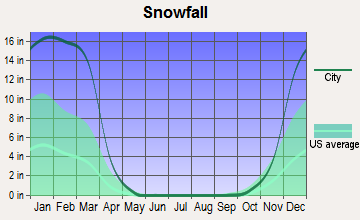
Jacksonville, with its subtropical climate, offers warm summers and mild winters, attracting both sun-seekers and retirees. Worcester experiences a typical New England climate with cold winters and warm summers. Snowy winters can appeal to winter sports enthusiasts but can be challenging for commuting and daily life. Tourists visiting either location should plan their activities based on these distinct weather patterns.

Weather and climate
Type Jacksonville Worcester
Temperature - Average 68.3°F 47.1°F
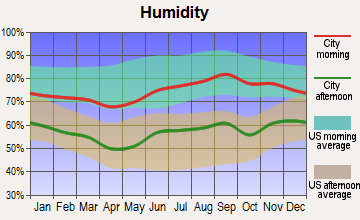
Humidity - Average morning or afternoon humidity 78.4% 71.5%
Humidity - Differences between morning and afternoon humidity 44% 32%
Humidity - Maximum monthly morning or afternoon humidity 92% 81%
Humidity - Minimum monthly morning or afternoon humidity 48% 49.1%
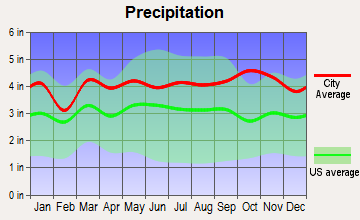
Precipitation - Yearly average 51.8 in 48.9 in
Snowfall - Yearly average 0 in 133.4 in
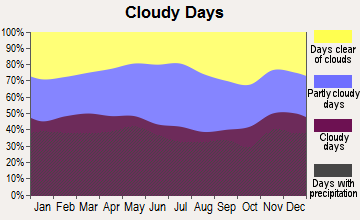
Clouds - Number of days clear of clouds 15.8% 15.2%
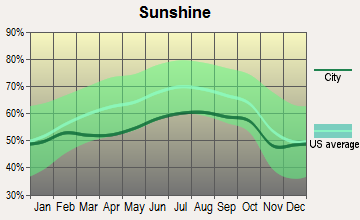
Sunshine amount - Average 69.6% 63%
Sunshine amount - Differences during a year 16% 18.5%
Sunshine amount - Maximum monthly 74% 66.3%
Sunshine amount - Minimum monthly 58% 47.8%
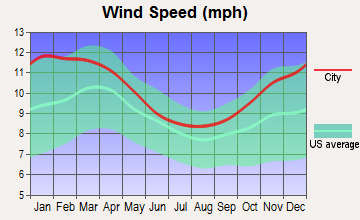
Wind speed - Average 7.2 mph 11 mph

Average climate in Jacksonville, Florida

Chicago, Illinois average temperatures Chicago, Illinois average precipitation Chicago, Illinois humidity Chicago, Illinois wind speed Chicago, Illinois snowfall Chicago, Illinois sunshine Chicago, Illinois clear and cloudy days
 

Average climate in Worcester, Massachusetts

Chicago, Illinois average temperatures Chicago, Illinois average precipitation Chicago, Illinois humidity Chicago, Illinois wind speed Chicago, Illinois snowfall Chicago, Illinois sunshine Chicago, Illinois clear and cloudy days
 

Air pollution
Type AQICONO2OZONEPBPM25SO2
Year JacksonvilleWorcesterJacksonvilleWorcesterWorcester JacksonvilleWorcesterJacksonville JacksonvilleWorcesterJacksonvilleWorcester
2018 78 71 N/A 0.28 11.2 N/A 24.5 31.5 N/A N/A 7.1 6.8 N/A 0.6
2017 74 69 N/A 0.28 11.5 N/A 24.7 32.3 N/A N/A 5.8 5.5 0.7 0.8
2016 65 73 0.50 0.25 12.2 N/A 24.9 33.6 N/A N/A 5.2 6.2 0.4 0.7
2015 63 68 0.35 0.26 13.4 N/A 25.4 32.6 N/A N/A 4.9 7.0 0.3 0.5
2014 66 71 0.27 0.32 13.1 N/A 24.3 33.2 N/A N/A 5.9 7.7 0.7 1.5
2013 68 82 0.18 0.39 11.8 N/A 23.0 34.5 N/A N/A 5.3 8.3 0.7 2.7
2012 66 84 0.10 0.51 12.8 N/A 24.0 37.5 N/A N/A 5.8 7.7 0.6 3.2
2011 88 82 0.28 0.46 17.4 N/A 26.6 34.8 N/A N/A 8.1 9.8 0.8 2.7
2010 77 88 0.31 0.50 13.9 N/A 26.4 37.4 N/A N/A 7.1 9.9 0.8 2.1
2009 72 85 0.16 0.53 14.4 N/A 25.0 N/A N/A N/A 8.5 8.3 0.6 1.1
2008 75 94 0.15 0.54 14.9 N/A 27.6 38.5 N/A N/A 10.0 8.0 0.9 2.6
2007 92 115 0.29 0.52 15.7 N/A 28.4 N/A N/A N/A 11.4 9.0 1.2 3.4
2006 87 98 0.35 0.53 15.2 N/A 29.0 38.7 N/A N/A 10.8 8.8 1.4 2.8
2005 93 101 0.42 0.55 14.9 N/A 26.5 N/A N/A N/A 12.2 10.0 1.8 4.6
2004 92 92 0.40 0.41 15.8 N/A 25.2 N/A N/A N/A 12.4 11.6 1.4 2.6
2003 55 82 0.43 0.51 15.6 N/A 21.6 N/A N/A N/A N/A N/A 1.6 N/A
2002 59 87 0.49 0.52 17.4 N/A 22.2 39.0 0.003 N/A N/A N/A 1.7 N/A
2001 74 98 0.49 0.57 20.0 N/A 24.0 32.6 0.009 N/A N/A N/A 2.5 N/A
2000 85 76 0.52 0.52 18.6 N/A 25.1 31.2 0.017 N/A N/A N/A 3.0 N/A
Natural disasters
Type Jacksonville Worcester
Tornado activity compared to U.S. average 75.2% 79.8%
Earthquake activity compared to U.S. average 18.1% 28.4%
Natural disasters compared to U.S. average 24% 27%

Transportation

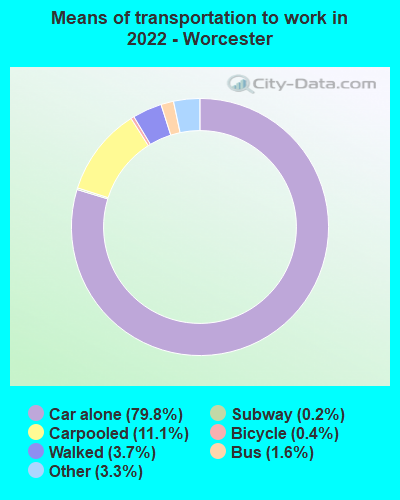
Jacksonville primarily relies on cars, with a less comprehensive public transport system. Worcester offers more robust public transit with its share of buses and trains, making commuting relatively easier for individuals without a vehicle.

Transport
Type Jacksonville Worcester
Amtrak stations 1 0
Amtrak stations nearby 1 2
FAA registered aircraft 566 21
FAA registered aircraft manufacturers and dealers 34 9
Means of transportation to work
Type Jacksonville Worcester
Bicycle 0.2% 0.4%
Bus 1.1% 1.3%
Carpooled 9% 9.8%
Car alone 86.5% 81.3%
Motorcycle 0.2% 0.1%
Railroad 0% 0.4%
Taxicab 0.2% 0.4%
Walked 1.2% 4.6%
Means of transportation to work
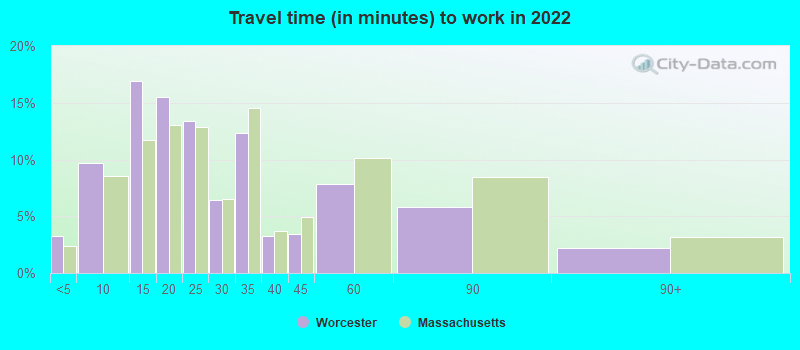
Average travel time to work
Type Jacksonville Worcester
Average 27.5 min 26.5 min
Other means 25 min 23.3 min
Public transportation 43.7 min 34 min
Travel time to work
Time leaving to work
Travel time to work
Time leaving to work
Private vehicle occupancy
Type Jacksonville Worcester
Average 1.1 1.2
Drove alone 89.4% 85.3%
In 2 person carpool 8% 11.9%
In 3 person carpool 1.7% 1.6%
In 4 person carpool 0.7% 0.6%
In 5-6 person carpool 0% 0.3%
In 7+ person carpool 0.2% 0.2%

How many people usually rode to work in the car, truck or van.

Real Estate

Real estate in Jacksonville is generally more affordable than in Worcester. However, both cities offer a range of options from cozy ranch homes to urban apartments. Rental markets reflect the same trends, with higher rents in Worcester.

Neighborhoods

Both cities provide a variety of neighborhoods to suit different lifestyle needs. Jacksonville's coastal neighborhoods like Atlantic Beach offer laid-back living, while downtown districts promise urban convenience. Worcester's West Side offers historic charm, with the downtown area bustling with students and professionals.

Houses and residents
Type Jacksonville Worcester
Houses 422,315 82,375
Average household size (people) 2.5 2.5
Median year apartment built 1985 1960
Median year house/condo built 1987 1952
Length of stay in the house since moving in 12.5 years 15.8 years
Houses occupied 386,283 (91.5%) 76,065 (92.3%)
Houses occupied by owners 226,429 (58.6%) 32,714 (43%)
Houses occupied by renters 159,854 (41.4%) 43,351 (57%)
Median rent asked for vacant for-rent units $1,444 $1,034
Median monthly housing costs $1,154 $1,314
Median price asked for vacant for-sale houses and condos $260,045 $425,443
Estimated median house or condo value $239,400 $317,800
Median numbers of rooms 5.6 5.1
Median number of rooms in apartments 4.3 4.3
Median number of rooms in houses and condos 6.3 6.1
Median house price - detached houses $282,276 $338,239
Median house price - in 2-unit structures $177,341 $252,487
Median house price - in 3-to-4-unit structures $144,947 $352,758
Median house price - in 5 or more unit structures $220,508 $213,457
Median house price - Townhouses or other attached units $213,709 $290,622
Median house price - All housing units $266,926 $317,463
Median house age 36 67
Renting percentage 38.3% 55.5%
Housing density (houses/condos per square mile) 557.4 2,193.1
House value disparities 33.2% 25.3%
Household income disparities 44.2% 46.9%
Median household income for houses/condes with a mortgage $83,160 $102,992
Median household income for apartments without a mortgage $59,777 $78,632
Housing units without a mortgage 2,439 (1.6%) 687 (3%)
Housing units with both a second mortgage and home equity loan 8,460 (5.5%) 2,013 (8.8%)
Housing units with a mortgage 150,468 (98.4%) 22,130 (97%)
Housing units with a home equity loan 255 (0.2%) 289 (1.3%)
Housing units with a second mortgage 11,378 (7.4%) 2,828 (12.4%)
House/condo owner moved in on average (years ago) 10 15
House/condo renter moved in on average (years ago) 1 3
Housing units lacking complete kitchen facilities 1.5% 1.6%
Housing units lacking complete plumbing facilities 1.4% 1.1%
Housing units in structures
Housing units in structures JacksonvilleWorcester
One, detached 59.4% 32.1%
One, attached 6.1% 6.4%
Two 2.1% 7.9%
3 or 4 5.3% 25.1%
5 to 9 5.0% 8.6%
10 to 19 7.9% 5.4%
20 to 49 4.9% 4.4%
50 or more 5.3% 10.0%
Mobile homes 3.8% 0.1%
Boats, RVs, vans, etc. 0.2% 0.0%
Median real estate property taxes paid for housing units
Type Jacksonville Worcester
With mortgages $1,976 (0.8%) $4,316 (1.3%)
With no mortgages $1,563 (0.7%) $4,349 (1.4%)
Marital status
Type Jacksonville Worcester
Divorced 14.3% 9.1%
Never married 35.3% 47%
Now married 43.3% 38.2%
Separated 1.9% 1.8%
Widowed 5.1% 3.9%
Class of workers - percentage
Class of Workers JacksonvilleWorcester
Employee of private company 69.3% 64.0%
Private not-for-profit wage and salary workers 9.4% 14.9%
Local government workers 6.3% 6.9%
Self-employed workers in own not incorporated business 4.3% 5.1%
Self-employed in own incorporated business 4.1% 1.8%
Federal government workers 3.3% 1.6%
State government workers 3.0% 5.7%
Unpaid family workers 0.2% 0.0%
Class of workers - absolute values
Class of Workers JacksonvilleWorcester
Employee of private company 314,902 63,754
Federal government workers 15,074 1,568
Local government workers 28,766 6,913
Private not-for-profit wage and salary workers 42,775 14,830
Self-employed in own incorporated business 18,575 1,793
Self-employed workers in own not incorporated business 19,601 5,036
State government workers 13,692 5,706
Unpaid family workers 1,066 42

Industries and Occupations

In Jacksonville, the dominant sectors are healthcare, finance, logistics, and the public sector, offering a wide range of occupations. Worcester has a higher concentration of education and healthcare jobs with growing industries in biotechnology and professional services.

Most common male industries
Industry JacksonvilleWorcester
Retail trade 12.8% 15.0%
Construction 10.4% 10.4%
Transportation and warehousing 10.3% 6.1%
Finance and insurance 8.0% 3.5%
Accommodation and food services 7.9% 4.1%
Professional, scientific, and technical services 7.7% 10.4%
Manufacturing 7.4% 12.6%
Administrative and support and waste management services 6.8% 3.8%
Other services, except public administration 5.6% 3.2%
Public administration 5.1% 2.9%
Health care and social assistance 5.0% 12.1%
Educational services 3.7% 8.9%
Wholesale trade 3.2% 1.9%
Real estate and rental and leasing 1.8% 1.0%
Arts, entertainment, and recreation 1.8% 1.4%
Utilities 1.3% 0.5%
Information 0.8% 1.9%
Agriculture, forestry, fishing and hunting 0.2% 0.1%
Management of companies and enterprises 0.2% 0.3%
Most common female industries
Industry JacksonvilleWorcester
Health care and social assistance 22.6% 32.3%
Finance and insurance 11.4% 5.1%
Retail trade 11.1% 8.2%
Educational services 8.6% 14.1%
Accommodation and food services 8.4% 8.9%
Professional, scientific, and technical services 7.3% 5.5%
Public administration 4.6% 3.3%
Other services, except public administration 4.5% 5.3%
Administrative and support and waste management services 4.4% 2.6%
Manufacturing 3.9% 5.1%
Transportation and warehousing 3.5% 3.3%
Construction 2.4% 0.8%
Arts, entertainment, and recreation 1.9% 0.6%
Real estate and rental and leasing 1.7% 0.6%
Wholesale trade 1.5% 1.4%
Information 1.4% 1.7%
Utilities 0.7% 0.8%
Management of companies and enterprises 0.0% 0.4%
Most common male occupations
Occupation JacksonvilleWorcester
Management occupations 11.4% 9.1%
Sales and related occupations 9.5% 7.4%
Office and administrative support occupations 8.9% 6.0%
Transportation occupations 8.4% 4.9%
Construction and extraction occupations 7.4% 8.8%
Installation, maintenance, and repair occupations 6.3% 3.1%
Material moving occupations 5.9% 9.1%
Food preparation and serving related occupations 5.6% 3.9%
Computer and mathematical occupations 5.5% 4.0%
Business and financial operations occupations 5.4% 6.4%
Production occupations 4.4% 6.6%
Building and grounds cleaning and maintenance occupations 4.2% 5.2%
Architecture and engineering occupations 2.6% 2.4%
Educational instruction, and library occupations 2.3% 5.3%
Health diagnosing and treating practitioners and other technical occupations 1.8% 1.6%
Law enforcement workers including supervisors 1.7% 1.5%
Arts, design, entertainment, sports, and media occupations 1.5% 2.2%
Firefighting and prevention, and other protective service workers including supervisors 1.4% 0.8%
Health technologists and technicians 1.4% 1.8%
Personal care and service occupations 1.0% 1.2%
Most common female occupations
Occupation JacksonvilleWorcester
Office and administrative support occupations 19.3% 14.3%
Management occupations 10.2% 7.5%
Sales and related occupations 8.7% 6.5%
Health diagnosing and treating practitioners and other technical occupations 7.9% 7.9%
Educational instruction, and library occupations 7.4% 9.1%
Business and financial operations occupations 6.2% 4.5%
Food preparation and serving related occupations 5.8% 7.7%
Healthcare support occupations 4.6% 9.2%
Building and grounds cleaning and maintenance occupations 3.7% 3.0%
Community and social service occupations 3.1% 2.9%
Personal care and service occupations 2.9% 5.4%
Arts, design, entertainment, sports, and media occupations 2.8% 1.1%
Production occupations 2.7% 3.4%
Material moving occupations 2.6% 2.1%
Health technologists and technicians 2.5% 5.1%
Computer and mathematical occupations 2.3% 1.6%
Legal occupations 1.5% 0.7%
Firefighting and prevention, and other protective service workers including supervisors 1.3% 0.6%
Transportation occupations 1.3% 2.0%
Life, physical, and social science occupations 0.9% 2.5%
Food environment data per 10,000 residents
Food environment statistics JacksonvilleWorcester
Number of convenience stores (no gas) 3.3 2.2
Number of convenience stores (with gas) 1.5 1.8
Number of full-service restaurants 7.3 7.3
Number of grocery stores 2.7 1.7
Number of supercenters and club stores 0.1 0.1
Food environment - absolute values
Food environment statistics JacksonvilleWorcester
Number of convenience stores (no gas) 281 174
Number of convenience stores (with gas) 130 140
Number of full-service restaurants 614 569
Number of grocery stores 225 135
Number of supercenters and club stores 10 4
Obesity and diabetes
Food environment statistics rate JacksonvilleWorcester
Adult diabetes rate 10.4% 8.0%
Adult obesity rate 27.5% 24.0%
Low-income preschool obesity rate 10.9% 16.6%

Health Care

Jacksonville hosts Mayo Clinic, highly ranked nationwide, making it a healthcare destination. Worcester also boasts a remarkable healthcare system, with facilities like the UMass Memorial Medical Center, offering quality care and serving as the city's major employer.

Health (county statistics)
Type Jacksonville Worcester
General health status score of residents in this county from 1 (poor) to 5 (excellent) 3.4 3.6
Average weight of females (lbs) 163.1 lbs 159.4 lbs
Average weight of males (lbs) 198.5 lbs 196.8 lbs
Residents visited a dentist within the past year 64.1% 74.9%
Residents exercised in the past month 69.2% 72.8%
Adult residents drank alcohol in the past 30 days 52.3% 59.5%
Residents smoked 100+ cigarettes in their lives 46.4% 45.7%

Fatal vehicle accidents per 100,000 residents
Type Total count per 100,000Drunk per 100,000Fatal count per 100,000Pedestrian count per 100,000Person count per 100,000Vehicle count per 100,000
Year JacksonvilleWorcesterJacksonvilleWorcesterJacksonvilleWorcesterJacksonvilleWorcesterJacksonvilleWorcesterJacksonvilleWorcester
2021 18.4 3.9 0.0 0.0 19.8 3.9 5.3 0.5 37.8 7.8 29.4 6.3
2020 18.1 2.9 4.7 0.5 19.5 2.9 6.1 1.9 35.1 4.8 27.8 4.8
2019 16.5 4.3 4.2 1.1 17.0 4.3 5.9 2.7 33.7 7.6 25.4 6.5
2018 14.2 7.0 4.2 2.7 15.5 7.5 5.2 1.6 31.9 12.4 22.2 10.2
2017 16.2 4.3 4.1 1.6 16.6 4.3 5.3 2.7 36.4 5.4 26.1 5.9
2016 16.2 4.9 4.9 1.6 17.2 4.9 5.3 1.6 34.7 11.9 25.4 8.7
2015 13.6 6.0 4.2 2.2 14.7 6.5 4.8 4.3 27.2 8.7 20.9 9.2
2014 12.3 4.4 4.7 0.0 13.0 4.4 4.2 2.2 29.5 7.7 18.9 5.5
2013 14.6 4.9 5.2 0.5 15.5 4.9 4.9 2.7 28.0 8.8 20.9 8.2
2012 13.3 3.8 5.0 0.5 13.7 3.8 4.8 2.7 26.8 6.0 19.6 4.9
2011 9.9 6.1 3.4 2.8 10.3 6.6 3.1 3.3 20.1 12.7 15.6 8.8
2010 12.4 5.0 4.7 2.2 13.0 6.1 3.3 0.6 25.1 9.4 18.4 7.7
2009 12.4 1.6 4.2 1.1 13.5 1.6 4.1 0.5 33.4 3.8 17.8 3.3
2008 14.2 3.8 5.9 2.2 14.7 3.8 2.5 0.5 35.7 11.0 21.7 7.1
2007 18.3 4.0 8.2 2.3 19.6 4.0 5.1 0.6 45.3 10.3 28.8 7.4
2006 16.3 6.3 5.4 1.1 17.0 8.0 3.8 2.3 45.2 21.6 27.2 10.2
2005 17.2 4.6 7.0 2.9 19.1 5.1 5.1 1.1 47.9 9.7 29.6 8.6
2004 15.0 9.7 5.7 2.9 15.8 9.7 4.4 4.0 37.9 25.2 22.5 14.9
2003 14.7 8.7 4.3 2.9 15.4 9.2 2.6 2.3 38.8 22.5 23.4 13.3
2002 13.6 8.7 4.5 2.9 15.4 8.7 3.0 3.5 36.8 26.1 20.9 11.6
2001 14.4 8.1 7.2 4.1 15.9 9.3 3.9 2.9 40.1 18.6 22.3 10.4
2000 13.5 8.7 5.7 2.3 13.9 8.7 3.5 4.6 33.7 20.3 19.3 12.7
1999 14.3 4.8 6.2 1.8 15.6 4.8 4.0 1.2 43.7 16.2 23.2 12.0
1998 12.2 6.6 3.6 1.8 13.7 6.6 4.8 3.6 36.6 19.2 18.3 12.0
1997 12.3 5.4 2.7 0.6 14.4 5.4 3.6 5.4 31.1 12.6 18.6 7.2
1996 14.4 5.4 3.8 2.4 15.8 5.4 3.9 1.8 40.5 10.8 21.4 6.6
1995 14.6 3.0 4.0 1.2 15.5 3.0 2.8 1.2 35.8 6.6 22.3 4.2
1994 13.6 3.0 4.7 1.2 15.5 3.0 3.7 1.2 39.1 7.8 22.5 4.2
1993 11.9 6.0 4.9 1.8 12.7 6.6 3.3 2.4 37.3 13.1 21.0 7.8
1992 11.4 3.6 5.8 0.0 12.0 3.6 2.9 6.0 30.9 11.4 16.2 4.8
1991 10.9 6.5 5.6 0.6 12.7 6.5 2.4 3.6 27.2 19.0 16.5 8.9
1990 14.0 11.8 7.3 1.8 15.2 11.8 0.0 0.0 36.3 26.5 20.8 14.7
1989 17.2 5.9 8.9 2.4 18.1 7.1 0.0 0.0 45.3 18.3 25.7 9.5
1988 14.7 4.8 6.6 0.0 16.1 5.4 0.0 0.0 40.6 9.5 22.5 4.8
1987 13.2 10.2 6.5 3.6 15.6 10.2 0.0 0.0 38.6 20.3 21.8 12.0
1986 18.7 9.0 6.5 4.8 20.2 10.2 0.0 0.0 50.8 19.2 28.0 12.6
1985 13.3 7.2 4.7 0.6 14.1 9.0 0.0 0.0 36.3 19.3 21.4 9.7
1984 15.4 7.9 6.4 1.8 17.3 7.9 0.0 0.0 39.4 23.6 23.9 13.3
1983 19.1 8.5 8.0 1.8 21.4 9.7 0.0 0.0 48.7 20.1 26.3 11.0
1982 18.8 9.2 5.9 3.1 19.4 9.2 0.0 0.0 46.8 24.5 25.0 11.6
1981 17.9 8.6 3.1 4.3 18.8 9.2 0.0 0.0 45.8 19.7 24.4 11.1
1980 19.6 8.0 4.2 4.3 21.2 8.7 0.0 0.0 51.0 19.8 25.9 11.7
1979 22.1 8.0 5.8 2.5 24.3 8.6 0.0 0.0 53.8 19.6 28.4 11.0
1978 18.3 12.1 4.8 5.5 19.9 12.7 0.0 0.0 52.8 27.9 24.7 15.8
1977 16.8 10.2 4.7 2.4 17.7 10.8 0.0 0.0 44.4 23.5 22.7 11.4
1976 18.8 12.5 1.4 3.6 19.9 13.1 0.0 0.0 48.5 23.9 24.4 13.7
1975 18.9 12.4 1.5 3.5 20.0 13.0 0.0 0.0 48.9 23.6 24.5 13.6

Fatal vehicle accidents
Type Total countDrunkFatal countPedestrian countPerson countVehicle count
Year JacksonvilleWorcesterJacksonvilleWorcesterJacksonvilleWorcesterJacksonvilleWorcesterJacksonvilleWorcesterJacksonvilleWorcester
1975 104 21 8 6 110 22 0 0 269 40 135 23
1976 104 21 8 6 110 22 0 0 269 40 135 23
1977 94 17 26 4 99 18 0 0 248 39 127 19
1978 103 20 27 9 112 21 0 0 297 46 139 26
1979 125 13 33 4 138 14 0 0 305 32 161 18
1980 112 13 24 7 121 14 0 0 291 32 148 19
1981 104 14 18 7 109 15 0 0 266 32 142 18
1982 111 15 35 5 115 15 0 0 277 40 148 19
1983 115 14 48 3 129 16 0 0 293 33 158 18
1984 94 13 39 3 106 13 0 0 241 39 146 22
1985 83 12 29 1 88 15 0 0 226 32 133 16
1986 118 15 41 8 128 17 0 0 321 32 177 21
1987 85 17 42 6 100 17 0 0 248 34 140 20
1988 96 8 43 0 105 9 0 0 265 16 147 8
1989 114 10 59 4 120 12 0 0 300 31 170 16
1990 94 20 49 3 102 20 0 0 244 45 140 25
1991 74 11 38 1 86 11 16 6 185 32 112 15
1992 78 6 40 0 82 6 20 10 212 19 111 8
1993 82 10 34 3 88 11 23 4 258 22 145 13
1994 95 5 33 2 108 5 26 2 273 13 157 7
1995 103 5 28 2 109 5 20 2 252 11 157 7
1996 102 9 27 4 112 9 28 3 288 18 152 11
1997 88 9 19 1 103 9 26 9 223 21 133 12
1998 88 11 26 3 99 11 35 6 265 32 132 20
1999 104 8 45 3 114 8 29 2 319 27 169 20
2000 99 15 42 4 102 15 26 8 248 35 142 22
2001 108 14 54 7 119 16 29 5 300 32 167 18
2002 103 15 34 5 117 15 23 6 279 45 159 20
2003 113 15 33 5 118 16 20 4 298 39 180 23
2004 117 17 44 5 123 17 34 7 295 44 175 26
2005 135 8 55 5 150 9 40 2 377 17 233 15
2006 130 11 43 2 136 14 30 4 361 38 217 18
2007 147 7 66 4 158 7 41 1 365 18 232 13
2008 115 7 48 4 119 7 20 1 289 20 176 13
2009 101 3 34 2 110 3 33 1 272 7 145 6
2010 102 9 39 4 107 11 27 1 206 17 151 14
2011 82 11 28 5 85 12 26 6 166 23 129 16
2012 111 7 42 1 115 7 40 5 224 11 164 9
2013 123 9 44 1 131 9 41 5 236 16 176 15
2014 105 8 40 0 111 8 36 4 252 14 161 10
2015 118 11 36 4 127 12 42 8 236 16 181 17
2016 143 9 43 3 152 9 47 3 306 22 224 16
2017 145 8 37 3 148 8 47 5 325 10 233 11
2018 128 13 38 5 140 14 47 3 288 23 201 19
2019 151 8 38 2 155 8 54 5 308 14 232 12
2020 172 6 45 1 185 6 58 4 334 10 264 10
2021 176 8 0 0 189 8 51 1 361 16 281 13
Local government: full-time employees
Job JacksonvilleWorcester
Airports 289 0
Correction 870 0
Financial administration 693 95
Firefighters 1,283 411
Fire - other 92 10
Health 122 75
Judicial and legal 102 12
Local libraries 319 91
Other and unallocable 814 24
Other government administration 577 60
Parks and recreation 220 44
Police - other 572 106
Police protection - officers 1,681 438
Sewerage 350 56
Solid waste management 179 84
Streets and highways 18 53
Totals for government 9,314 1,748
Water supply 146 105
Water transport and terminals 146 0
Welfare 142 46
Local government: part-time employees
Job JacksonvilleWorcester
Airports 1 0
Financial administration 3 0
Gas supply 1 0
Other and unallocable 0 24
Other government administration 0 33
Parks and recreation 0 21
Police - other 0 91
Totals for government 9 190
Water transport and terminals 4 0
Place of birth - Foreign born
Residents JacksonvilleWorcester
All residents 12.3% 22.4%
American Indian / Alaska Native residents 3.4% 44.9%
Asian residents 73.5% 64.3%
Black or African American residents 5.7% 40.3%
Native Hawaiian / Pacific Islander residents 24.9% 16.9%
Other race residents 35.6% 31.0%
Two or more races residents 16.7% 17.7%
White residents 6.9% 9.9%
White alone, not Hispanic / Latino residents 5.9% 11.1%
Place of birth - Native, outside of US
Residents JacksonvilleWorcester
All residents 2.6% 9.1%
American Indian / Alaska Native residents 7.0% 12.4%
Asian residents 1.0% 4.3%
Black or African American residents 1.3% 8.7%
Native Hawaiian / Pacific Islander residents 10.5% 14.5%
Other race residents 15.2% 24.0%
Two or more races residents 7.6% 18.5%
White residents 1.4% 2.1%
White alone, not Hispanic / Latino residents 1.3% 1.2%
Place of birth - Born in state of residence
Residents JacksonvilleWorcester
All residents 46.9% 51.8%
American Indian / Alaska Native residents 47.8% 27.3%
Asian residents 14.5% 18.1%
Black or African American residents 62.0% 39.8%
Native Hawaiian / Pacific Islander residents 13.0% 40.9%
Other race residents 27.6% 35.4%
Two or more races residents 45.1% 50.7%
White residents 43.9% 66.6%
White alone, not Hispanic / Latino residents 45.7% 68.5%
Place of birth - Born in other state
Residents JacksonvilleWorcester
All residents 38.2% 16.7%
American Indian / Alaska Native residents 41.8% 15.3%
Asian residents 10.9% 13.3%
Black or African American residents 30.9% 11.2%
Native Hawaiian / Pacific Islander residents 51.5% 27.8%
Other race residents 21.6% 9.6%
Two or more races residents 30.6% 13.1%
White residents 47.8% 21.4%
White alone, not Hispanic / Latino residents 47.0% 19.3%
English speakers (speaking English at home)
Type Jacksonville Worcester
Born in the United States residents 94.4% 82.7%
Foreign born residents 22.4% 17.2%
Native, born elsewhere residents 47.2% 15.9%
Total residents 84.3% 63%
Mechanisms of homicide
Mechanism JacksonvilleWorcester
Homicides from 2000 to 2006 721 96
Cut / Pierce 76 23
Firearm 492 44
Struck by / against 22 0
Suffocation 31 0
Mechanisms of homicide per 1,000,000 residents
Mechanism JacksonvilleWorcester
Homicides from 2000 to 2006 126.9 17.7
Cut / Pierce 13.4 4.2
Firearm 86.6 8.1
Struck by / against 3.9 0
Suffocation 5.5 0
Mechanisms of suicide per 1,000,000 residents
Mechanism JacksonvilleWorcester
Suicides from 2000 to 2006 140.7 71.5
Firearm 79.2 17.3
Poisoning 27.5 19.7
Suffocation 22.7 26.7

Infrastructure

Jacksonville boasts a more sprawling cityscape, requiring vehicular transportation. It has a robust network of highways, bridges, airports, and seaports, supporting its economic activities. Worcester, on the other hand, has an older, denser infrastructure, reflecting its New England heritage and need for public transportation.

Infrastructure
Type Jacksonville Worcester
Hospitals 25 14
TV stations 17 24
Arenas or stadiums 2 2
Bank branches located here 191 47
Bank institutions located here 31 12
Main business address for public companies 23 2
Drinking water stations with no reported violations in the past 20 0
Drinking water stations with reported violations in the past 20 6

Schools

School facilities
Type Jacksonville Worcester
Private elementary/middle schools 38 9
Private high schools 56 9
Public elementary/middle schools 145 38
Public high schools 55 9
Colleges/Universities 30 11
HMDA - Conventional home purchase loans - Applications denied
Year JacksonvilleWorcester
1999 5,422 262
2000 4,132 328
2001 3,038 237
2002 2,017 312
2003 3,563 469
2004 4,781 822
2005 7,134 1,210
2006 8,812 1,134
2007 5,298 721
2008 1,719 375
2009 676 274

Culture and Food

The two cities offer culturally diverse experiences. Jacksonville, with its southern charm, offers a blend of American and international cuisines, arts, music, and festival scenes. Worcester, with a rich history, offers New England charm, world-class museums, vibrant arts scene, and renowned seafood cuisine.

Sports Teams

Jacksonville is home to the NFL's Jacksonville Jaguars, scoring points with football fans. Worcester does not have a major league sports team of its own, but Boston's teams draw significant support from Worcester's residents.