Jacksonville, Florida and Yonkers, New York both offer distinct living experiences due to vast differences in geographical, cultural, and economic climates. From the warm sunny beaches of Jacksonville to the bustling city vibe of Yonkers, each city has its unique charm. This article will delve into the details of both cities, highlighting key factors such as crime and safety, weather, cost of living, education, and more, helping you make an informed decision about relocation or travel.
Distance between
Jacksonville, FL and
Yonkers, NY : 853.7 miles
Jacksonville's population is larger by 356%. Its population has grown by 218,997 people (29.8%) since 2000. The population of Yonkers has grown by 13,444 people (6.9%) during that time.
While both cities do experience crime, they sit at different ends of the spectrum. Jacksonville's crime rate is notably higher than the national average, which is a point of consideration for potential residents or tourists. Yonkers, on the other hand, boasts a lower crime rate compared to other US cities its size. It has invested heavily in maintaining public safety and has seen a significant reduction in crime over the years.
Cost of Living
Comparatively, the cost of living is less in Jacksonville than in Yonkers. Housing, grocery, and health costs are lower in Jacksonville, which may be attractive for potential residents looking to stretch their dollar. Conversely, Yonkers' proximity to New York City raises the cost of living, particularly with regard to housing.
Income Tax
Florida, thus Jacksonville, has no state income tax which can be beneficial to residents. However, New York imposes a state income tax, the rate of which varies based on income.
Property Tax
Property tax rates in Jacksonville are moderately low, while Yonkers has one of the highest property tax rates in the U.S, which can make owning property more expensive.
Sales Tax
Florida has a 6% state sales tax with an additional 1% levy in Jacksonville. New York has a 4% state sales tax, and Yonkers has an additional 4.375% totaling to an 8.375% sales tax.
Income
Type
Jacksonville
Yonkers
Estimated median household income
$58,621
$66,395
Estimated per capita income
$32,953
$37,977
Cost of living index (U.S. average is 100)
88.3
152.2
If you make $50,000 in Jacksonville, you will have to make $86,183 in Yonkers to maintain the same standard of living.
Geographical Conditions
Geographically, Jacksonville is known for its wide sandy beaches and the St. Johns River. Yonkers, on the Hudson River, offers spectacular views of the Palisades Interstate Park across the river.
Both Jacksonville and Yonkers offer good educational facilities. With a total of 12 universities and colleges, Jacksonville provides excellent opportunities for higher education. Yonkers is part of the New York school system, and it is home to a number of top-rated schools and also boasts proximity to various prestigious universities located in New York City.
Jacksonville has a robust and diverse economy with thriving industries in healthcare, finance, and logistics. It's also experiencing growth in the tech sector. In contrast, Yonkers, due in part to its location, relies heavily on service industries. It has many opportunities in the fields of education, health care, and professional services.
Biggest Employers
The Naval Air Station and the city government are two of the largest employers in Jacksonville. In Yonkers, the biggest employers are Montefiore Hospital, Empire City Casino, and the Yonkers Board of Education.
There were 1,310 building permits issued in Jacksonville in 2012 (353 more than in 2011) compared to 12 building permits issued in Yonkers in 2012 (5 more than in 2011).
In Jacksonville (Duval County), 47.9% voted for Democrats and 51.5% for Republicans in 2012 Presidential Election. In Yonkers (Westchester County), 62.1% voted for Democrats and 36.9% for Republicans.
Elections
Type
Democrats
Republicans
Other
Year
Jacksonville
Yonkers
Jacksonville
Yonkers
Jacksonville
Yonkers
2020
51.3%
67.8%
47.5%
31.4%
1.2%
0.8%
2016
47.2%
65.0%
48.6%
31.2%
4.2%
3.8%
2012
47.9%
62.1%
51.5%
36.9%
0.6%
0.9%
2008
49.0%
63.7%
51.0%
36.0%
0.0%
0.3%
2004
41.7%
58.2%
57.9%
40.4%
0.3%
1.4%
2000
40.9%
58.9%
57.7%
37.6%
1.4%
3.5%
1996
44.2%
56.9%
50.0%
35.9%
5.8%
7.2%
Breakdown of population affiliated with a religious congregation
Type
Adherents
Congregations
Religion
Jacksonville
Yonkers
Jacksonville
Yonkers
SOUTHERN BAPTIST CONVENTION
15.8%
0.1%
22.3%
2.0%
CATHOLIC CHURCH
9.0%
45.9%
2.8%
15.3%
EPISCOPAL CHURCH
1.2%
1.5%
2.3%
7.5%
MUSLIM ESTIMATE
0.7%
1.4%
0.6%
1.5%
EVANGELICAL LUTHERAN CHURCH IN AMERICA
0.3%
0.5%
0.9%
2.5%
SEVENTH DAY ADVENTIST CHURCH
0.3%
0.4%
1.4%
3.5%
AMERICAN BAPTIST CHURCHES IN THE USA
0.1%
0.6%
0.2%
3.4%
Weather
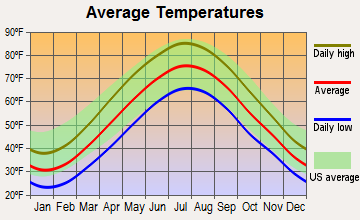
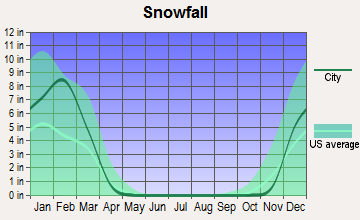
Jacksonville experiences a humid subtropical climate with mild winters and hot summers. This ideal weather means outdoor activities are possible throughout the year, making it a haven for sun-seekers. Yonkers has a temperate seasonal climate. Winters can be cold and heavy with snowfall, while summers bring mild to high temperatures.
Weather and climate
Type
Jacksonville
Yonkers
Temperature - Average
68.3°F
53.5°F
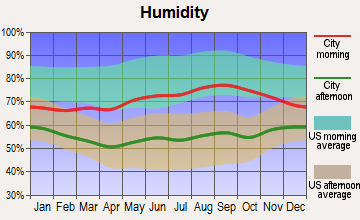
Humidity - Average morning or afternoon humidity
78.4%
67.4%
Humidity - Differences between morning and afternoon humidity
44%
26.9%
Humidity - Maximum monthly morning or afternoon humidity
92%
75.9%
Humidity - Minimum monthly morning or afternoon humidity
48%
49%
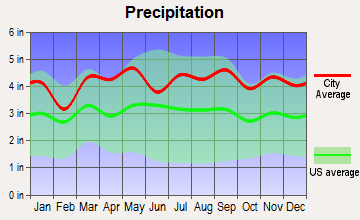
Precipitation - Yearly average
51.8 in
50.1 in
Snowfall - Yearly average
0 in
54.9 in
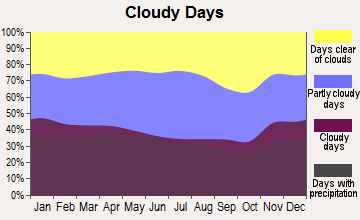
Clouds - Number of days clear of clouds
15.8%
16.7%
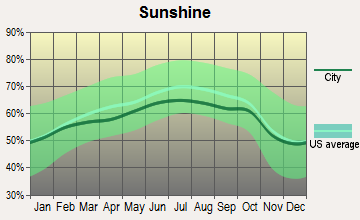
Sunshine amount - Average
69.6%
60.2%
Sunshine amount - Differences during a year
16%
20%
Sunshine amount - Maximum monthly
74%
64%
Sunshine amount - Minimum monthly
58%
44%
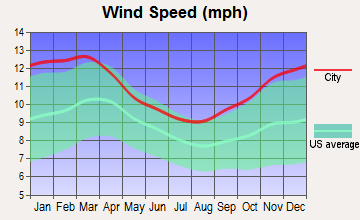
Wind speed - Average
7.2 mph
10 mph
Average climate in Jacksonville, Florida
Average climate in Yonkers, New York
Air pollution
Type
AQI
CO
NO2
OZONE
PB
PM10
PM25
SO2
Year
Jacksonville
Yonkers
Jacksonville
Yonkers
Yonkers
Jacksonville
Yonkers
Jacksonville
Yonkers
Yonkers
Jacksonville
Yonkers
Jacksonville
Yonkers
2018
78
102
N/A
0.30
16.1
N/A
24.5
24.6
N/A
N/A
N/A
N/A
7.1
7.5
N/A
0.6
2017
74
97
N/A
0.10
16.1
N/A
24.7
24.8
N/A
N/A
N/A
N/A
5.8
7.2
0.7
0.5
2016
65
97
0.50
0.28
16.8
N/A
24.9
24.7
N/A
N/A
N/A
N/A
5.2
7.5
0.4
0.7
2015
63
105
0.35
0.29
18.1
N/A
25.4
23.9
N/A
N/A
N/A
N/A
4.9
8.7
0.3
1.3
2014
66
96
0.27
0.33
18.3
N/A
24.3
23.7
N/A
N/A
N/A
N/A
5.9
8.2
0.7
1.6
2013
68
103
0.18
0.39
18.8
N/A
23.0
23.8
N/A
N/A
N/A
N/A
5.3
8.9
0.7
1.9
2012
66
102
0.10
0.43
18.6
N/A
24.0
24.2
N/A
N/A
N/A
N/A
5.8
8.9
0.6
2.8
2011
88
107
0.28
0.45
20.8
N/A
26.6
22.6
N/A
N/A
N/A
N/A
8.1
10.9
0.8
4.1
2010
77
113
0.31
0.48
19.3
N/A
26.4
24.0
N/A
N/A
N/A
N/A
7.1
10.3
0.8
3.7
2009
72
102
0.16
0.50
21.4
N/A
25.0
19.7
N/A
N/A
N/A
N/A
8.5
10.4
0.6
4.5
2008
75
114
0.15
0.51
22.5
N/A
27.6
20.4
N/A
0.013
N/A
N/A
10.0
11.7
0.9
5.0
2007
92
120
0.29
0.58
24.2
N/A
28.4
19.7
N/A
0.016
N/A
N/A
11.4
12.8
1.2
6.0
2006
87
115
0.35
0.53
23.9
N/A
29.0
19.7
N/A
0.018
N/A
N/A
10.8
12.8
1.4
6.1
2005
93
112
0.42
0.62
26.1
N/A
26.5
18.8
N/A
N/A
N/A
N/A
12.2
N/A
1.8
8.1
2004
92
99
0.40
0.63
25.0
N/A
25.2
17.6
N/A
0.030
N/A
N/A
12.4
N/A
1.4
7.9
2003
55
106
0.43
0.74
26.5
N/A
21.6
18.1
N/A
0.025
26.9
N/A
N/A
N/A
1.6
8.0
2002
59
122
0.49
0.68
26.7
N/A
22.2
18.9
0.003
N/A
25.4
N/A
N/A
N/A
1.7
7.6
2001
74
123
0.49
0.69
28.9
N/A
24.0
19.4
0.009
N/A
23.6
N/A
N/A
N/A
2.5
8.9
2000
85
111
0.52
0.71
29.2
N/A
25.1
17.1
0.017
N/A
22.2
N/A
N/A
N/A
3.0
8.4
Natural disasters
Type
Jacksonville
Yonkers
Tornado activity compared to U.S. average
75.2%
60.2%
Earthquake activity compared to U.S. average
18.1%
31.2%
Natural disasters compared to U.S. average
24%
26%
Transportation
Jacksonville's transportation system primarily relies on road networks with a bus network and a skyway monorail system. Yonkers is well connected with New York City through an excellent public transit system, which includes subway, rail, and bus services.
Transport
Type
Jacksonville
Yonkers
Amtrak stations
1
1
Amtrak stations nearby
1
3
FAA registered aircraft
566
17
FAA registered aircraft manufacturers and dealers
34
0
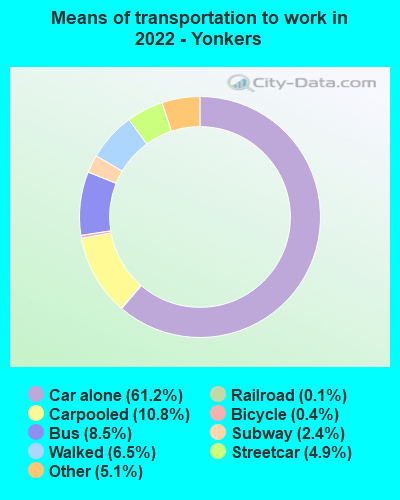
Means of transportation to work
Type
Jacksonville
Yonkers
Bicycle
0.2%
0.1%
Bus
1.1%
13.9%
Carpooled
9%
12.2%
Car alone
86.5%
60.3%
Motorcycle
0.2%
0%
Railroad
0%
6.2%
Streetcar
0%
2.5%
Subway
0%
2.5%
Taxicab
0.2%
0.9%
Walked
1.2%
4.4%
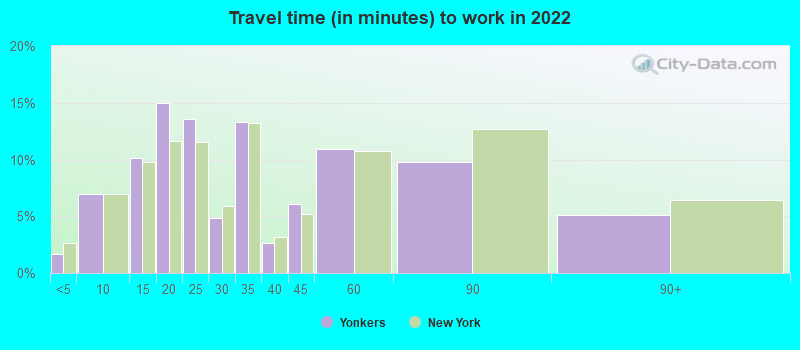
Average travel time to work
Type
Jacksonville
Yonkers
Average
27.5 min
33.9 min
Other means
25 min
27.4 min
Public transportation
43.7 min
52 min
Private vehicle occupancy
Type
Jacksonville
Yonkers
Average
1.1
1.2
Drove alone
89.4%
85.9%
In 2 person carpool
8%
10.4%
In 3 person carpool
1.7%
1.4%
In 4 person carpool
0.7%
1.1%
In 5-6 person carpool
0%
1.1%
In 7+ person carpool
0.2%
0.1%
How many people usually rode to work in the car, truck or van.
Real Estate
Jacksonville's real estate market offers lower property prices compared to Yonkers, making it an attractive choice for relocation or investment. In contrast, Yonkers' real estate market is more expensive due to its proximity to New York City.
Neighborhoods
Jacksonville has a mix of urban and suburban neighborhoods with growing downtown areas and ample outdoor space. Yonkers boasts ethnically diverse neighborhoods. Its communities are bustling with activities and have a rich blend of cultural influences.
Houses and residents
Type
Jacksonville
Yonkers
Houses
422,315
83,368
Average household size (people)
2.5
2.6
Median year apartment built
1985
1964
Median year house/condo built
1987
1955
Length of stay in the house since moving in
12.5 years
16.2 years
Houses occupied
386,283 (91.5%)
81,397 (97.6%)
Houses occupied by owners
226,429 (58.6%)
40,385 (49.6%)
Houses occupied by renters
159,854 (41.4%)
41,012 (50.4%)
Median rent asked for vacant for-rent units
$1,444
$746.05
Median monthly housing costs
$1,154
$1,515
Median price asked for vacant for-sale houses and condos
$260,045
$214,056
Estimated median house or condo value
$239,400
$424,100
Median numbers of rooms
5.6
4.5
Median number of rooms in apartments
4.3
3.8
Median number of rooms in houses and condos
6.3
5.5
Median house price - detached houses
$282,276
$633,111
Median house price - in 2-unit structures
$177,341
$422,890
Median house price - in 3-to-4-unit structures
$144,947
$362,555
Median house price - in 5 or more unit structures
$220,508
$246,208
Median house price - Townhouses or other attached units
$213,709
$360,577
Median house price - All housing units
$266,926
$455,533
Median house age
36
62
Renting percentage
38.3%
53.9%
Housing density (houses/condos per square mile)
557.4
4,611.9
House value disparities
33.2%
31%
Household income disparities
44.2%
48.5%
Median household income for houses/condes with a mortgage
$83,160
$129,663
Median household income for apartments without a mortgage
$59,777
$72,991
Housing units without a mortgage
2,439 (1.6%)
759 (3.3%)
Housing units with both a second mortgage and home equity loan
8,460 (5.5%)
2,672 (11.7%)
Housing units with a mortgage
150,468 (98.4%)
21,988 (96.7%)
Housing units with a home equity loan
255 (0.2%)
118 (0.5%)
Housing units with a second mortgage
11,378 (7.4%)
3,163 (13.9%)
House/condo owner moved in on average (years ago)
10
17
House/condo renter moved in on average (years ago)
1
5
Housing units lacking complete kitchen facilities
1.5%
0.9%
Housing units lacking complete plumbing facilities
1.4%
1.3%
Housing units in structures
Housing units in structures
Jacksonville
Yonkers
One, detached
59.4%
24.7%
One, attached
6.1%
6.3%
Two
2.1%
10.0%
3 or 4
5.3%
10.0%
5 to 9
5.0%
5.1%
10 to 19
7.9%
6.1%
20 to 49
4.9%
10.3%
50 or more
5.3%
27.3%
Mobile homes
3.8%
0.1%
Boats, RVs, vans, etc.
0.2%
0.0%
Median real estate property taxes paid for housing units
Self-employed workers in own not incorporated business
19,601
5,405
State government workers
13,692
4,428
Unpaid family workers
1,066
337
Industries and Occupations
In Jacksonville, the primary industries are defense and security, IT, healthcare, and logistics. Conversely, Yonkers' economy is service-oriented, with education, healthcare, and professional services being dominant sectors.
Both cities offer excellent healthcare services. Jacksonville is home to Mayo Clinic and UF Health Jacksonville, while Yonkers residents have access to world-class healthcare facilities through the broader New York metropolitan area.
Health (county statistics)
Type
Jacksonville
Yonkers
General health status score of residents in this county from 1 (poor) to 5 (excellent)
Jacksonville benefits from excellent infrastructure, including a large deep-water port, a vast highway network, and three major railroads. Yonkers too offers excellent infrastructure with a well-connected transportation network including buses, trains, and access to three major airports.
Infrastructure
Type
Jacksonville
Yonkers
Hospitals
25
7
TV stations
17
30
Bank branches located here
191
52
Bank institutions located here
31
16
Main business address for public companies
23
4
Drinking water stations with no reported violations in the past
20
0
Drinking water stations with reported violations in the past
HMDA - Conventional home purchase loans - Applications denied
Year
Jacksonville
Yonkers
1999
5,422
379
2000
4,132
529
2001
3,038
366
2002
2,017
362
2003
3,563
470
2004
4,781
649
2005
7,134
799
2006
8,812
999
2007
5,298
748
2008
1,719
472
2009
676
271
Culture and Food
Jacksonville offers an amalgamation of Southern and coastal culture, with numerous art galleries, music festivals, and a food scene that knits together Southern cuisine with fresh seafood. Yonkers has a rich multicultural influence in its food and arts scene, well known for its Italian and Irish communities.
Sports Teams
Jacksonville is home to the Jacksonville Jaguars (NFL), while Yonkers is a short commute away from New York City's vibrant sports scene featuring numerous major league teams including the Yankees (MLB) and the Knicks (NBA).


 Jacksonville, FL
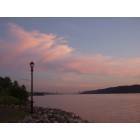
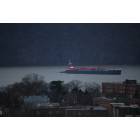
 Yonkers, NY