Relative area comparison
 Las Vegas, NV
 Coachella Valley, CA
Las Vegas, NV and the Coachella Valley in CA are popular destinations due to their unique features and vivid cultural scenes. When looking to move or visit, consider factors such as crime and safety, weather, cost of living, and others. This comparison aims to provide a comprehensive overview of these two locations across a variety of factors, helping you make a well-informed decision.

 | 2020s Midpoint: Top 50 US Cities... (376 replies) |
| Better Vacation: Las Vegas or Phoenix? (29 replies) |
| Best City in the Desert Southwest (NV, AZ, NM, and TX) (28 replies) |
| The Best major Desert City in the USA? (132 replies) |
| Best City of the Desert Southwest (130 replies) |
| Most Mormon cities in the USA (120 replies) |
Las Vegas, NV and
Coachella Valley, CA : 183.6 miles
Las Vegas's population is larger by 312%. Its population has grown by 168,356 people (35.2%) since 2000.
| Population | ||
| Type | Las Vegas | Coachella Valley |
|---|---|---|
| Population | 646,790 | 156,830 |
| Female / male percentage | 49.6% / 50.4%
|
49% / 51%
|
Las Vegas, recognized for its vibrant nightlife and high tourist footfall, has a crime rate higher than the national average. However, crime is generally concentrated in specific areas, allowing safer neighborhoods elsewhere. In contrast, the Coachella Valley's crime rate is lower than the national average, with crime mostly confined to limited sections. Both locations, however, emphasize personal awareness and property security.
The cost of living in Las Vegas is lower compared to the national average, attributed mostly to affordable housing. On the other hand, the Coachella Valley's average cost of living is slightly higher than national figures due to slightly higher housing costs and overall living expenses.
Nevada has no state income tax, providing a tangible financial benefit for many. In contrast, California maintains a progressive income tax, which can reach up to 13.3% for the highest earners.
Las Vegas has a lower property tax rate than Coachella Valley. Nevada's average property tax rate is around 0.69%, while in California, the average rate is about 0.72%.
Nevada has a higher total sales tax rate, close to 8.25% (with county variations), compared to California's state sales tax of 7.25%. This attractive rate in California doesn't include additional local city or county taxes which vary across the state.
| Income | ||
| Type | Las Vegas | Coachella Valley |
|---|---|---|
| Estimated median household income | $59,746 | $65,706 |
| Estimated per capita income | $33,825 | $25,114 |
| Cost of living index (U.S. average is 100) | 99.1 | 85.3 |
If you make $50,000 in Coachella Valley, you will have to make $58,089 in Las Vegas to maintain the same standard of living.
Both Las Vegas and Coachella Valley are situated in desert regions, promising plenty of sunshine. Las Vegas is located in a basin, while Coachella Valley offers a picturesque desert landscape punctuated by mountains and a series of interconnected cities.
| Geographical information | ||
| Type | Las Vegas | Coachella Valley |
|---|---|---|
| Land area | 113.3 sq. miles | 303 sq. miles |
| Population density | 5,708.4 people per sq. mile | 517.6 people per sq. mile |
Las Vegas, NV
Coachella Valley, CA
Las Vegas offers a wide range of educational opportunities, including public, private, and charter schools, alongside access to higher education institutions like the University of Nevada. In Coachella Valley, the education infrastructure includes several high-ranking public and private schools, as well as community colleges and satellite campuses for universities like California State San Bernardino.
| Education level (25-year-olds and older) | ||
| Type | Las Vegas | Coachella Valley |
|---|---|---|
| Bachelor's degree or higher | 27.6% | 11.6% |
| Graduate or professional degree | 10.1% | 4.2% |
| High school or higher | 85.4% | 54.3% |
Las Vegas has a robust economy heavily reliant on tourism, entertainment, and hospitality. On the other hand, the Coachella Valley economy is also tourism-oriented, with an emphasis on hospitality, healthcare, and retail sectors. Agriculture also contributes significantly to Coachella's economy.
Las Vegas's largest employers include MGM Resorts International, Caesars Entertainment, and Wynn Resorts. For Coachella Valley, the most prominent employers are Eisenhower Medical Center, Agua Caliente Casino Resorts, and the Desert Sands Unified School District.
In Las Vegas (Clark County), 56.4% voted for Democrats and 41.8% for Republicans in 2012 Presidential Election. In Coachella Valley (Riverside County), 49.6% voted for Democrats and 48.0% for Republicans.
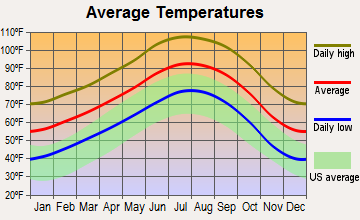
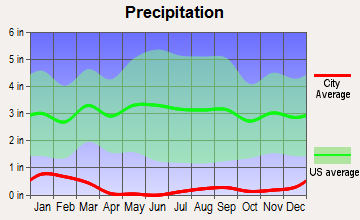
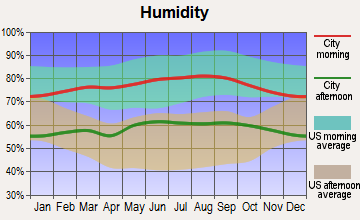
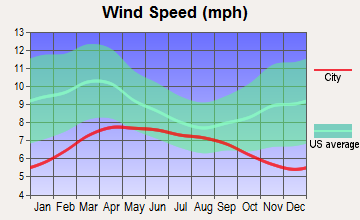
Las Vegas experiences a dry desert climate with hot summers and mild winters, whereas the Coachella Valley, also a desert area, witnesses extremely hot summers and comparatively cooler winters. Both regions have a high degree of sunshine throughout the year but expect high temperatures, particularly in summertime.
| Weather and climate | ||
| Type | Las Vegas | Coachella Valley |
|---|---|---|
| Temperature - Average | 65.5°F | 74.1°F |
| Humidity - Average morning or afternoon humidity | 30.7% | 70.5% |
| Humidity - Differences between morning and afternoon humidity | 42% | 21.7% |
| Humidity - Maximum monthly morning or afternoon humidity | 52% | 76.9% |
| Humidity - Minimum monthly morning or afternoon humidity | 10% | 55.2% |
| Precipitation - Yearly average | 5.7 in | 3.4 in |
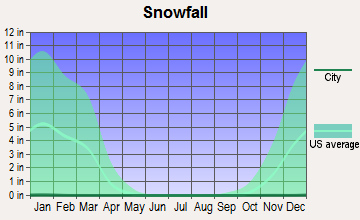
| Snowfall - Yearly average | 1.6 in | 0 in |
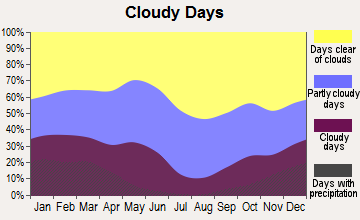
| Clouds - Number of days clear of clouds | 35.1% | 28.3% |
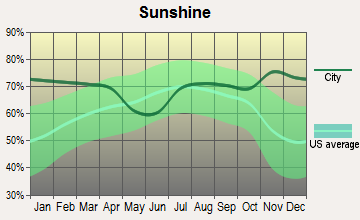
| Sunshine amount - Average | 91.8% | 76.2% |
| Sunshine amount - Differences during a year | 16% | 17.1% |
| Sunshine amount - Maximum monthly | 92% | 75.9% |
| Sunshine amount - Minimum monthly | 76% | 58.8% |
| Wind speed - Average | 9.2 mph | 5.8 mph |
| Natural disasters | ||
| Type | Las Vegas | Coachella Valley |
|---|---|---|
| Tornado activity compared to U.S. average | 2.1% | 6.2% |
| Earthquake activity compared to U.S. average | 6,093.4% | 6,708% |
| Natural disasters compared to U.S. average | 12% | 46% |
Las Vegas has a well-serviced public transit system operated by RTC, alongside rideshare options and bike lanes. The Coachella Valley offers SunLine Transit Agency bus services, but car ownership is more common due to the expansive terrain.
| Transport | ||
| Type | Las Vegas | Coachella Valley |
|---|---|---|
| Amtrak stations | 1 | 0 |
| Amtrak stations nearby | 1 | 2 |
| FAA registered aircraft | 1 | 0 |
| FAA registered aircraft manufacturers and dealers | 81 | 0 |
| Means of transportation to work | ||
| Type | Las Vegas | Coachella Valley |
|---|---|---|
| Bicycle | 0.1% | 0.3% |
| Bus | 2.2% | 1.1% |
| Carpooled | 10.3% | 27.1% |
| Car alone | 82.7% | 64.5% |
| Motorcycle | 0.4% | 0.2% |
| Walked | 1.4% | 2.1% |
| Average travel time to work | ||
| Type | Las Vegas | Coachella Valley |
|---|---|---|
| Average | 26.3 min | 23.1 min |
Real estate in Las Vegas is more affordable compared to other U.S. metro areas, with a diverse range of options from downtown condos to suburban family homes. Coachella Valley also offers a mix of single-family homes, condos, and upscale properties, with slightly higher median prices due to the picturesque desert surroundings.
Las Vegas neighborhoods offer a mix of high-end living and affordable areas, such as Summerlin South and the Arts District. Coachella Valley boasts upscale areas like Palm Springs and Rancho Mirage, and affordable neighborhoods in cities like Indio and Coachella.
| Houses and residents | ||
| Type | Las Vegas | Coachella Valley |
|---|---|---|
| Houses | 269,602 | 38,953 |
| Average household size (people) | 2.7 | 3.3 |
| Houses occupied | 250,350 (92.9%) | 32,877 (84.4%) |
| Houses occupied by owners | 138,677 (55.4%) | 20,205 (61.5%) |
| Houses occupied by renters | 111,673 (44.6%) | 12,672 (38.5%) |
| Median rent asked for vacant for-rent units | $1,176 | $1,146 |
| Median price asked for vacant for-sale houses and condos | $989,410 | $464,486 |
| Estimated median house or condo value | $362,400 | $360,944 |
| Median number of rooms in apartments | 4.1 | 4.3 |
| Median number of rooms in houses and condos | 6.1 | 6.2 |
| Renting percentage | 43.5% | 34.3% |
| Housing density (houses/condos per square mile) | 2,379.4 | 128.6 |
| Household income disparities | 47.1% | 46.5% |
| Housing units without a mortgage | 1,172 (1.2%) | 4,149 (25.7%) |
| Housing units with both a second mortgage and home equity loan | 4,450 (4.6%) | 45 (0.3%) |
| Housing units with a mortgage | 95,992 (98.8%) | 11,971 (74.3%) |
| Housing units with a home equity loan | 178 (0.2%) | 619 (3.8%) |
| Housing units with a second mortgage | 5,092 (5.2%) | 1,073 (6.7%) |
| Housing units lacking complete kitchen facilities | 1.3% | 1.1% |
| Housing units lacking complete plumbing facilities | 1% | 1.2% |
In Las Vegas, much of the employment comes from entertainment and hospitality businesses - casinos, hotels, and restaurants. On the contrary, in Coachella Valley, the primary occupations are in sectors like retail, healthcare, education, and agriculture.
Las Vegas has well-established healthcare facilities, including the highly-rated Sunrise Hospital and Medical Center. Coachella Valley is renowned for quality healthcare facilities like the Eisenhower Medical Center and other specialized healthcare services.
| Health (county statistics) | ||
| Type | Las Vegas | Coachella Valley |
|---|---|---|
| General health status score of residents in this county from 1 (poor) to 5 (excellent) | 3.4 | 3.4 |
| Average weight of females (lbs) | 160.2 lbs | 161.6 lbs |
| Average weight of males (lbs) | 194.9 lbs | 193.1 lbs |
| Residents visited a dentist within the past year | 64% | 63.8% |
| Residents exercised in the past month | 72.3% | 70.4% |
| Adult residents drank alcohol in the past 30 days | 71.5% | 50% |
| Residents smoked 100+ cigarettes in their lives | 50.6% | 38.7% |
Las Vegas boasts world-class infrastructure suited to support its high-trafficked tourist industry. Coachella Valley, though less urbanized, holds its own with well-maintained roads, public facilities, and significant investments in sustainable technologies and green spaces.
| Infrastructure | ||
| Type | Las Vegas | Coachella Valley |
|---|---|---|
| TV stations | 12 | 4 |
Las Vegas is renowned globally for its cultural diversity, 24/7 lifestyle, and a remarkable food scene, from buffet spreads at the casinos to world-class fine dining. Coachella Valley also flaunts a vibrant food and cultural scene, with numerous festivals like the Coachella Valley Music and Arts Festival garnering international fame.
Las Vegas is home to professional sports teams like the Vegas Golden Knights (NHL) and the Raiders (NFL). Although Coachella Valley doesn't host any professional teams, it's known for hosting world-class sporting events like the Indian Wells Tennis Tournament and PGA Tour golf tournaments.