Las Vegas, Nevada, known for its entertainment and casinos, contrasts sharply with the peaceful city of Moreno Valley, California. These two offer different vibes and unique characteristics that can suit different lifestyles. This comparison encompassing several factors such as crime/safety, weather, cost of living, and others aims to provide a comprehensive panorama for those considering relocating or visiting these cities.
Distance between
Las Vegas, NV and
Moreno Valley, CA : 193.4 miles
Las Vegas's population is larger by 206%. Its population has grown by 168,356 people (35.2%) since 2000. The population of Moreno Valley has grown by 69,219 people (48.6%) during that time.
Las Vegas has a slightly higher crime rate than the national average, which might be associated with its nightlife and bustling tourism industry. On the other hand, Moreno Valley's crime rate is lower than the national average, making it a relatively safer city. It's important to note that areas with lower tourist footfall report fewer incidents in both locations.
City-data.com crime index counts serious crimes and violent crime more heavily. It adjusts for the number of visitors and daily workers commuting into cities. (higher means more crime, U.S. average = 301.1)
City-data.com crime index counts serious crimes and violent crime more heavily. It adjusts for the number of visitors and daily workers commuting into cities. (higher means more crime, U.S. average = 301.1)
Sex Offenders
According to our data, there are 4,787 registered sex offenders living in Las Vegas and 306 registered sex offenders living in . The ratio of residents to sex offenders in Las Vegas is 132 to 1; the ratio in Moreno Valley is 672 to 1. The number of registered sex offenders compared to the number of residents is much larger in Las Vegas than that in Moreno Valley.
Cost of Living
The cost of living in Las Vegas is generally lower than in Moreno Valley. This difference is primarily due to lower housing costs. Additionally, Nevada has no state income tax, which can also contribute to a lower overall cost of living. However, California offers more extensive social services, potentially offsetting the higher costs for some residents.
Income Tax
An advantage of living in Las Vegas is Nevada's lack of state income tax. California's state income tax, in contrast, is one of the highest in the country, impacting the take-home pay of Moreno Valley residents.
Property Tax
Property taxes are significantly lower in Las Vegas compared to Moreno Valley. This is another factor that contributes to the lower overall cost of living in Las Vegas.
Sales Tax
Nevada's statewide sales tax is lower than that of California, but Las Vegas adds a county tax, making the total sales tax slightly higher. Moreno Valley, being in California, has a high sales tax, which is worth considering for potential residents.
Income
Type
Las Vegas
Moreno Valley
Estimated median household income
$59,746
$79,840
Estimated per capita income
$33,825
$25,319
Cost of living index (U.S. average is 100)
99.1
82.3
If you make $50,000 in Moreno Valley, you will have to make $60,207 in Las Vegas to maintain the same standard of living.
Geographical Conditions
Geographically, Las Vegas is in the middle of a desert, surrounded by mountains. Moreno Valley also features a mountain backdrop but is characterized more by its rolling hills and proximity to both beaches and ski resorts.
Both cities offer decent education opportunities. Still, Moreno Valley has a slight edge with a better high school graduation rate. In contrast, Las Vegas offers more options for higher education with universities such as UNLV and Nevada State College.
Las Vegas' economy heavily revolves around the hospitality, entertainment, and gaming sectors. Moreno Valley, however, has a more diverse economy that includes logistics, health care, and retail sectors. Job growth and unemployment rates are comparable, often influenced by nationwide trends.
Biggest Employers
The biggest employers in Las Vegas are mainly casinos and hotels like MGM Resorts and Ceasar's Entertainment. Moreno Valley is home to big distribution centers for major companies like Amazon, making them some of the largest employers in the city.
There were 2,700 building permits issued in Las Vegas in 2012 (1886 more than in 2011) compared to 377 building permits issued in Moreno Valley in 2012 (354 more than in 2011).
In Las Vegas (Clark County), 56.4% voted for Democrats and 41.8% for Republicans in 2012 Presidential Election. In Moreno Valley (Riverside County), 49.6% voted for Democrats and 48.0% for Republicans.
Elections
Type
Democrats
Republicans
Other
Year
Las Vegas
Moreno Valley
Las Vegas
Moreno Valley
Las Vegas
Moreno Valley
2020
53.7%
53.0%
44.3%
45.0%
2.0%
2.0%
2016
52.4%
49.7%
41.7%
44.4%
5.8%
5.9%
2012
56.4%
49.6%
41.8%
48.0%
1.8%
2.4%
2008
58.5%
50.4%
39.5%
48.1%
2.0%
1.5%
2004
51.8%
41.3%
46.9%
58.2%
1.3%
0.6%
2000
51.4%
45.0%
44.8%
51.6%
3.8%
3.4%
1996
75.5%
43.0%
18.8%
45.6%
5.7%
11.3%
Breakdown of population affiliated with a religious congregation
Type
Adherents
Congregations
Religion
Las Vegas
Moreno Valley
Las Vegas
Moreno Valley
CATHOLIC CHURCH
18.1%
27.5%
4.0%
4.5%
SOUTHERN BAPTIST CONVENTION
1.6%
1.2%
11.2%
11.2%
EVANGELICAL LUTHERAN CHURCH IN AMERICA
0.4%
0.3%
1.6%
1.5%
SEVENTH DAY ADVENTIST CHURCH
0.2%
0.9%
1.6%
3.4%
MUSLIM ESTIMATE
0.1%
0.5%
0.6%
0.7%
Weather
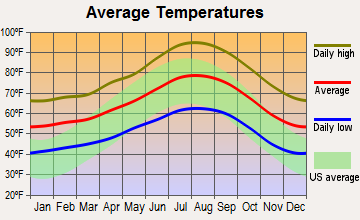
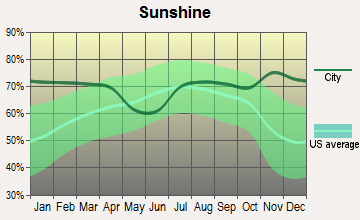
The weather varies significantly between these two cities. Las Vegas experiences a desert climate with scorching summers and mild winters. Meanwhile, Moreno Valley enjoys Mediterranean-like weather with warm summers and cooler winters. The more varied climate in Moreno Valley may appeal to those preferring a combination of warm and cold seasons.
Weather and climate
Type
Las Vegas
Moreno Valley
Temperature - Average
65.5°F
65.1°F
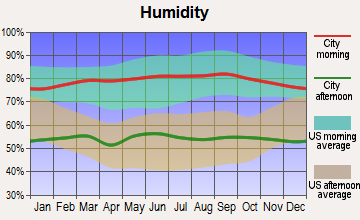
Humidity - Average morning or afternoon humidity
30.7%
66.7%
Humidity - Differences between morning and afternoon humidity
42%
21.1%
Humidity - Maximum monthly morning or afternoon humidity
52%
73.3%
Humidity - Minimum monthly morning or afternoon humidity
10%
52.3%
Precipitation - Yearly average
5.7 in
11.6 in
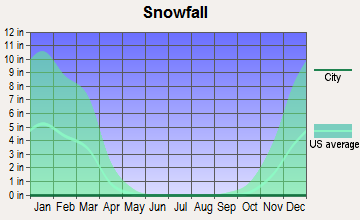
Snowfall - Yearly average
1.6 in
0 in
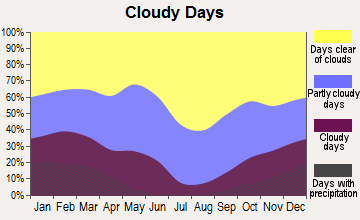
Clouds - Number of days clear of clouds
35.1%
27.3%
Sunshine amount - Average
91.8%
78%
Sunshine amount - Differences during a year
16%
20.8%
Sunshine amount - Maximum monthly
92%
83%
Sunshine amount - Minimum monthly
76%
62.2%
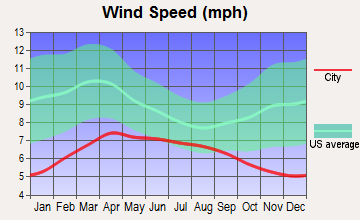
Wind speed - Average
9.2 mph
4.5 mph
Average climate in Las Vegas, Nevada
Average climate in Moreno Valley, California
Air pollution
Type
AQI
CO
NO2
OZONE
PB
PM10
PM25
SO2
Year
Las Vegas
Moreno Valley
Las Vegas
Moreno Valley
Las Vegas
Moreno Valley
Las Vegas
Moreno Valley
Moreno Valley
Las Vegas
Moreno Valley
Las Vegas
Moreno Valley
Las Vegas
Moreno Valley
2018
100
154
0.42
0.33
13.1
12.3
37.2
33.4
0.006
N/A
24.4
35.0
6.0
11.6
0.7
0.4
2017
101
145
0.29
0.34
13.0
12.2
38.5
35.1
0.004
N/A
20.3
37.6
7.3
13.2
0.8
0.3
2016
97
143
0.38
0.34
11.2
12.4
36.5
33.4
0.006
N/A
20.6
36.8
8.7
12.9
0.8
0.3
2015
92
145
0.36
0.32
12.4
12.2
35.6
33.2
0.004
N/A
18.9
34.7
8.4
13.7
1.2
0.3
2014
91
146
0.40
0.35
10.8
14.4
36.5
33.1
0.006
N/A
21.1
37.2
9.2
15.6
1.4
0.3
2013
103
150
0.45
0.35
9.6
14.7
36.9
32.7
0.006
N/A
22.1
35.7
8.6
14.4
1.5
0.3
2012
94
145
0.49
0.33
5.9
15.2
38.5
32.6
0.007
N/A
21.5
34.4
8.3
15.2
1.4
0.3
2011
85
149
0.40
0.34
5.3
15.3
37.5
33.0
0.006
N/A
18.2
34.4
7.8
16.6
1.2
0.4
2010
86
146
0.50
0.37
5.7
16.4
36.6
32.5
0.008
N/A
16.1
31.5
7.1
15.8
N/A
1.2
2009
87
151
0.56
0.34
6.0
17.8
33.3
32.1
0.010
N/A
20.9
35.0
8.3
17.0
N/A
1.4
2008
82
156
0.66
0.38
8.2
18.1
33.0
32.6
0.011
N/A
N/A
41.2
9.2
15.7
N/A
1.1
2007
97
127
0.61
0.55
11.7
19.0
32.4
31.3
0.013
N/A
N/A
N/A
8.6
N/A
0.1
1.6
2006
102
129
0.75
0.51
13.4
19.7
32.7
30.6
0.007
N/A
N/A
N/A
8.3
N/A
0.8
1.5
2005
100
131
0.76
0.50
15.1
21.1
30.2
27.5
0.012
N/A
N/A
N/A
7.8
N/A
5.3
3.0
2004
85
140
0.71
0.63
16.0
18.1
30.6
31.3
0.013
N/A
N/A
N/A
N/A
N/A
1.6
2.7
2003
99
144
0.67
0.78
15.9
21.7
29.8
31.9
0.021
N/A
N/A
N/A
N/A
N/A
1.0
1.8
2002
94
142
0.73
0.79
15.7
22.9
30.6
31.3
0.016
N/A
N/A
N/A
N/A
N/A
0.7
0.4
2001
95
147
0.76
0.79
15.0
24.2
29.4
30.8
0.039
N/A
N/A
N/A
N/A
N/A
1.1
1.0
2000
95
157
0.88
0.83
14.7
23.4
29.7
28.2
0.034
N/A
N/A
N/A
N/A
N/A
0.4
1.4
Natural disasters
Type
Las Vegas
Moreno Valley
Tornado activity compared to U.S. average
2.1%
16.4%
Earthquake activity compared to U.S. average
6,093.4%
7,327.3%
Natural disasters compared to U.S. average
12%
46%
Transportation
Las Vegas offers extensive public transit including a monorail system, catering to both locals and tourists. Moreno Valley has fewer options, relying on buses for public transit. Commuting times in Moreno Valley tend to be longer, especially for residents working in other parts of the Greater Los Angeles area.
Transport
Type
Las Vegas
Moreno Valley
Amtrak stations
1
1
Amtrak stations nearby
1
3
FAA registered aircraft
1
27
FAA registered aircraft manufacturers and dealers
81
2
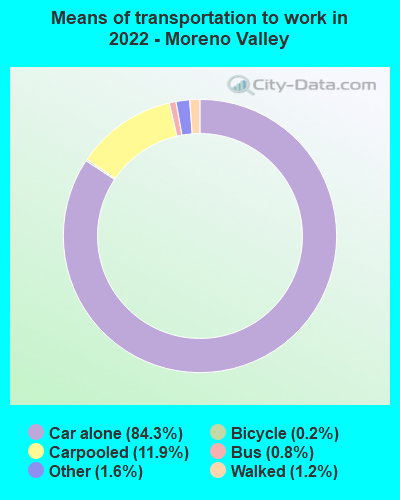
Means of transportation to work
Type
Las Vegas
Moreno Valley
Bicycle
0.1%
0.1%
Bus
2.2%
1.2%
Carpooled
10.3%
11.2%
Car alone
82.7%
84.7%
Motorcycle
0.4%
0.3%
Streetcar
0%
0.1%
Walked
1.4%
1.2%
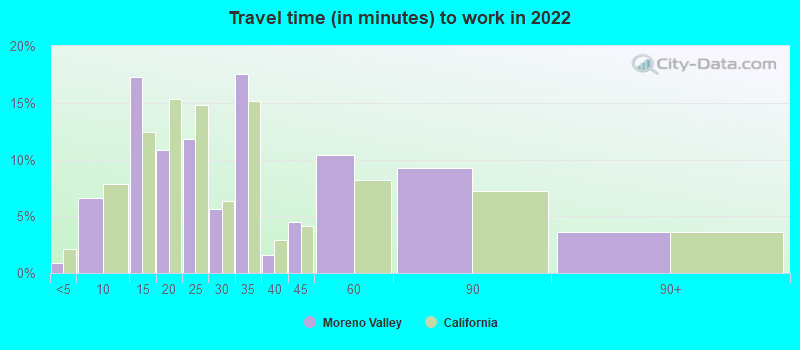
Average travel time to work
Type
Las Vegas
Moreno Valley
Average
26.3 min
29.1 min
Other means
24 min
34.1 min
Public transportation
49.9 min
55.2 min
Private vehicle occupancy
Type
Las Vegas
Moreno Valley
Average
1.2
1.2
Drove alone
88.9%
84.3%
In 2 person carpool
8.2%
12.3%
In 3 person carpool
2.1%
2.7%
In 4 person carpool
0.2%
0.4%
In 5-6 person carpool
0.4%
0.1%
In 7+ person carpool
0.2%
0.2%
How many people usually rode to work in the car, truck or van.
Real Estate
Las Vegas' real estate market is dynamic and offers a range of options from condos to luxury homes. Moreno Valley's real estate, while also diverse, tends to lean more towards single-family homes.
Neighborhoods
Las Vegas neighborhoods offer a mix – from quiet, suburban areas to the lively downtown. Moreno Valley is known for its family-friendly and peaceful neighborhoods. Both cities have areas with higher property values and areas with more affordable living spaces.
Houses and residents
Type
Las Vegas
Moreno Valley
Houses
269,602
55,128
Average household size (people)
2.7
3.7
Median year apartment built
1991
1990
Median year house/condo built
1995
1987
Length of stay in the house since moving in
10.1 years
13.4 years
Houses occupied
250,350 (92.9%)
54,104 (98.1%)
Houses occupied by owners
138,677 (55.4%)
33,152 (61.3%)
Houses occupied by renters
111,673 (44.6%)
20,952 (38.7%)
Median rent asked for vacant for-rent units
$1,176
$1,620
Median monthly housing costs
$1,255
$1,773
Median price asked for vacant for-sale houses and condos
$989,410
$478,171
Estimated median house or condo value
$362,400
$422,500
Median numbers of rooms
5.2
5.9
Median number of rooms in apartments
4.1
4.9
Median number of rooms in houses and condos
6.1
6.3
Median house price - detached houses
$439,169
$408,231
Median house price - in 2-unit structures
$161,204
Over $1,000,000
Median house price - in 3-to-4-unit structures
$201,871
$287,962
Median house price - in 5 or more unit structures
$327,174
$227,600
Median house price - mobile homes
$113,235
$77,425
Median house price - Townhouses or other attached units
$274,961
$416,724
Median house price - All housing units
$417,434
$396,904
Median house age
27
33
Renting percentage
43.5%
35.3%
Housing density (houses/condos per square mile)
2,379.4
1,076.1
House value disparities
27.1%
18.2%
Household income disparities
47.1%
37.8%
Median household income for houses/condes with a mortgage
$90,388
$96,852
Median household income for apartments without a mortgage
$62,287
$72,290
Housing units without a mortgage
1,172 (1.2%)
207 (0.8%)
Housing units with both a second mortgage and home equity loan
4,450 (4.6%)
1,146 (4.3%)
Housing units with a mortgage
95,992 (98.8%)
26,147 (99.2%)
Housing units with a home equity loan
178 (0.2%)
24 (0.1%)
Housing units with a second mortgage
5,092 (5.2%)
1,290 (4.9%)
House/condo owner moved in on average (years ago)
7
13
House/condo renter moved in on average (years ago)
2
4
Housing units lacking complete kitchen facilities
1.3%
1.7%
Housing units lacking complete plumbing facilities
1%
0.1%
Housing units in structures
Housing units in structures
Las Vegas
Moreno Valley
One, detached
61.5%
79.5%
One, attached
5.3%
2.4%
Two
1.3%
0.7%
3 or 4
7.7%
2.2%
5 to 9
8.4%
5.6%
10 to 19
4.8%
2.7%
20 to 49
2.8%
1.5%
50 or more
6.8%
3.3%
Mobile homes
1.4%
1.9%
Boats, RVs, vans, etc.
0.1%
0.0%
Median real estate property taxes paid for housing units
Self-employed workers in own not incorporated business
18,990
4,730
State government workers
6,950
1,746
Unpaid family workers
614
181
Industries and Occupations
Industries in Las Vegas are dominated by entertainment, but the city provides opportunities in IT, healthcare, and construction. Moreno Valley offers a wide range of occupations, notably in the logistics sector due to its proximity to major shipping routes.
Both cities have access to excellent health care facilities. However, Las Vegas has a larger and more diverse selection of health care providers, clinics, and hospitals. Availability of services rendered is comparable in both cities.
Health (county statistics)
Type
Las Vegas
Moreno Valley
General health status score of residents in this county from 1 (poor) to 5 (excellent)
Las Vegas boasts extensive infrastructure to cater to the constant influx of tourists. Meanwhile, Moreno Valley focuses more on residential infrastructure. Both cities are improving public areas, with Las Vegas working on downtown revitalization, and Moreno Valley developing its parks and recreation facilities.
Infrastructure
Type
Las Vegas
Moreno Valley
Hospitals
39
8
TV stations
12
5
Bank branches located here
281
15
Bank institutions located here
34
7
Drinking water stations with no reported violations in the past
32
1
Drinking water stations with reported violations in the past
HMDA - Conventional home purchase loans - Applications denied
Year
Las Vegas
Moreno Valley
1999
2,657
253
2000
579
0
2001
371
0
2002
380
0
2003
3,590
1,150
2004
5,908
1,936
2005
7,894
2,705
2006
6,914
2,993
2007
3,733
1,542
2008
1,431
599
2009
813
269
Culture and Food
Las Vegas is well-known worldwide for its rich and diverse food scene, alongside a vibrant entertainment industry. Moreno Valley also has diverse food options, but it is more subdued and residential in comparison to Las Vegas.
Sports Teams
In terms of sports, Las Vegas is home to professional teams like the Raiders (NFL) and Golden Knights (NHL). Whereas Moreno Valley does not have major professional sports teams but residents enjoy access to the sports-centric culture of the broader Southern California area.


 Las Vegas, NV
 Moreno Valley, CA