Las Vegas, the Entertainment Capital of the World, and Oakland, a bustling California city with unique cultural offerings, both offer unique lifestyles. Although they share some similarities, there are clear differences when comparing factors such as crime/safety, weather, cost of living, and even their sports teams. The following comparison should provide insight for those considering a move or just wishing to visit either city.
Distance between
Las Vegas, NV and
Oakland, CA : 402.0 miles
Las Vegas's population is larger by 49%. Its population has grown by 168,356 people (35.2%) since 2000. The population of Oakland has grown by 34,339 people (8.6%) during that time.
When it comes to crime, both cities require careful vigilance. The crime rate in Las Vegas is significantly higher than the national average, primarily in property crime. Oakland, though also having a high crime rate, has seen a decline in recent years. Neighborhood crime rates can vary, so research is recommended. Tourists in both cities are generally safe, particularly in high-traffic areas.
City-data.com crime index counts serious crimes and violent crime more heavily. It adjusts for the number of visitors and daily workers commuting into cities. (higher means more crime, U.S. average = 301.1)
City-data.com crime index counts serious crimes and violent crime more heavily. It adjusts for the number of visitors and daily workers commuting into cities. (higher means more crime, U.S. average = 301.1)
Sex Offenders
According to our data, there are 4,789 registered sex offenders living in Las Vegas and 916 registered sex offenders living in . The ratio of residents to sex offenders in Las Vegas is 132 to 1; the ratio in Oakland is 459 to 1. The number of registered sex offenders compared to the number of residents is much larger in Las Vegas than that in Oakland.
Cost of Living
Compared to Oakland, Las Vegas is dramatically less expensive in terms of cost of living including housing, groceries, and healthcare according to Payscale. Oakland, like much of California, is significantly more costly due to higher property costs.
Income Tax
Nevada does not have a state income tax, making it attractive for high-income earners. California has a progressive income tax, with rates that can be high for top earners.
Property Tax
Property taxes are lower in Nevada than in California. Las Vegas homeowners tend to pay less in property taxes than those in Oakland due to the lower home prices.
Sales Tax
Sales tax is higher in Las Vegas at 8.375% compared to Oakland's 9.25%. Nevada has no state income tax which can make it a more attractive place to live financially.
Income
Type
Las Vegas
Oakland
Estimated median household income
$59,746
$82,236
Estimated per capita income
$33,825
$49,966
Cost of living index (U.S. average is 100)
99.1
126.7
If you make $50,000 in Las Vegas, you will have to make $63,925 in Oakland to maintain the same standard of living.
Geographical Conditions
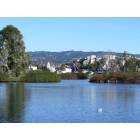
Las Vegas is a desert city surrounded by mountains, while Oakland is a coastal city featuring rolling hills, providing a greater variation of outdoor activities.
Both cities offer a variety of educational institutions. Las Vegas has a much larger school district, Clark County School District, with more schools but Oakland boasts more prestigious universities like University of California, Berkeley nearby.
Economically, both cities rely heavily on the service industry. Las Vegas' economy is heavily tied to tourism, gaming, and entertainment. Oakland's economy is more diverse, including trade, healthcare, professional services, and is part of the Silicon Valley tech hub.
Biggest Employers
In Las Vegas, MGM Resorts International, Caesars Entertainment, and the local government are the largest employers. Oakland's biggest employers include Kaiser Permanente, the City of Oakland, and Sutter Health.
There were 2,700 building permits issued in Las Vegas in 2012 (1886 more than in 2011) compared to 114 building permits issued in Oakland in 2012 (73 more than in 2011).
In Las Vegas (Clark County), 56.4% voted for Democrats and 41.8% for Republicans in 2012 Presidential Election. In Oakland (Alameda County), 78.9% voted for Democrats and 18.2% for Republicans.
Elections
Type
Democrats
Republicans
Other
Year
Las Vegas
Oakland
Las Vegas
Oakland
Las Vegas
Oakland
2020
53.7%
79.8%
44.3%
17.6%
2.0%
2.6%
2016
52.4%
78.2%
41.7%
14.6%
5.8%
7.2%
2012
56.4%
78.9%
41.8%
18.2%
1.8%
3.0%
2008
58.5%
78.8%
39.5%
19.3%
2.0%
2.0%
2004
51.8%
75.5%
46.9%
23.4%
1.3%
1.1%
2000
51.4%
69.6%
44.8%
24.2%
3.8%
6.2%
1996
75.5%
65.8%
18.8%
23.1%
5.7%
11.2%
Breakdown of population affiliated with a religious congregation
Type
Adherents
Congregations
Religion
Las Vegas
Oakland
Las Vegas
Oakland
CATHOLIC CHURCH
18.1%
15.3%
4.0%
4.9%
SOUTHERN BAPTIST CONVENTION
1.6%
1.5%
11.2%
10.9%
EVANGELICAL LUTHERAN CHURCH IN AMERICA
0.4%
0.3%
1.6%
2.3%
AMERICAN BAPTIST CHURCHES IN THE USA
0.2%
0.5%
1.4%
2.5%
EPISCOPAL CHURCH
0.1%
0.3%
1.1%
1.7%
MUSLIM ESTIMATE
0.1%
2.0%
0.6%
2.5%
Weather
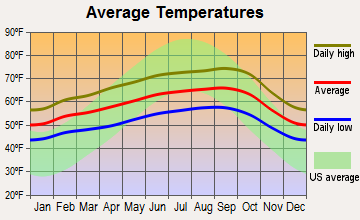
Weather greatly differs between these two cities. Las Vegas, located in a desert, experiences hot, dry summers and mild winters. Oakland, on the other hand, enjoys a Mediterranean climate with warm, dry summers and mild, wet winters. Venturing outside may be more comfortable in Oakland during peak summer months.
Weather and climate
Type
Las Vegas
Oakland
Temperature - Average
65.5°F
59.1°F
Humidity - Average morning or afternoon humidity
30.7%
84.2%
Humidity - Differences between morning and afternoon humidity
42%
29%
Humidity - Maximum monthly morning or afternoon humidity
52%
90.9%
Humidity - Minimum monthly morning or afternoon humidity
10%
61.9%
Precipitation - Yearly average
5.7 in
23.5 in
Snowfall - Yearly average
1.6 in
0 in
Clouds - Number of days clear of clouds
35.1%
26.9%
Sunshine amount - Average
91.8%
73%
Sunshine amount - Differences during a year
16%
22%
Sunshine amount - Maximum monthly
92%
77%
Sunshine amount - Minimum monthly
76%
55%
Wind speed - Average
9.2 mph
11.4 mph
Average climate in Las Vegas, Nevada
Average climate in Oakland, California
Air pollution
Type
AQI
CO
NO2
OZONE
PB
PM10
PM25
SO2
Year
Las Vegas
Oakland
Las Vegas
Oakland
Las Vegas
Oakland
Las Vegas
Oakland
Oakland
Las Vegas
Las Vegas
Oakland
Las Vegas
Oakland
2018
100
105
0.42
0.46
13.1
13.0
37.2
20.9
0.012
N/A
24.4
N/A
6.0
13.7
0.7
0.4
2017
101
100
0.29
0.48
13.0
13.5
38.5
21.2
0.008
N/A
20.3
N/A
7.3
11.3
0.8
0.5
2016
97
80
0.38
0.41
11.2
12.9
36.5
20.3
0.005
N/A
20.6
N/A
8.7
7.9
0.8
0.9
2015
92
93
0.36
0.43
12.4
14.5
35.6
20.6
0.004
N/A
18.9
N/A
8.4
9.5
1.2
0.8
2014
91
90
0.40
0.42
10.8
14.7
36.5
20.6
0.005
N/A
21.1
N/A
9.2
9.1
1.4
0.5
2013
103
89
0.45
0.39
9.6
15.2
36.9
18.0
0.004
N/A
22.1
N/A
8.6
11.6
1.5
0.5
2012
94
87
0.49
0.38
5.9
13.7
38.5
18.7
0.003
N/A
21.5
N/A
8.3
8.5
1.4
0.7
2011
85
94
0.40
0.32
5.3
14.4
37.5
18.5
0.003
N/A
18.2
N/A
7.8
10.1
1.2
1.1
2010
86
90
0.50
0.21
5.7
14.4
36.6
19.4
0.013
N/A
16.1
N/A
7.1
8.4
N/A
1.0
2009
87
99
0.56
0.22
6.0
15.2
33.3
19.0
0.006
N/A
20.9
N/A
8.3
11.3
N/A
1.3
2008
82
110
0.66
0.29
8.2
15.1
33.0
20.1
0.006
N/A
N/A
N/A
9.2
12.4
N/A
1.0
2007
97
100
0.61
0.41
11.7
13.4
32.4
21.3
0.006
N/A
N/A
N/A
8.6
9.5
0.1
1.1
2006
102
106
0.75
0.47
13.4
13.8
32.7
22.6
N/A
N/A
N/A
N/A
8.3
9.4
0.8
1.3
2005
100
97
0.76
0.56
15.1
13.3
30.2
15.3
N/A
N/A
N/A
N/A
7.8
9.6
5.3
1.4
2004
85
107
0.71
0.51
16.0
14.3
30.6
15.3
0.004
N/A
N/A
N/A
N/A
11.3
1.6
1.8
2003
99
82
0.67
0.63
15.9
16.1
29.8
15.8
N/A
N/A
N/A
N/A
N/A
N/A
1.0
1.7
2002
94
81
0.73
0.69
15.7
18.8
30.6
16.7
0.008
N/A
N/A
N/A
N/A
N/A
0.7
1.6
2001
95
87
0.76
0.70
15.0
17.2
29.4
12.7
0.008
N/A
N/A
N/A
N/A
N/A
1.1
1.5
2000
95
78
0.88
0.84
14.7
17.1
29.7
11.8
0.012
N/A
N/A
N/A
N/A
N/A
0.4
1.8
Natural disasters
Type
Las Vegas
Oakland
Tornado activity compared to U.S. average
2.1%
8.8%
Earthquake activity compared to U.S. average
6,093.4%
7,647.7%
Natural disasters compared to U.S. average
12%
20%
Transportation
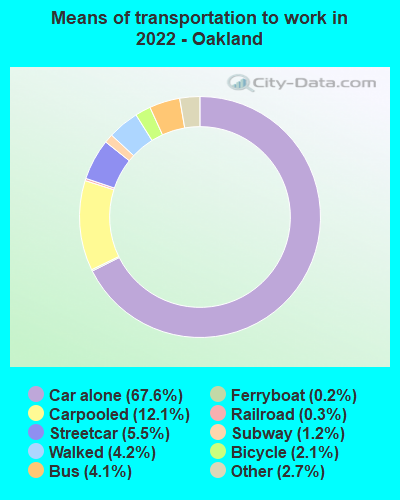
Public transportation is more developed in Oakland with BART, buses and ferries. Las Vegas relies more heavily on personal vehicles, although it does offer bus services and a monorail along the Strip.
Transport
Type
Las Vegas
Oakland
Amtrak stations
1
1
Amtrak stations nearby
1
3
FAA registered aircraft
1
154
FAA registered aircraft manufacturers and dealers
81
2
Means of transportation to work
Type
Las Vegas
Oakland
Bicycle
0.1%
1%
Bus
2.2%
3.2%
Carpooled
10.3%
12.6%
Car alone
82.7%
72.2%
Ferryboat
0%
0.1%
Motorcycle
0.4%
0.4%
Streetcar
0%
2.3%
Subway
0%
0.5%
Taxicab
0%
0.1%
Walked
1.4%
5.5%
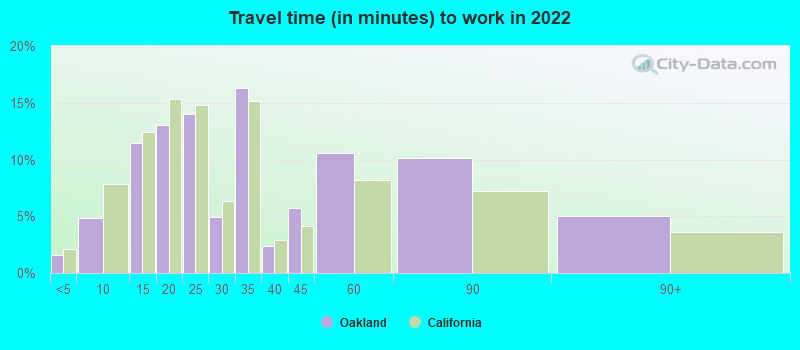
Average travel time to work
Type
Las Vegas
Oakland
Average
26.3 min
33.6 min
Other means
24 min
29 min
Public transportation
49.9 min
45.3 min
Private vehicle occupancy
Type
Las Vegas
Oakland
Average
1.2
1.2
Drove alone
88.9%
88.1%
In 2 person carpool
8.2%
9.2%
In 3 person carpool
2.1%
2%
In 4 person carpool
0.2%
0.6%
In 5-6 person carpool
0.4%
0%
In 7+ person carpool
0.2%
0%
How many people usually rode to work in the car, truck or van.
Real Estate
The real estate market sharply contrasts between these two cities. Las Vegas, although not cheap, is far more affordable than Oakland, which, like much of the Bay Area, has one of the highest housing markets in the country.
Neighborhoods
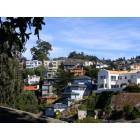
Las Vegas is defined by the Strip, but also has quieter, family-friendly neighborhoods like Summerlin. Oakland offers vibrant neighborhoods like Rockridge and Montclair, each with unique cultural offerings.
Houses and residents
Type
Las Vegas
Oakland
Houses
269,602
186,660
Average household size (people)
2.7
2.5
Median year apartment built
1991
1958
Median year house/condo built
1995
1943
Length of stay in the house since moving in
10.1 years
15.4 years
Houses occupied
250,350 (92.9%)
170,366 (91.3%)
Houses occupied by owners
138,677 (55.4%)
72,661 (42.7%)
Houses occupied by renters
111,673 (44.6%)
97,705 (57.4%)
Median rent asked for vacant for-rent units
$1,176
$3,127
Median monthly housing costs
$1,255
$1,921
Median price asked for vacant for-sale houses and condos
$989,410
$923,387
Estimated median house or condo value
$362,400
$848,600
Median numbers of rooms
5.2
4.3
Median number of rooms in apartments
4.1
3.6
Median number of rooms in houses and condos
6.1
5.7
Median house price - detached houses
$439,169
Over $1,000,000
Median house price - in 2-unit structures
$161,204
$781,885
Median house price - in 3-to-4-unit structures
$201,871
$716,428
Median house price - in 5 or more unit structures
$327,174
$709,698
Median house price - mobile homes
$113,235
$365,144
Median house price - Townhouses or other attached units
$274,961
$834,685
Median house price - All housing units
$417,434
$991,120
Median house age
27
69
Renting percentage
43.5%
58.9%
Housing density (houses/condos per square mile)
2,379.4
3,329.9
House value disparities
27.1%
22.3%
Household income disparities
47.1%
45.9%
Median household income for houses/condes with a mortgage
$90,388
$153,718
Median household income for apartments without a mortgage
$62,287
$81,904
Housing units without a mortgage
1,172 (1.2%)
1,176 (2.2%)
Housing units with both a second mortgage and home equity loan
4,450 (4.6%)
4,996 (9.4%)
Housing units with a mortgage
95,992 (98.8%)
51,720 (97.8%)
Housing units with a home equity loan
178 (0.2%)
139 (0.3%)
Housing units with a second mortgage
5,092 (5.2%)
6,096 (11.5%)
House/condo owner moved in on average (years ago)
7
13
House/condo renter moved in on average (years ago)
2
4
Housing units lacking complete kitchen facilities
1.3%
2.4%
Housing units lacking complete plumbing facilities
1%
1.6%
Housing units in structures
Housing units in structures
Las Vegas
Oakland
One, detached
61.5%
42.3%
One, attached
5.3%
4.9%
Two
1.3%
6.2%
3 or 4
7.7%
11.1%
5 to 9
8.4%
6.6%
10 to 19
4.8%
6.9%
20 to 49
2.8%
9.9%
50 or more
6.8%
11.7%
Mobile homes
1.4%
0.3%
Boats, RVs, vans, etc.
0.1%
0.1%
Median real estate property taxes paid for housing units
Self-employed workers in own not incorporated business
18,990
20,615
State government workers
6,950
9,112
Unpaid family workers
614
529
Industries and Occupations
Las Vegas' primary industries are tourism, gaming, and entertainment. Many residents work in these fields. In Oakland, the healthcare, trade, and tech industries dominate.
Both cities have access to quality healthcare. Las Vegas has a range of health districts and hospitals while Oakland benefits from healthcare giants like Kaiser Permanente.
Health (county statistics)
Type
Las Vegas
Oakland
General health status score of residents in this county from 1 (poor) to 5 (excellent)
Infrastructure varies between these two cities. Las Vegas has a larger and more expansive road network due to its rapid growth and sprawl. Oakland, being more established and dense, has more extensive public transportation but also more aging infrastructure.
Infrastructure
Type
Las Vegas
Oakland
Hospitals
39
9
TV stations
12
28
Arenas or stadiums
2
2
Bank branches located here
281
76
Bank institutions located here
34
29
Main business address for public companies
57
10
Drinking water stations with no reported violations in the past
32
10
Drinking water stations with reported violations in the past
HMDA - Conventional home purchase loans - Applications denied
Year
Las Vegas
Oakland
1999
2,657
1,291
2000
579
1,721
2001
371
1,244
2002
380
1,370
2003
3,590
2,021
2004
5,908
3,261
2005
7,894
3,850
2006
6,914
4,422
2007
3,733
2,645
2008
1,431
1,041
2009
813
700
Culture and Food
Both cities offer rich cultural experiences. Las Vegas is known for its entertainment, nightlife and dining scene. Oakland, on the other hand, has a diverse arts scene and offers a wide range of dining options, showcasing the region's cultural diversity.
Sports Teams
The Las Vegas Raiders (NFL) and the Golden Knights (NHL) call Vegas home. Oakland used to be the home of the Raiders and still hosts the Athletics (MLB) and the Golden State Warriors (NBA).


 Las Vegas, NV
 Oakland, CA