Although Las Vegas, NV and Perris Valley, CA are both popular destinations for different reasons, they present unique characteristics that significantly set them apart. Where Las Vegas is internationally famous for its nightlife and entertainment, Perris Valley offers a more rural lifestyle and slower pace. Herein is a detailed comparison examining these two cities in terms of crime and safety, weather, cost of living, and several other factors crucial to those considering relocating or just visiting.
Las Vegas has a higher crime rate than Perris Valley. It's important to note, though, that crime in Las Vegas is often confined to specific areas, rather than spread evenly across the city. On the other hand, Perris Valley generally has a lower crime rate than the national average, providing a safer living environment. However, both cities consistently work towards enhancing safety measures and protecting their residents.
Cost of Living
Las Vegas provides a relatively lower cost of living compared to Perris Valley. The expenses for housing, utilities, and transportation are more affordable in Las Vegas. On the other hand, Perris Valley's proximity to the more bustling areas of Southern California causes a higher cost of living.
Income Tax
Nevada offers a significant advantage here, as it does not have a state income tax. On the other hand, California has one of the highest state income tax rates in the country. Therefore, for residents who generate a substantial income, Las Vegas may be financially more advantageous.
Property Tax
In terms of property tax, both jurisdictions differ significantly. Nevada tends to have lower property tax rates than California, making Las Vegas an attractive option for potential homeowners.
Sales Tax
Nevada has a higher state sales tax rate than California, but Perris Valley increases the total due to a local city tax. Therefore, while items may be priced similarly in both cities, the total cost may be slightly higher in Perris Valley due to the local city tax.
Income
Type
Las Vegas
Perris Valley
Estimated median household income
$59,746
$71,187
Estimated per capita income
$33,825
$27,699
Cost of living index (U.S. average is 100)
99.1
85.6
If you make $50,000 in Perris Valley, you will have to make $57,886 in Las Vegas to maintain the same standard of living.
Geographical Conditions
Perris Valley has a variety of geographical features including mountains, valleys, and lakes, providing ample opportunities for outdoor recreation. Meanwhile, Las Vegas, situated in a desert, has a distinctly different landscape but the nearby Red Rock National Conservation Area offers hiking and biking trails.
Geographical information
Type
Las Vegas
Perris Valley
Land area
113.3 sq. miles
276.5 sq. miles
Population density
5,708.4 people per sq. mile
689.3 people per sq. mile
Relative area comparison
Las Vegas, NV Perris Valley, CA
Education
Both cities offer plenty of educational opportunities. However, Las Vegas may offer more diversity due to its higher population and larger size. Perris Valley's school district has been recognized for its great efforts in improving the quality of education, and the city is also close to numerous higher education institutions in Southern California.
Las Vegas's economy is heavily tourism-based, creating numerous job opportunities in entertainment, hospitality, and food and beverage industries. Perris Valley has a more diversified economy, featuring healthcare, education, and retail as leading sectors of employment.
Biggest Employers
In Las Vegas, the biggest employers are generally casinos and resort hotels like MGM Grand and Caesars Palace. Perris Valley, on the other hand, has more traditional employers, including the Val Verde Unified School District and Riverside County Regional Medical Center.
In Las Vegas (Clark County), 56.4% voted for Democrats and 41.8% for Republicans in 2012 Presidential Election. In Perris Valley (Riverside County), 49.6% voted for Democrats and 48.0% for Republicans.
Elections
Type
Democrats
Republicans
Other
Year
Las Vegas
Perris Valley
Las Vegas
Perris Valley
Las Vegas
Perris Valley
2020
53.7%
53.0%
44.3%
45.0%
2.0%
2.0%
2016
52.4%
49.7%
41.7%
44.4%
5.8%
5.9%
2012
56.4%
49.6%
41.8%
48.0%
1.8%
2.4%
2008
58.5%
50.4%
39.5%
48.1%
2.0%
1.5%
2004
51.8%
41.3%
46.9%
58.2%
1.3%
0.6%
2000
51.4%
45.0%
44.8%
51.6%
3.8%
3.4%
1996
75.5%
43.0%
18.8%
45.6%
5.7%
11.3%
Breakdown of population affiliated with a religious congregation
Type
Adherents
Congregations
Religion
Las Vegas
Perris Valley
Las Vegas
Perris Valley
CATHOLIC CHURCH
18.1%
27.5%
4.0%
4.5%
SOUTHERN BAPTIST CONVENTION
1.6%
1.2%
11.2%
11.2%
EVANGELICAL LUTHERAN CHURCH IN AMERICA
0.4%
0.3%
1.6%
1.5%
SEVENTH DAY ADVENTIST CHURCH
0.2%
0.9%
1.6%
3.4%
MUSLIM ESTIMATE
0.1%
0.5%
0.6%
0.7%
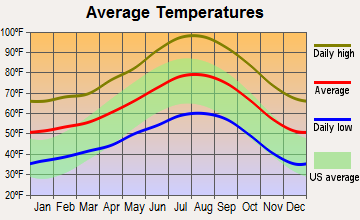
Weather
Weather is a key difference between Las Vegas and Perris Valley. Las Vegas, situated in a desert, experiences extremely high temperatures in the summer. Conversely, Perris Valley's California location brings about milder, more pleasant weather conditions. However, it's important to remember California's susceptibility to earthquakes, with Perris Valley being no exception.
Weather and climate
Type
Las Vegas
Perris Valley
Temperature - Average
65.5°F
64.1°F
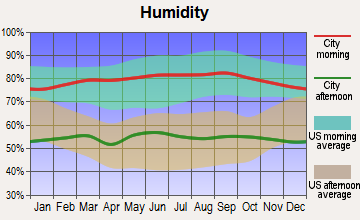
Humidity - Average morning or afternoon humidity
30.7%
68%
Humidity - Differences between morning and afternoon humidity
42%
22.4%
Humidity - Maximum monthly morning or afternoon humidity
52%
75.1%
Humidity - Minimum monthly morning or afternoon humidity
10%
52.7%
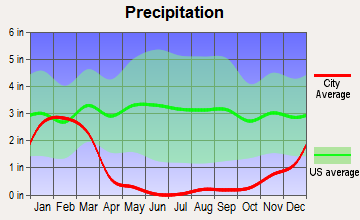
Precipitation - Yearly average
5.7 in
11.5 in
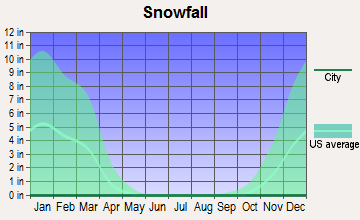
Snowfall - Yearly average
1.6 in
0 in
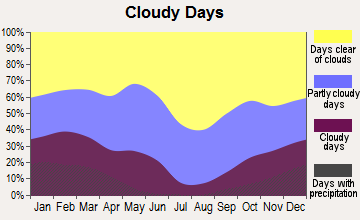
Clouds - Number of days clear of clouds
35.1%
27.1%
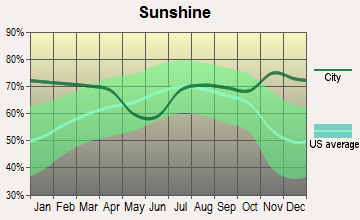
Sunshine amount - Average
91.8%
77.6%
Sunshine amount - Differences during a year
16%
20.5%
Sunshine amount - Maximum monthly
92%
82%
Sunshine amount - Minimum monthly
76%
61.5%
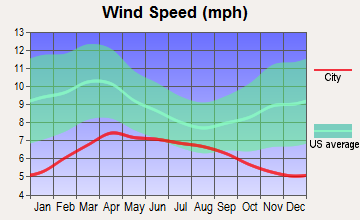
Wind speed - Average
9.2 mph
5 mph
Average climate in Las Vegas, Nevada
Average climate in Perris Valley, California
Air pollution
Type
AQI
CO
NO2
OZONE
PB
PM10
PM25
SO2
Year
Las Vegas
Perris Valley
Las Vegas
Perris Valley
Las Vegas
Perris Valley
Las Vegas
Perris Valley
Perris Valley
Las Vegas
Perris Valley
Las Vegas
Perris Valley
Las Vegas
Perris Valley
2018
100
154
0.42
0.28
13.1
9.3
37.2
33.0
0.006
N/A
24.4
27.9
6.0
8.9
0.7
0.5
2017
101
146
0.29
0.28
13.0
8.7
38.5
33.0
0.004
N/A
20.3
28.9
7.3
11.4
0.8
0.3
2016
97
143
0.38
0.25
11.2
8.9
36.5
31.6
0.006
N/A
20.6
27.6
8.7
11.0
0.8
0.2
2015
92
145
0.36
0.22
12.4
9.0
35.6
31.6
0.004
N/A
18.9
25.5
8.4
11.6
1.2
0.3
2014
91
148
0.40
0.24
10.8
10.5
36.5
32.6
0.006
N/A
21.1
31.9
9.2
13.6
1.4
0.3
2013
103
150
0.45
0.24
9.6
10.8
36.9
32.4
0.006
N/A
22.1
30.8
8.6
11.7
1.5
0.2
2012
94
145
0.49
0.23
5.9
11.3
38.5
31.4
0.007
N/A
21.5
28.3
8.3
12.1
1.4
0.2
2011
85
149
0.40
0.26
5.3
11.7
37.5
31.0
0.006
N/A
18.2
30.1
7.8
13.2
1.2
0.3
2010
86
146
0.50
0.29
5.7
12.3
36.6
31.4
0.008
N/A
16.1
27.8
7.1
13.3
N/A
1.3
2009
87
151
0.56
0.26
6.0
14.3
33.3
31.3
0.010
N/A
20.9
30.8
8.3
13.8
N/A
1.6
2008
82
155
0.66
0.34
8.2
14.9
33.0
32.3
0.011
N/A
N/A
40.0
9.2
12.0
N/A
0.9
2007
97
125
0.61
0.41
11.7
15.6
32.4
31.8
0.013
N/A
N/A
N/A
8.6
N/A
0.1
1.5
2006
102
126
0.75
0.37
13.4
16.2
32.7
30.9
0.007
N/A
N/A
N/A
8.3
N/A
0.8
1.3
2005
100
129
0.76
0.35
15.1
15.7
30.2
25.4
0.012
N/A
N/A
N/A
7.8
N/A
5.3
3.4
2004
85
137
0.71
0.42
16.0
15.5
30.6
30.2
0.013
N/A
N/A
N/A
N/A
N/A
1.6
3.4
2003
99
140
0.67
0.57
15.9
18.3
29.8
31.9
0.020
N/A
N/A
N/A
N/A
N/A
1.0
2.2
2002
94
138
0.73
0.57
15.7
18.3
30.6
33.2
0.015
N/A
N/A
N/A
N/A
N/A
0.7
0.1
2001
95
145
0.76
0.79
15.0
19.2
29.4
32.5
0.052
N/A
N/A
N/A
N/A
N/A
1.1
0.8
2000
95
157
0.88
0.83
14.7
18.4
29.7
28.8
0.033
N/A
N/A
N/A
N/A
N/A
0.4
1.1
Natural disasters
Type
Las Vegas
Perris Valley
Tornado activity compared to U.S. average
2.1%
16.2%
Earthquake activity compared to U.S. average
6,093.4%
7,175.7%
Natural disasters compared to U.S. average
12%
46%
Transportation
Public transportation is more developed in Las Vegas due to its large size and influx of tourists. It offers a variety of options including buses, taxis, monorails and ride-sharing services. Perris Valley has more limited public transit, so most residents find it necessary to own a car for regular commuting.
Transport
Type
Las Vegas
Perris Valley
Amtrak stations
1
0
Amtrak stations nearby
1
3
FAA registered aircraft
1
0
FAA registered aircraft manufacturers and dealers
81
0
Means of transportation to work
Type
Las Vegas
Perris Valley
Bicycle
0.1%
0.3%
Bus
2.2%
1%
Carpooled
10.3%
18%
Car alone
82.7%
73.6%
Motorcycle
0.4%
0.1%
Railroad
0%
0.2%
Walked
1.4%
1.4%
Average travel time to work
Type
Las Vegas
Perris Valley
Average
26.3 min
37 min
Real Estate
Las Vegas offers more diversity in real estate, from high-rise condos to suburban homes. In Perris Valley, real estate consists mostly of single-family residential homes. In general, purchasing property is more affordable in Las Vegas than in Perris Valley due to California's higher property prices.
Neighborhoods
Las Vegas caters to a variety of lifestyles - from the bustling Strip to quiet, family-friendly suburbs like Summerlin. Perris Valley offers a more rural and laid-back atmosphere, with quieter, family-oriented neighborhoods.
Houses and residents
Type
Las Vegas
Perris Valley
Houses
269,602
51,323
Average household size (people)
2.7
3.4
Houses occupied
250,350 (92.9%)
46,991 (91.6%)
Houses occupied by owners
138,677 (55.4%)
36,693 (78.1%)
Houses occupied by renters
111,673 (44.6%)
10,298 (21.9%)
Median rent asked for vacant for-rent units
$1,176
$1,322
Median price asked for vacant for-sale houses and condos
$989,410
$464,486
Estimated median house or condo value
$362,400
$376,802
Median number of rooms in apartments
4.1
5.7
Median number of rooms in houses and condos
6.1
6.2
Renting percentage
43.5%
27.2%
Housing density (houses/condos per square mile)
2,379.4
185.6
Household income disparities
47.1%
42.4%
Housing units without a mortgage
1,172 (1.2%)
6,227 (22.3%)
Housing units with both a second mortgage and home equity loan
4,450 (4.6%)
116 (0.4%)
Housing units with a mortgage
95,992 (98.8%)
21,647 (77.7%)
Housing units with a home equity loan
178 (0.2%)
962 (3.5%)
Housing units with a second mortgage
5,092 (5.2%)
3,573 (12.8%)
Housing units lacking complete kitchen facilities
1.3%
1.1%
Housing units lacking complete plumbing facilities
Self-employed workers in own not incorporated business
18,990
4,282
State government workers
6,950
1,900
Unpaid family workers
614
195
Industries and Occupations
As expected, the hospitality and entertainment industry plays a huge role in Las Vegas. In Perris Valley, however, the top industries are healthcare, education, and retail. Thus, while Las Vegas draws a number of professionals in entertainment and hospitality, Perris Valley tends to attract those in education, healthcare, and retail occupations.
Both cities have good health care facilities. Las Vegas has the advantage of several large hospitals and a larger concentration of physicians due to its population size, while Perris Valley offers quality care as part of the Southern California health system.
Health (county statistics)
Type
Las Vegas
Perris Valley
General health status score of residents in this county from 1 (poor) to 5 (excellent)
Las Vegas boasts a well-developed infrastructure with a good network of highways, and an international airport serving millions of tourists every year. Perris Valley, being smaller, has less extensive infrastructure, but it benefits from its proximity to the broader infrastructure of Southern California, including several major airports.
Infrastructure
Type
Las Vegas
Perris Valley
TV stations
12
4
Culture and Food
Las Vegas is renowned for its world-class restaurants, and diverse culinary scene influenced by its cosmopolitan population. Perris Valley offers a more traditional Californian cuisine with an emphasis on fresh, local produce and casual dining establishments.
Sports Teams
For sports fans, Las Vegas is home to the Raiders (NFL) and the Golden Knights (NHL). Perris Valley does not have major professional sports teams but residents have access to California's rich sports scene, with teams in nearby Los Angeles and San Diego.
 Las Vegas, NV
 Perris Valley, CA