Las Vegas, Nevada, and Rancho Cucamonga, California, offer completely different living experiences. Vegas is known for its thriving tourism, nightlife, and entertainment industries, but also offers a good quality of life for its residents. Rancho Cucamonga, on the other hand, offers a more relaxed, suburban lifestyle with a strong focus on education, healthcare, and outdoor activities. Both cities, however, have their own unique charm and advantages.
Distance between
Las Vegas, NV and
Rancho Cucamonga, CA : 195.4 miles
Las Vegas's population is larger by 269%. Its population has grown by 168,356 people (35.2%) since 2000. The population of Rancho Cucamonga has grown by 47,399 people (37.1%) during that time.
According to NeighborhoodScout, the crime rate in Las Vegas is considerably higher than in Rancho Cucamonga. While both cities have seen a decline in crime rates over the years, Las Vegas still lags behind in overall safety. However, certain neighborhoods in Vegas are rated much safer than others. Rancho Cucamonga, on the other hand, is consistently ranked as one of the safest cities in California.
City-data.com crime index counts serious crimes and violent crime more heavily. It adjusts for the number of visitors and daily workers commuting into cities. (higher means more crime, U.S. average = 301.1)
City-data.com crime index counts serious crimes and violent crime more heavily. It adjusts for the number of visitors and daily workers commuting into cities. (higher means more crime, U.S. average = 301.1)
Sex Offenders
According to our data, there are 4,787 registered sex offenders living in Las Vegas and 106 registered sex offenders living in . The ratio of residents to sex offenders in Las Vegas is 132 to 1; the ratio in Rancho Cucamonga is 1,665 to 1. The number of registered sex offenders compared to the number of residents is much larger in Las Vegas than that in Rancho Cucamonga.
Cost of Living
The cost of living in Rancho Cucamonga is significantly higher than in Las Vegas, largely due to California's high property and income taxes. Las Vegas, on the other hand, has lower housing costs and does not impose state income tax, giving it a lower overall cost of living.
Income Tax
One major financial advantage of living in Vegas is the absence of state income tax. In contrast, California has one of the highest state income taxes in the nation, which significantly impacts residents of Rancho Cucamonga.
Property Tax
Las Vegas has a property tax rate of about 0.70% while Rancho Cucamonga's is slightly lower at around 0.68%. However, given California's significantly higher home prices, homeowners in Rancho Cucamonga may end up paying more in property taxes.
Sales Tax
Nevada has a higher sales tax than California, with Las Vegas's combined city and state sales tax sitting at about 8.38%. In contrast, Rancho Cucamonga has a combined sales tax of 7.75%.
Income
Type
Las Vegas
Rancho Cucamonga
Estimated median household income
$59,746
$83,850
Estimated per capita income
$33,825
$37,696
Cost of living index (U.S. average is 100)
99.1
84
If you make $50,000 in Rancho Cucamonga, you will have to make $58,988 in Las Vegas to maintain the same standard of living.
Geographical Conditions
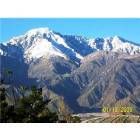
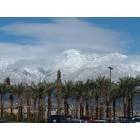
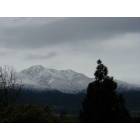
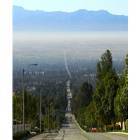
Las Vegas is located in Nevada's Mojave Desert, while Rancho Cucamonga is situated at the base of the San Gabriel Mountains. This results in differing landscapes and recreational opportunities in both cities.
Rancho Cucamonga has a highly rated school system, with many award-winning elementary, middle, and high schools. They focus on a student-centered approach to learning. Las Vegas's school system, by contrast, struggles with underfunding and overcrowding, although there are still many good schools in the area.
Las Vegas's economy is primarily driven by tourism, gaming, and entertainment, but the city has been diversifying into other industries like tech and health care. Rancho Cucamonga has a more balanced economy, with sectors such as healthcare, retail, and manufacturing making significant contributions.
Biggest Employers
In Las Vegas, the biggest employers are MGM Resorts, Caesars Entertainment, and Wynn Resorts. In contrast, the largest employers in Rancho Cucamonga include the Inland Empire Health Plan, Amphastar Pharmaceuticals, and the Chaffey Community College District.
There were 2,700 building permits issued in Las Vegas in 2012 (1886 more than in 2011) compared to 107 building permits issued in Rancho Cucamonga in 2012 (77 less than in 2011).
In Las Vegas (Clark County), 56.4% voted for Democrats and 41.8% for Republicans in 2012 Presidential Election. In Rancho Cucamonga (San Bernardino County), 52.3% voted for Democrats and 45.0% for Republicans.
Elections
Type
Democrats
Republicans
Other
Year
Las Vegas
Rancho Cucamonga
Las Vegas
Rancho Cucamonga
Las Vegas
Rancho Cucamonga
2020
53.7%
54.2%
44.3%
43.6%
2.0%
2.2%
2016
52.4%
52.1%
41.7%
41.5%
5.8%
6.4%
2012
56.4%
52.3%
41.8%
45.0%
1.8%
2.6%
2008
58.5%
52.2%
39.5%
45.8%
2.0%
2.0%
2004
51.8%
43.8%
46.9%
55.6%
1.3%
0.6%
2000
51.4%
47.3%
44.8%
48.8%
3.8%
3.9%
1996
75.5%
44.4%
18.8%
43.6%
5.7%
12.1%
Breakdown of population affiliated with a religious congregation
Type
Adherents
Congregations
Religion
Las Vegas
Rancho Cucamonga
Las Vegas
Rancho Cucamonga
CATHOLIC CHURCH
18.1%
21.9%
4.0%
4.3%
SOUTHERN BAPTIST CONVENTION
1.6%
2.2%
11.2%
9.6%
EVANGELICAL LUTHERAN CHURCH IN AMERICA
0.4%
0.2%
1.6%
1.5%
SEVENTH DAY ADVENTIST CHURCH
0.2%
1.6%
1.6%
4.6%
MUSLIM ESTIMATE
0.1%
0.6%
0.6%
1.1%
Weather
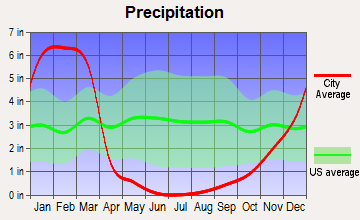
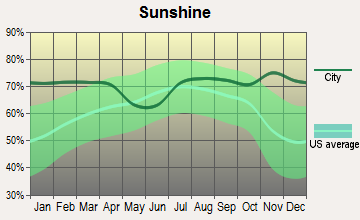
Climate in both cities varies greatly. Las Vegas is situated in a desert and has a hot desert climate with very long, hot summers and short, mild winters. Rancho Cucamonga, however, experiences a Mediterranean climate with hot, dry summers and cool, wet winters. Therefore, if you are looking for a cooler, more balanced climate, Rancho Cucamonga may be the better choice.
Weather and climate
Type
Las Vegas
Rancho Cucamonga
Temperature - Average
65.5°F
64.5°F
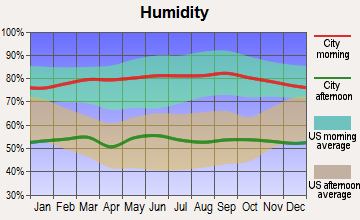
Humidity - Average morning or afternoon humidity
30.7%
65.2%
Humidity - Differences between morning and afternoon humidity
42%
20.1%
Humidity - Maximum monthly morning or afternoon humidity
52%
71.4%
Humidity - Minimum monthly morning or afternoon humidity
10%
51.3%
Precipitation - Yearly average
5.7 in
26.9 in
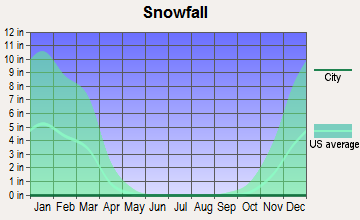
Snowfall - Yearly average
1.6 in
0 in
Clouds - Number of days clear of clouds
35.1%
27.6%
Sunshine amount - Average
91.8%
78.4%
Sunshine amount - Differences during a year
16%
21.8%
Sunshine amount - Maximum monthly
92%
84.7%
Sunshine amount - Minimum monthly
76%
62.9%
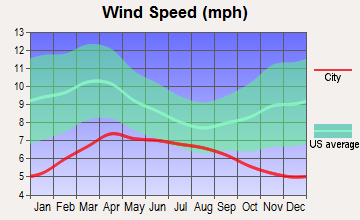
Wind speed - Average
9.2 mph
3.9 mph
Average climate in Las Vegas, Nevada
Average climate in Rancho Cucamonga, California
Air pollution
Type
AQI
CO
NO2
OZONE
PB
PM10
PM25
SO2
Year
Las Vegas
Rancho Cucamonga
Las Vegas
Rancho Cucamonga
Las Vegas
Rancho Cucamonga
Las Vegas
Rancho Cucamonga
Rancho Cucamonga
Las Vegas
Rancho Cucamonga
Las Vegas
Rancho Cucamonga
Las Vegas
Rancho Cucamonga
2018
100
152
0.42
0.37
13.1
15.5
37.2
29.0
0.006
N/A
24.4
34.7
6.0
15.3
0.7
0.4
2017
101
152
0.29
0.43
13.0
15.9
38.5
32.3
0.005
N/A
20.3
34.3
7.3
16.6
0.8
0.2
2016
97
140
0.38
0.39
11.2
16.7
36.5
32.3
0.006
N/A
20.6
28.4
8.7
16.9
0.8
0.4
2015
92
147
0.36
0.36
12.4
16.4
35.6
31.4
0.005
N/A
18.9
30.0
8.4
15.9
1.2
0.3
2014
91
146
0.40
0.36
10.8
17.3
36.5
29.6
0.006
N/A
21.1
32.2
9.2
17.4
1.4
0.3
2013
103
145
0.45
0.34
9.6
18.7
36.9
27.4
0.006
N/A
22.1
32.9
8.6
16.2
1.5
0.4
2012
94
147
0.49
0.38
5.9
19.7
38.5
28.6
0.006
N/A
21.5
33.4
8.3
18.2
1.4
0.6
2011
85
147
0.40
0.39
5.3
19.7
37.5
27.0
0.006
N/A
18.2
31.6
7.8
20.6
1.2
0.5
2010
86
146
0.50
0.40
5.7
20.5
36.6
28.3
0.008
N/A
16.1
29.0
7.1
18.7
N/A
1.0
2009
87
153
0.56
0.38
6.0
22.7
33.3
27.8
0.008
N/A
20.9
26.6
8.3
19.6
N/A
1.0
2008
82
161
0.66
0.45
8.2
22.5
33.0
28.3
0.009
N/A
N/A
30.4
9.2
18.2
N/A
1.5
2007
97
136
0.61
0.54
11.7
26.1
32.4
26.4
0.011
N/A
N/A
N/A
8.6
N/A
0.1
1.7
2006
102
125
0.75
0.60
13.4
29.2
32.7
26.1
0.007
N/A
N/A
N/A
8.3
N/A
0.8
1.8
2005
100
134
0.76
0.64
15.1
30.1
30.2
22.7
0.012
N/A
N/A
N/A
7.8
N/A
5.3
2.3
2004
85
139
0.71
0.68
16.0
29.1
30.6
23.3
0.012
N/A
N/A
N/A
N/A
N/A
1.6
1.3
2003
99
141
0.67
0.48
15.9
32.6
29.8
22.9
0.019
N/A
N/A
N/A
N/A
N/A
1.0
1.0
2002
94
137
0.73
0.39
15.7
34.9
30.6
23.0
0.018
N/A
N/A
N/A
N/A
N/A
0.7
1.1
2001
95
142
0.76
0.94
15.0
35.9
29.4
22.4
0.034
N/A
N/A
N/A
N/A
N/A
1.1
1.3
2000
95
153
0.88
0.99
14.7
36.6
29.7
22.2
0.038
N/A
N/A
N/A
N/A
N/A
0.4
1.9
Natural disasters
Type
Las Vegas
Rancho Cucamonga
Tornado activity compared to U.S. average
2.1%
17.5%
Earthquake activity compared to U.S. average
6,093.4%
7,430.7%
Natural disasters compared to U.S. average
12%
46%
Transportation
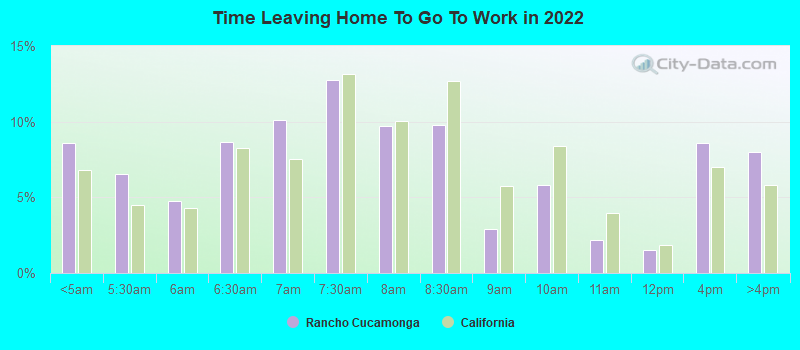
Both cities have well-developed transportation networks. Rancho Cucamonga has Metrolink train service for commuting to downtown Los Angeles, while Las Vegas has a comprehensive bus system and many taxis due to its tourist economy.
Transport
Type
Las Vegas
Rancho Cucamonga
Amtrak stations
1
0
Amtrak stations nearby
1
3
FAA registered aircraft
1
98
FAA registered aircraft manufacturers and dealers
81
4
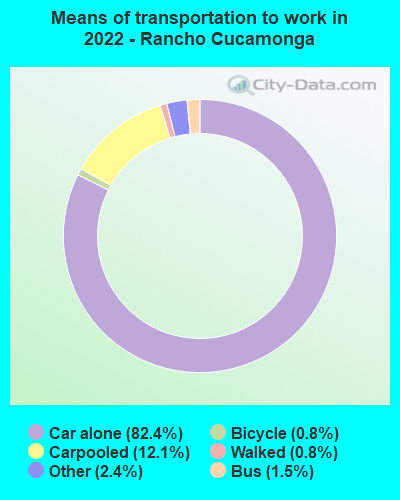
Means of transportation to work
Type
Las Vegas
Rancho Cucamonga
Bicycle
0.1%
0.2%
Bus
2.2%
0.8%
Carpooled
10.3%
11.4%
Car alone
82.7%
85.6%
Motorcycle
0.4%
0.2%
Railroad
0%
1%
Walked
1.4%
0.9%
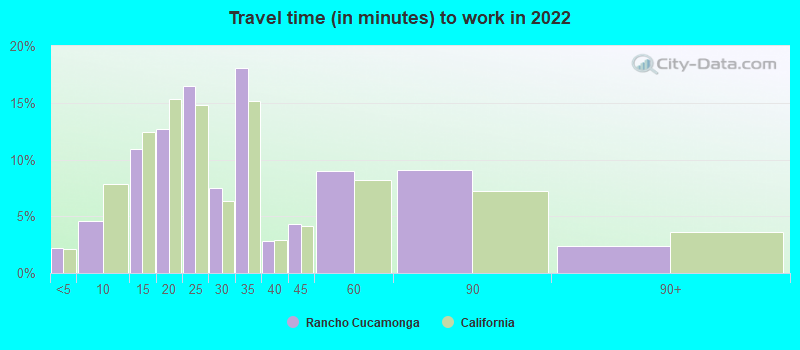
Average travel time to work
Type
Las Vegas
Rancho Cucamonga
Average
26.3 min
32.9 min
Other means
24 min
31.7 min
Public transportation
49.9 min
64 min
Private vehicle occupancy
Type
Las Vegas
Rancho Cucamonga
Average
1.2
1.2
Drove alone
88.9%
89.8%
In 2 person carpool
8.2%
7.2%
In 3 person carpool
2.1%
2%
In 4 person carpool
0.2%
0.7%
In 5-6 person carpool
0.4%
0.2%
In 7+ person carpool
0.2%
0.2%
How many people usually rode to work in the car, truck or van.
Real Estate
Compared to Rancho Cucamonga, the real estate market in Las Vegas is more affordable, with a variety of homes for different budgets. Rancho Cucamonga's real estate market is a bit more expensive due to its location within the Greater Los Angeles area.
Neighborhoods
Both Las Vegas and Rancho Cucamonga offer a variety of neighborhoods to suit everyone's lifestyle. Vegas offers everything from bustling downtown condos to quiet suburban homes, while Rancho Cucamonga is known for its well-planned communities with a suburban feel.
Houses and residents
Type
Las Vegas
Rancho Cucamonga
Houses
269,602
59,083
Average household size (people)
2.7
3
Median year apartment built
1991
1989
Median year house/condo built
1995
1986
Length of stay in the house since moving in
10.1 years
13.8 years
Houses occupied
250,350 (92.9%)
57,290 (97%)
Houses occupied by owners
138,677 (55.4%)
33,694 (58.8%)
Houses occupied by renters
111,673 (44.6%)
23,596 (41.2%)
Median rent asked for vacant for-rent units
$1,176
$1,222
Median monthly housing costs
$1,255
$2,005
Median price asked for vacant for-sale houses and condos
$989,410
$551,487
Estimated median house or condo value
$362,400
$632,700
Median numbers of rooms
5.2
5.7
Median number of rooms in apartments
4.1
4.1
Median number of rooms in houses and condos
6.1
6.5
Median house price - detached houses
$439,169
$726,916
Median house price - in 3-to-4-unit structures
$201,871
$405,195
Median house price - in 5 or more unit structures
$327,174
$821,505
Median house price - mobile homes
$113,235
$408,290
Median house price - Townhouses or other attached units
$274,961
$401,850
Median house price - All housing units
$417,434
$691,155
Median house age
27
33
Renting percentage
43.5%
35.2%
Housing density (houses/condos per square mile)
2,379.4
1,577.8
House value disparities
27.1%
22%
Household income disparities
47.1%
40.8%
Median household income for houses/condes with a mortgage
$90,388
$111,063
Median household income for apartments without a mortgage
$62,287
$79,041
Housing units without a mortgage
1,172 (1.2%)
452 (1.8%)
Housing units with both a second mortgage and home equity loan
4,450 (4.6%)
1,873 (7.6%)
Housing units with a mortgage
95,992 (98.8%)
24,110 (98.2%)
Housing units with a home equity loan
178 (0.2%)
205 (0.8%)
Housing units with a second mortgage
5,092 (5.2%)
2,544 (10.4%)
House/condo owner moved in on average (years ago)
7
13
House/condo renter moved in on average (years ago)
2
3
Housing units lacking complete kitchen facilities
1.3%
1.3%
Housing units lacking complete plumbing facilities
1%
0.5%
Housing units in structures
Housing units in structures
Las Vegas
Rancho Cucamonga
One, detached
61.5%
60.0%
One, attached
5.3%
8.0%
Two
1.3%
1.6%
3 or 4
7.7%
7.3%
5 to 9
8.4%
3.4%
10 to 19
4.8%
1.6%
20 to 49
2.8%
3.3%
50 or more
6.8%
12.9%
Mobile homes
1.4%
1.9%
Boats, RVs, vans, etc.
0.1%
0.0%
Median real estate property taxes paid for housing units
Self-employed workers in own not incorporated business
18,990
5,071
State government workers
6,950
2,611
Unpaid family workers
614
0
Industries and Occupations
While both cities are diverse, Las Vegas is especially known for occupations in the hospitality and entertainment sectors. Rancho Cucamonga focuses more on healthcare, education, and retail.
Both cities have excellent healthcare facilities available. Rancho Cucamonga is served by various highly ranked hospitals, and Las Vegas also offers high-quality medical care with many hospitals and clinics throughout the city.
Health (county statistics)
Type
Las Vegas
Rancho Cucamonga
General health status score of residents in this county from 1 (poor) to 5 (excellent)
Infrastructure in Las Vegas is well developed, thanks to its robust tourism industry. In Rancho Cucamonga, the infrastructure is more residential-focused, catering to the city's suburban lifestyle.
HMDA - Conventional home purchase loans - Applications denied
Year
Las Vegas
Rancho Cucamonga
1999
2,657
509
2000
579
326
2001
371
299
2002
380
361
2003
3,590
873
2004
5,908
1,152
2005
7,894
1,384
2006
6,914
1,318
2007
3,733
888
2008
1,431
357
2009
813
201
Culture and Food
Las Vegas is known for its vibrant nightlife, world-class entertainment, and diverse culinary scene. Meanwhile, Rancho Cucamonga, while quieter, has a growing food and wine scene, particularly in the historic downtown area.
Sports Teams
Las Vegas has recently become a sports hub, being home to the Las Vegas Raiders (NFL) and the Vegas Golden Knights (NHL). Rancho Cucamonga, while lacking major league teams, is home to the Rancho Cucamonga Quakes, a minor league baseball team.


 Las Vegas, NV
 Rancho Cucamonga, CA