Relative area comparison
 Las Vegas, NV
 South Antelope Valley, CA
 Las Vegas, NV and
South Antelope Valley, CA : 198.3 miles
Las Vegas, NV and
South Antelope Valley, CA : 198.3 miles
Las Vegas's population is larger by 277%. Its population has grown by 168,356 people (35.2%) since 2000.
| Population | ||
| Type | Las Vegas | South Antelope Valley |
|---|---|---|
| Population | 646,790 | 171,490 |
| Female / male percentage | 49.6% / 50.4%
|
50.3% / 49.7%
|
| Income | ||
| Type | Las Vegas | South Antelope Valley |
|---|---|---|
| Estimated median household income | $59,746 | $93,491 |
| Estimated per capita income | $33,825 | $35,012 |
| Cost of living index (U.S. average is 100) | 99.1 | 139.6 |
If you make $50,000 in Las Vegas, you will have to make $70,434 in South Antelope Valley to maintain the same standard of living.
| Geographical information | ||
| Type | Las Vegas | South Antelope Valley |
|---|---|---|
| Land area | 113.3 sq. miles | 1,187.8 sq. miles |
| Population density | 5,708.4 people per sq. mile | 144.4 people per sq. mile |
Las Vegas, NV
South Antelope Valley, CA
| Education level (25-year-olds and older) | ||
| Type | Las Vegas | South Antelope Valley |
|---|---|---|
| Bachelor's degree or higher | 27.6% | 14.7% |
| Graduate or professional degree | 10.1% | 4.5% |
| High school or higher | 85.4% | 76.7% |
In Las Vegas (Clark County), 56.4% voted for Democrats and 41.8% for Republicans in 2012 Presidential Election. In South Antelope Valley (Los Angeles County), 69.7% voted for Democrats and 27.8% for Republicans.
| Weather and climate | ||
| Type | Las Vegas | South Antelope Valley |
|---|---|---|
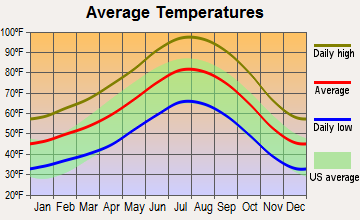
| Temperature - Average | 65.5°F | 62.8°F |
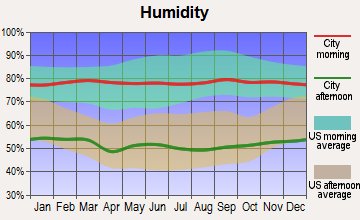
| Humidity - Average morning or afternoon humidity | 30.7% | 62.6% |
| Humidity - Differences between morning and afternoon humidity | 42% | 17% |
| Humidity - Maximum monthly morning or afternoon humidity | 52% | 67.4% |
| Humidity - Minimum monthly morning or afternoon humidity | 10% | 50.4% |
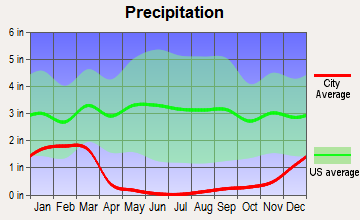
| Precipitation - Yearly average | 5.7 in | 8.3 in |
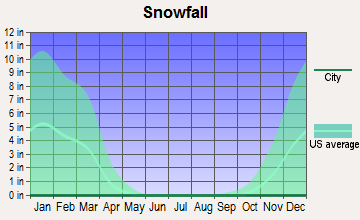
| Snowfall - Yearly average | 1.6 in | 0 in |
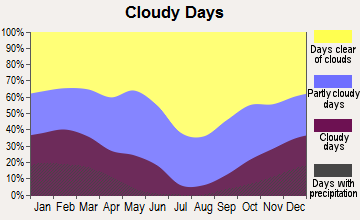
| Clouds - Number of days clear of clouds | 35.1% | 28.4% |
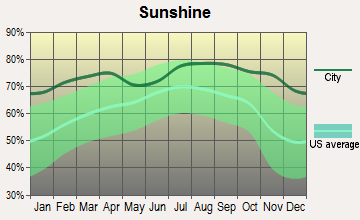
| Sunshine amount - Average | 91.8% | 78.4% |
| Sunshine amount - Differences during a year | 16% | 21.9% |
| Sunshine amount - Maximum monthly | 92% | 84.9% |
| Sunshine amount - Minimum monthly | 76% | 63% |
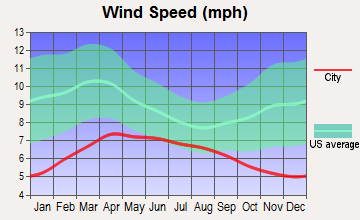
| Wind speed - Average | 9.2 mph | 3 mph |
| Natural disasters | ||
| Type | Las Vegas | South Antelope Valley |
|---|---|---|
| Tornado activity compared to U.S. average | 2.1% | 13.5% |
| Earthquake activity compared to U.S. average | 6,093.4% | 7,590.6% |
| Natural disasters compared to U.S. average | 12% | 57% |
| Transport | ||
| Type | Las Vegas | South Antelope Valley |
|---|---|---|
| Amtrak stations | 1 | 0 |
| Amtrak stations nearby | 1 | 2 |
| FAA registered aircraft | 1 | 0 |
| FAA registered aircraft manufacturers and dealers | 81 | 0 |
| Means of transportation to work | ||
| Type | Las Vegas | South Antelope Valley |
|---|---|---|
| Bicycle | 0.1% | 0.2% |
| Bus | 2.2% | 1.5% |
| Carpooled | 10.3% | 20.6% |
| Car alone | 82.7% | 71.7% |
| Motorcycle | 0.4% | 0.3% |
| Railroad | 0% | 0.7% |
| Walked | 1.4% | 0.8% |
| Average travel time to work | ||
| Type | Las Vegas | South Antelope Valley |
|---|---|---|
| Average | 26.3 min | 42.6 min |
| Houses and residents | ||
| Type | Las Vegas | South Antelope Valley |
|---|---|---|
| Houses | 269,602 | 55,065 |
| Average household size (people) | 2.7 | 3.4 |
| Houses occupied | 250,350 (92.9%) | 50,690 (92.1%) |
| Houses occupied by owners | 138,677 (55.4%) | 37,922 (74.8%) |
| Houses occupied by renters | 111,673 (44.6%) | 12,768 (25.2%) |
| Median rent asked for vacant for-rent units | $1,176 | $1,240 |
| Median price asked for vacant for-sale houses and condos | $989,410 | $1,138,428 |
| Estimated median house or condo value | $362,400 | $457,787 |
| Median number of rooms in apartments | 4.1 | 4.9 |
| Median number of rooms in houses and condos | 6.1 | 7.1 |
| Renting percentage | 43.5% | 28.4% |
| Housing density (houses/condos per square mile) | 2,379.4 | 46.4 |
| Household income disparities | 47.1% | 40.2% |
| Housing units without a mortgage | 1,172 (1.2%) | 3,586 (10.7%) |
| Housing units with both a second mortgage and home equity loan | 4,450 (4.6%) | 80 (0.2%) |
| Housing units with a mortgage | 95,992 (98.8%) | 30,054 (89.3%) |
| Housing units with a home equity loan | 178 (0.2%) | 1,716 (5.1%) |
| Housing units with a second mortgage | 5,092 (5.2%) | 5,170 (15.4%) |
| Housing units lacking complete kitchen facilities | 1.3% | 1.7% |
| Housing units lacking complete plumbing facilities | 1% | 1.5% |
| Health (county statistics) | ||
| Type | Las Vegas | South Antelope Valley |
|---|---|---|
| General health status score of residents in this county from 1 (poor) to 5 (excellent) | 3.4 | 3.5 |
| Average weight of females (lbs) | 160.2 lbs | 154.6 lbs |
| Average weight of males (lbs) | 194.9 lbs | 185 lbs |
| Residents visited a dentist within the past year | 64% | 68.1% |
| Residents exercised in the past month | 72.3% | 74.7% |
| Residents keep firearms around their homes | 31.5% | 12.9% |
| Adult residents drank alcohol in the past 30 days | 71.5% | 69.2% |
| Residents smoked 100+ cigarettes in their lives | 50.6% | 37.8% |
| Infrastructure | ||
| Type | Las Vegas | South Antelope Valley |
|---|---|---|
| TV stations | 12 | 20 |