Las Vegas, Nevada, and South Aurora, Colorado, both offer their unique characteristics that make them quite distinctive. Las Vegas is well-known for its vibrant entertainment scenes and strong hospitality industry, while South Aurora is admired for its family-friendly environment and relatively lower cost of living. Various factors such as crime and safety, weather, educational resources, economic strength, accessibility, local culture, and healthcare facilities influence the quality of living in these two cities.
Las Vegas has a higher crime rate than South Aurora, largely related to its high tourism footprint and lively nightlife. However, most of these crimes are confined to some specific areas and are mostly non-violent. On the other hand, South Aurora is generally safer with lower crime rates, making it suitable for families and individuals seeking a secure and peaceful environment.
Cost of Living
The cost of living in Las Vegas is generally lower than in South Aurora. This is due primarily to lower housing cost and relatively low taxes. South Aurora's cost of living is above national average, mainly tied to the higher real-estate prices and cost associated with goods and services.
Income Tax
One of the major benefits of living in Las Vegas is Nevada’s lack of state income tax. Colorado, on the other hand, has a flat rate state income tax, affecting the residents of South Aurora.
Property Tax
Property taxes in both cities are relatively low compared to the national average. However, South Aurora's property tax is somewhat higher than that of Las Vegas.
Sales Tax
Nevada’s sales tax is higher than Colorado’s, and Las Vegas has additional local tax. South Aurora benefits from Colorado’s relatively low sales tax rates.
Income
Type
Las Vegas
South Aurora
Estimated median household income
$59,746
$80,212
Estimated per capita income
$33,825
$39,129
Cost of living index (U.S. average is 100)
99.1
110.1
If you make $50,000 in Las Vegas, you will have to make $55,550 in South Aurora to maintain the same standard of living.
Geographical Conditions
Las Vegas is in a desert region with surrounding mountains while South Aurora is on the Eastern Plains with a view of the Rocky Mountains in the distance. Topography preferences are subjective and would likely depend on personal taste.
Geographical information
Type
Las Vegas
South Aurora
Land area
113.3 sq. miles
78.4 sq. miles
Population density
5,708.4 people per sq. mile
4,199.1 people per sq. mile
Relative area comparison
Las Vegas, NV South Aurora, CO
Education
South Aurora provides a higher grade of education with low student to teacher ratio and well-regarded school districts. Las Vegas schools, though improving, historically lag behind national averages.
Las Vegas' economy is strongly tied to the hospitality and entertainment industry, providing abundant job opportunities in these sectors. South Aurora, being part of the Denver/Aurora metropolitan area, has a more diversified economy with job opportunities in healthcare, tech, and educational sectors.
Biggest Employers
In Las Vegas, the biggest employers are typically the MGM Resorts International and Caesars Entertainment. In South Aurora, top employers include UCHealth, Raytheon, and Cherry Creek Schools.
In Las Vegas (Clark County), 56.4% voted for Democrats and 41.8% for Republicans in 2012 Presidential Election. In South Aurora (Arapahoe County), 54.4% voted for Democrats and 44.4% for Republicans.
Elections
Type
Democrats
Republicans
Other
Year
Las Vegas
South Aurora
Las Vegas
South Aurora
Las Vegas
South Aurora
2020
53.7%
61.3%
44.3%
36.6%
2.0%
2.1%
2016
52.4%
53.1%
41.7%
38.9%
5.8%
8.1%
2012
56.4%
54.4%
41.8%
44.4%
1.8%
1.3%
2008
58.5%
56.0%
39.5%
43.0%
2.0%
1.0%
2004
51.8%
47.6%
46.9%
51.6%
1.3%
0.8%
2000
51.4%
43.6%
44.8%
51.6%
3.8%
4.8%
1996
75.5%
41.9%
18.8%
50.8%
5.7%
7.3%
Breakdown of population affiliated with a religious congregation
Type
Adherents
Congregations
Religion
Las Vegas
South Aurora
Las Vegas
South Aurora
CATHOLIC CHURCH
18.1%
12.1%
4.0%
4.3%
SOUTHERN BAPTIST CONVENTION
1.6%
1.6%
11.2%
9.9%
EVANGELICAL LUTHERAN CHURCH IN AMERICA
0.4%
2.0%
1.6%
4.3%
LUTHERAN CHURCH
0.2%
1.0%
1.2%
2.6%
EPISCOPAL CHURCH
0.1%
0.4%
1.1%
1.7%
MUSLIM ESTIMATE
0.1%
1.9%
0.6%
1.0%
Weather
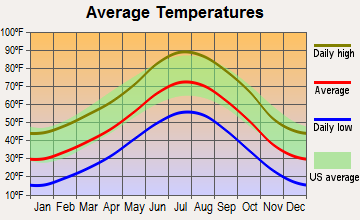
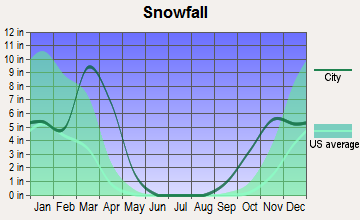
Las Vegas is known for its desert climate with very hot summers and mild winters. South Aurora experiences a semi-arid climate with four distinct seasons including snowy winters and warm summers. Weather preference would depend on personal likings, but those who enjoy ski activities or dislike extreme summer heat may prefer Aurora over Las Vegas.
Weather and climate
Type
Las Vegas
South Aurora
Temperature - Average
65.5°F
49.9°F
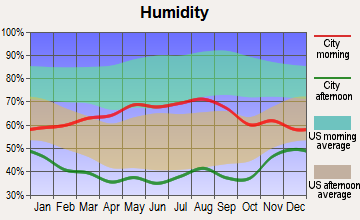
Humidity - Average morning or afternoon humidity
30.7%
50.6%
Humidity - Differences between morning and afternoon humidity
42%
20%
Humidity - Maximum monthly morning or afternoon humidity
52%
55%
Humidity - Minimum monthly morning or afternoon humidity
10%
35%
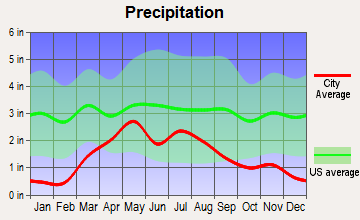
Precipitation - Yearly average
5.7 in
17.6 in
Snowfall - Yearly average
1.6 in
114 in
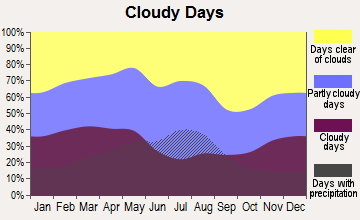
Clouds - Number of days clear of clouds
35.1%
19.2%
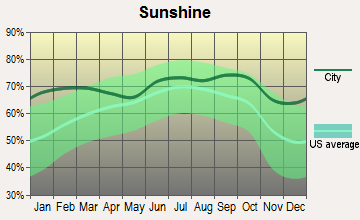
Sunshine amount - Average
91.8%
75.6%
Sunshine amount - Differences during a year
16%
10%
Sunshine amount - Maximum monthly
92%
74%
Sunshine amount - Minimum monthly
76%
64%
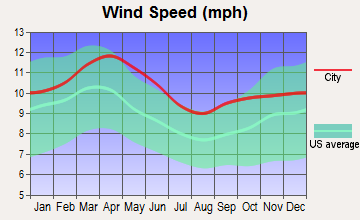
Wind speed - Average
9.2 mph
8.6 mph
Average climate in Las Vegas, Nevada
Average climate in South Aurora, Colorado
Air pollution
Type
AQI
CO
NO2
OZONE
PB
PM10
PM25
SO2
Year
Las Vegas
South Aurora
Las Vegas
South Aurora
Las Vegas
South Aurora
Las Vegas
South Aurora
South Aurora
Las Vegas
South Aurora
Las Vegas
South Aurora
Las Vegas
South Aurora
2018
100
99
0.42
0.37
13.1
21.6
37.2
31.9
N/A
N/A
24.4
29.2
6.0
8.5
0.7
0.7
2017
101
95
0.29
0.37
13.0
22.0
38.5
31.8
N/A
N/A
20.3
22.0
7.3
8.4
0.8
0.9
2016
97
90
0.38
0.43
11.2
24.0
36.5
31.3
N/A
N/A
20.6
22.6
8.7
8.1
0.8
1.0
2015
92
101
0.36
0.44
12.4
23.0
35.6
30.2
N/A
N/A
18.9
20.6
8.4
9.6
1.2
1.1
2014
91
94
0.40
0.43
10.8
22.0
36.5
30.3
N/A
N/A
21.1
22.7
9.2
10.1
1.4
1.3
2013
103
84
0.45
0.39
9.6
19.7
36.9
30.7
N/A
N/A
22.1
22.0
8.6
N/A
1.5
1.4
2012
94
90
0.49
0.34
5.9
18.9
38.5
31.4
N/A
N/A
21.5
24.3
8.3
N/A
1.4
1.2
2011
85
91
0.40
0.34
5.3
18.1
37.5
31.5
N/A
N/A
18.2
23.8
7.8
N/A
1.2
1.5
2010
86
81
0.50
0.41
5.7
16.3
36.6
29.3
N/A
N/A
16.1
26.6
7.1
N/A
N/A
1.0
2009
87
79
0.56
0.37
6.0
14.1
33.3
27.3
0.005
N/A
20.9
22.6
8.3
N/A
N/A
1.3
2008
82
85
0.66
0.41
8.2
17.3
33.0
29.1
0.008
N/A
N/A
25.5
9.2
N/A
N/A
1.6
2007
97
96
0.61
0.41
11.7
20.6
32.4
25.7
0.007
N/A
N/A
28.9
8.6
N/A
0.1
1.2
2006
102
89
0.75
0.50
13.4
19.0
32.7
25.4
0.026
N/A
N/A
28.0
8.3
N/A
0.8
1.4
2005
100
86
0.76
0.57
15.1
21.3
30.2
22.7
0.106
N/A
N/A
29.6
7.8
N/A
5.3
1.5
2004
85
82
0.71
0.61
16.0
21.2
30.6
21.6
0.035
N/A
N/A
28.6
N/A
N/A
1.6
1.8
2003
99
106
0.67
0.61
15.9
21.2
29.8
23.4
0.038
N/A
N/A
32.6
N/A
N/A
1.0
1.9
2002
94
86
0.73
0.64
15.7
19.2
30.6
23.0
0.027
N/A
N/A
35.7
N/A
N/A
0.7
2.5
2001
95
95
0.76
0.79
15.0
23.8
29.4
20.8
0.029
N/A
N/A
32.6
N/A
N/A
1.1
2.6
2000
95
93
0.88
0.77
14.7
13.7
29.7
21.7
0.032
N/A
N/A
12.2
N/A
N/A
0.4
2.1
Natural disasters
Type
Las Vegas
South Aurora
Tornado activity compared to U.S. average
2.1%
137.7%
Earthquake activity compared to U.S. average
6,093.4%
797.1%
Natural disasters compared to U.S. average
12%
10%
Transportation
Public transportation in both cities is convenient, but Las Vegas offers monorail and tram services specially geared towards tourists. South Aurora benefits from Denver's Light Rail system, which makes commuting easier for both residents and visitors.
Transport
Type
Las Vegas
South Aurora
Amtrak stations
1
0
Amtrak stations nearby
1
2
FAA registered aircraft
1
0
FAA registered aircraft manufacturers and dealers
81
0
Means of transportation to work
Type
Las Vegas
South Aurora
Bicycle
0.1%
0.2%
Bus
2.2%
3.5%
Carpooled
10.3%
12%
Car alone
82.7%
78.6%
Motorcycle
0.4%
0.1%
Walked
1.4%
1.3%
Average travel time to work
Type
Las Vegas
South Aurora
Average
26.3 min
27.5 min
Real Estate
Real estate prices in Las Vegas are generally lower than in South Aurora. While Las Vegas offers a wide variety of properties, South Aurora is more residential with many homes nestled in quiet, family-friendly neighborhoods.
Neighborhoods
Las Vegas boasts eclectic neighborhoods, from those that offer breathtaking views of the Strip to those that offer serene desert landscapes. South Aurora's neighborhoods are more suburban, suitable for those who prefer quieter, more family-oriented communities.
Houses and residents
Type
Las Vegas
South Aurora
Houses
269,602
119,373
Average household size (people)
2.7
2.6
Houses occupied
250,350 (92.9%)
115,977 (97.2%)
Houses occupied by owners
138,677 (55.4%)
76,163 (65.7%)
Houses occupied by renters
111,673 (44.6%)
39,814 (34.3%)
Median rent asked for vacant for-rent units
$1,176
$1,519
Median price asked for vacant for-sale houses and condos
$989,410
$836,561
Estimated median house or condo value
$362,400
$439,151
Median number of rooms in apartments
4.1
3.9
Median number of rooms in houses and condos
6.1
7.2
Renting percentage
43.5%
38.4%
Housing density (houses/condos per square mile)
2,379.4
1,522.9
Household income disparities
47.1%
40.8%
Housing units without a mortgage
1,172 (1.2%)
6,903 (10.6%)
Housing units with both a second mortgage and home equity loan
4,450 (4.6%)
358 (0.6%)
Housing units with a mortgage
95,992 (98.8%)
57,942 (89.4%)
Housing units with a home equity loan
178 (0.2%)
5,373 (8.3%)
Housing units with a second mortgage
5,092 (5.2%)
10,116 (15.6%)
Housing units lacking complete kitchen facilities
1.3%
0.4%
Housing units lacking complete plumbing facilities
Self-employed workers in own not incorporated business
18,990
8,665
State government workers
6,950
4,200
Unpaid family workers
614
351
Industries and Occupations
In Las Vegas, the prominent industries are hospitality, tourism, and entertainment. In South Aurora, the leading industries are healthcare, aerospace, technology, construction, and education.
Both cities have their healthcare strengths, with Las Vegas offering numerous health centers and specialty hospitals. In South Aurora, notable healthcare facilities include the UCHealth University of Colorado Hospital and Children's Hospital Colorado.
Health (county statistics)
Type
Las Vegas
South Aurora
General health status score of residents in this county from 1 (poor) to 5 (excellent)
Las Vegas' infrastructure is largely designed to accommodate tourism, with world-class hotels, casinos, and entertainment facilities. South Aurora's infrastructure caters more to residents with easy access to parks, trails, and shopping centers.
Infrastructure
Type
Las Vegas
South Aurora
TV stations
12
14
Culture and Food
Las Vegas is famous globally for its vibrant nightlife, diverse food options, and prevalent entertainment culture. South Aurora offers a more laid-back atmosphere with a mix of cuisines reflective of its diverse population.
Sports Teams
Las Vegas hosts professional sports teams like the Vegas Golden Knights (NHL) and Las Vegas Raiders (NFL). Residents of South Aurora can support Denver's professional sports teams, including the Broncos (NFL), Nuggets (NBA), Rockies (MLB), and Avalanche (NHL).
 Las Vegas, NV
 South Aurora, CO