The comparison between living in Las Vegas, Nevada, and the South Coast, California, involves looking at different factors. These include crime rates, weather conditions, cost of living, quality of education, job opportunities, and the local economy. Other considerations are infrastructure, dominant industries, major employers, real estate market, neighborhoods, transportation, taxes, local culture, sports teams, geographical conditions, and health care.
Las Vegas has a higher crime rate compared to the national average, with property crimes being more frequent than violent offenses. On the other hand, the South Coast of California generally has lower crime rates, although this depends on the specific area. Both Las Vegas and the South Coast have made efforts to improve safety for both residents and tourists.
Cost of Living
The cost of living in Las Vegas is generally lower than in South Coast, California. Housing in Las Vegas is more affordable, and the overall living expenses including healthcare, groceries, and utilities are lower.
Income Tax
Nevada, including Las Vegas, has no state income tax, which is a significant financial incentive for many. California has one of the highest state income taxes in the nation, affecting the South Coast residents.
Property Tax
Las Vegas residents enjoy lower property taxes compared to many parts of the country. The South Coast's property tax is higher, but it supports the high quality of public services in the region.
Sales Tax
Las Vegas has a higher sales tax rate than the South Coast, which can affect everyday costs. On the contrary, South Coast’s sales tax is comparatively lower, but the cost of living tends to offset the advantage.
Income
Type
Las Vegas
South Coast
Estimated median household income
$59,746
$112,870
Estimated per capita income
$33,825
$68,453
Cost of living index (U.S. average is 100)
99.1
96.8
If you make $50,000 in South Coast, you will have to make $51,188 in Las Vegas to maintain the same standard of living.
Geographical Conditions
Las Vegas is in a basin within the Mojave Desert with mountains surrounding the city. The South Coast spans picturesque beach towns and agricultural areas, with a combination of mountains, valleys, and the Pacific coastline.
Geographical information
Type
Las Vegas
South Coast
Land area
113.3 sq. miles
101 sq. miles
Population density
5,708.4 people per sq. mile
2,953.2 people per sq. mile
Relative area comparison
Las Vegas, NV South Coast, CA
Education
Las Vegas has a mix of public and private schools, and several colleges and universities. The South Coast offers a rich tapestry of educational excellence, with top-ranking public and private K-12 schools, colleges, and universities—some of which are known internationally.
Las Vegas's economy thrives on tourism, hospitality, and entertainment. South Coast also benefits from tourism, but agriculture, tech industry, and health care are primary drivers of its economic engine.
Biggest Employers
The largest employers in Las Vegas include MGM Resorts International and Caesars Entertainment. Meanwhile, the University of California and various tech companies are major employers in the South Coast.
In Las Vegas (Clark County), 56.4% voted for Democrats and 41.8% for Republicans in 2012 Presidential Election. In South Coast (Orange County), 45.8% voted for Democrats and 52.0% for Republicans.
Elections
Type
Democrats
Republicans
Other
Year
Las Vegas
South Coast
Las Vegas
South Coast
Las Vegas
South Coast
2020
53.7%
53.6%
44.3%
44.6%
2.0%
1.8%
2016
52.4%
50.9%
41.7%
42.4%
5.8%
6.7%
2012
56.4%
45.8%
41.8%
52.0%
1.8%
2.3%
2008
58.5%
47.8%
39.5%
50.3%
2.0%
1.9%
2004
51.8%
39.3%
46.9%
60.2%
1.3%
0.5%
2000
51.4%
40.4%
44.8%
55.9%
3.8%
3.7%
1996
75.5%
37.9%
18.8%
51.7%
5.7%
10.5%
Breakdown of population affiliated with a religious congregation
Type
Adherents
Congregations
Religion
Las Vegas
South Coast
Las Vegas
South Coast
CATHOLIC CHURCH
18.1%
26.5%
4.0%
4.4%
SOUTHERN BAPTIST CONVENTION
1.6%
2.3%
11.2%
8.8%
EVANGELICAL LUTHERAN CHURCH IN AMERICA
0.4%
0.4%
1.6%
2.3%
LUTHERAN CHURCH
0.2%
0.6%
1.2%
2.0%
SEVENTH DAY ADVENTIST CHURCH
0.2%
0.4%
1.6%
1.3%
EPISCOPAL CHURCH
0.1%
0.4%
1.1%
1.4%
MUSLIM ESTIMATE
0.1%
0.8%
0.6%
1.3%
REFORMED CHURCH IN AMERICA
0.0%
0.3%
0.0%
0.2%
Weather
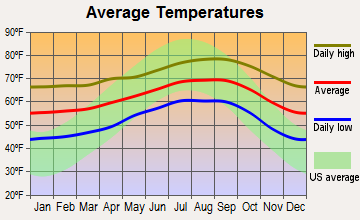
Las Vegas witnesses a desert climate with extreme summer heat and mild winters. The South Coast, set along the Pacific Ocean, enjoys a Mediterranean climate with warm summers and cool winters.
Weather and climate
Type
Las Vegas
South Coast
Temperature - Average
65.5°F
62.1°F
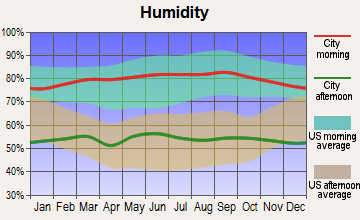
Humidity - Average morning or afternoon humidity
30.7%
69.1%
Humidity - Differences between morning and afternoon humidity
42%
24.6%
Humidity - Maximum monthly morning or afternoon humidity
52%
77%
Humidity - Minimum monthly morning or afternoon humidity
10%
52.4%
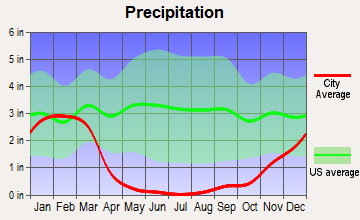
Precipitation - Yearly average
5.7 in
13.4 in
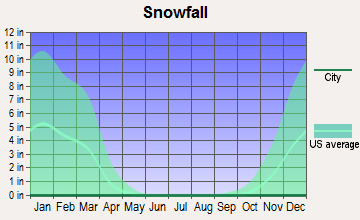
Snowfall - Yearly average
1.6 in
0 in
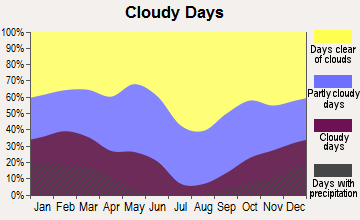
Clouds - Number of days clear of clouds
35.1%
26.7%
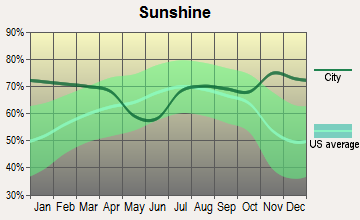
Sunshine amount - Average
91.8%
77.6%
Sunshine amount - Differences during a year
16%
20.5%
Sunshine amount - Maximum monthly
92%
81.9%
Sunshine amount - Minimum monthly
76%
61.4%
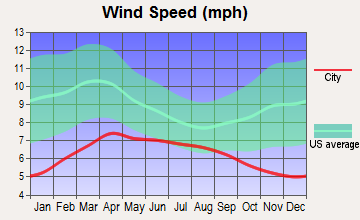
Wind speed - Average
9.2 mph
5.5 mph
Average climate in Las Vegas, Nevada
Average climate in South Coast, California
Air pollution
Type
AQI
CO
NO2
OZONE
PM10
PM25
SO2
Year
Las Vegas
South Coast
Las Vegas
South Coast
Las Vegas
South Coast
Las Vegas
South Coast
Las Vegas
South Coast
Las Vegas
South Coast
Las Vegas
South Coast
2018
100
105
0.42
0.18
13.1
8.6
37.2
34.0
24.4
22.7
6.0
7.0
0.7
N/A
2017
101
111
0.29
0.21
13.0
8.4
38.5
34.7
20.3
23.0
7.3
11.3
0.8
N/A
2016
97
105
0.38
0.14
11.2
9.6
36.5
33.8
20.6
21.9
8.7
9.8
0.8
0.1
2015
92
111
0.36
0.10
12.4
10.5
35.6
32.9
18.9
19.4
8.4
10.5
1.2
0.1
2014
91
100
0.40
0.11
10.8
9.8
36.5
31.3
21.1
25.4
9.2
11.8
1.4
0.3
2013
103
97
0.45
0.17
9.6
10.6
36.9
30.0
22.1
24.5
8.6
10.3
1.5
0.2
2012
94
101
0.49
0.26
5.9
10.1
38.5
29.9
21.5
21.5
8.3
10.5
1.4
0.1
2011
85
113
0.40
0.15
5.3
10.2
37.5
30.3
18.2
24.0
7.8
10.9
1.2
0.3
2010
86
101
0.50
0.21
5.7
10.9
36.6
30.6
16.1
23.3
7.1
11.4
N/A
0.6
2009
87
120
0.56
0.15
6.0
13.0
33.3
31.5
20.9
27.3
8.3
12.4
N/A
1.1
2008
82
131
0.66
0.26
8.2
13.2
33.0
32.0
N/A
38.8
9.2
9.4
N/A
1.1
2007
97
110
0.61
0.24
11.7
13.7
32.4
30.6
N/A
N/A
8.6
N/A
0.1
0.8
2006
102
112
0.75
0.30
13.4
14.8
32.7
30.6
N/A
N/A
8.3
N/A
0.8
1.3
2005
100
109
0.76
0.28
15.1
13.7
30.2
29.9
N/A
N/A
7.8
N/A
5.3
1.3
2004
85
130
0.71
0.29
16.0
15.5
30.6
32.5
N/A
N/A
N/A
N/A
1.6
1.6
2003
99
132
0.67
0.38
15.9
18.2
29.8
31.3
N/A
N/A
N/A
N/A
1.0
1.1
2002
94
129
0.73
0.40
15.7
17.7
30.6
28.4
N/A
N/A
N/A
N/A
0.7
1.6
2001
95
137
0.76
0.52
15.0
18.5
29.4
27.8
N/A
N/A
N/A
N/A
1.1
1.4
2000
95
140
0.88
0.52
14.7
21.2
29.7
24.5
N/A
N/A
N/A
N/A
0.4
1.9
Natural disasters
Type
Las Vegas
South Coast
Tornado activity compared to U.S. average
2.1%
17.1%
Earthquake activity compared to U.S. average
6,093.4%
6,728.5%
Natural disasters compared to U.S. average
12%
32%
Transportation
Las Vegas is car-dependent, though there is public transportation through bus services. South Coast provides various transportation options ranging from buses and trains to ferries.
Transport
Type
Las Vegas
South Coast
Amtrak stations
1
0
Amtrak stations nearby
1
3
FAA registered aircraft
1
0
FAA registered aircraft manufacturers and dealers
81
0
Means of transportation to work
Type
Las Vegas
South Coast
Bicycle
0.1%
0.3%
Bus
2.2%
1%
Carpooled
10.3%
10.5%
Car alone
82.7%
79.2%
Motorcycle
0.4%
0.2%
Railroad
0%
0.4%
Walked
1.4%
1.7%
Average travel time to work
Type
Las Vegas
South Coast
Average
26.3 min
27.9 min
Real Estate
Real estate in Las Vegas is cheaper than in the South Coast, with a variety of homes available for different budgets. However, South Coast properties can be a substantial investment as they tend to hold their value well.
Neighborhoods
Las Vegas offers a variety of neighborhoods from trendy downtown spots to serene suburban communities. The South Coast is known for its picturesque coastal towns, upscale suburbs, and beachfront properties.
Houses and residents
Type
Las Vegas
South Coast
Houses
269,602
124,031
Average household size (people)
2.7
2.5
Houses occupied
250,350 (92.9%)
117,093 (94.4%)
Houses occupied by owners
138,677 (55.4%)
81,601 (69.7%)
Houses occupied by renters
111,673 (44.6%)
35,492 (30.3%)
Median rent asked for vacant for-rent units
$1,176
$2,718
Median price asked for vacant for-sale houses and condos
$989,410
$1,099,558
Estimated median house or condo value
$362,400
Over $1,000,000
Median number of rooms in apartments
4.1
3.9
Median number of rooms in houses and condos
6.1
5.1
Renting percentage
43.5%
33.8%
Housing density (houses/condos per square mile)
2,379.4
1,227.5
Household income disparities
47.1%
38.1%
Housing units without a mortgage
1,172 (1.2%)
10,715 (16.4%)
Housing units with both a second mortgage and home equity loan
4,450 (4.6%)
248 (0.4%)
Housing units with a mortgage
95,992 (98.8%)
54,674 (83.6%)
Housing units with a home equity loan
178 (0.2%)
5,859 (9%)
Housing units with a second mortgage
5,092 (5.2%)
7,560 (11.6%)
Housing units lacking complete kitchen facilities
1.3%
0.8%
Housing units lacking complete plumbing facilities
Self-employed workers in own not incorporated business
18,990
17,244
State government workers
6,950
4,403
Unpaid family workers
614
640
Industries and Occupations
The dominant industries in Las Vegas are hospitality and entertainment, while the South Coast exhibits a more diversified economy with agriculture, technology, education, and healthcare taking center-stage.
Las Vegas has numerous hospitals and health centers, though it ranks lower than California in healthcare. South Coast stands tall with top-rated hospitals and specialty care facilities.
Health (county statistics)
Type
Las Vegas
South Coast
General health status score of residents in this county from 1 (poor) to 5 (excellent)
Infrastructure in Las Vegas is relatively good, with ongoing developments. The South Coast boasts of top-notch infrastructure, including excellent public utilities, world-class airports, and well-maintained roads.
Infrastructure
Type
Las Vegas
South Coast
TV stations
12
1
Nuclear power plants nearby
0
2
Culture and Food
Las Vegas, renowned for its vibrant nightlife and entertainment scene, also boasts a diverse food culture. South Coast offers rich cultural experiences and a vibrant culinary scene with a strong emphasis on fresh, local produce.
Sports Teams
Las Vegas is home to several professional sports teams like the Raiders (NFL) and Golden Knights (NHL). South Coast hosts a variety of sports teams, including those from Los Angeles - Lakers (NBA), Rams (NFL), and Chargers (NFL).
 Las Vegas, NV
 South Coast, CA