Las Vegas and Spring Valley, both located in Nevada, provide contrasting living experiences, even though they are only a short drive apart. Las Vegas is a bustling city known for its vibrant nightlife, while Spring Valley provides a somewhat quieter suburban lifestyle. This comparison should help potential residents or tourists make an informed decision about which location suits them best, considering factors like crime and safety, weather, cost of living, and work opportunities.
Distance between
Las Vegas, NV and
Spring Valley, NV : 5.9 miles
Las Vegas's population is larger by 203%. Its population has grown by 168,356 people (35.2%) since 2000. The population of Spring Valley has grown by 96,162 people (81.9%) during that time.
Regarding crime and safety, Las Vegas, as a major city and tourism hotspot, has a higher crime rate compared to Spring Valley. Violent crime is relatively more prevalent in Las Vegas, which could be attributed to high tourist footfall, nightlife, and several gambling establishments. On the other hand, Spring Valley has a lower crime rate and is generally considered safer, with crime mainly limited to property-related incidents.
Cost of Living
The cost of living in Las Vegas is generally higher than in Spring Valley. Housing, groceries, and health care are some sectors where the cost differential is noticeable. Conversely, Spring Valley presents a more affordable living environment with lower accommodation costs.
Income Tax
Nevada, including both Las Vegas and Spring Valley, does not impose state income tax. This tax benefit applies to all residents, irrespective of their city of residence.
Property Tax
Property taxes are also identical for Las Vegas and Spring Valley, given their location within Clark County. The county's property tax rate is comparatively lower than many other U.S. counties.
Sales Tax
Both Las Vegas and Spring Valley reside within Clark County, which enforces an 8.375% sales tax. This is the same rate for both cities due to shared jurisdiction.
Income
Type
Las Vegas
Spring Valley
Estimated median household income
$59,746
$61,179
Estimated per capita income
$33,825
$34,242
Cost of living index (U.S. average is 100)
99.1
100.2
If you make $50,000 in Las Vegas, you will have to make $50,555 in Spring Valley to maintain the same standard of living.
Geographical Conditions
Both Las Vegas and Spring Valley are located in the Mojave Desert. Las Vegas is a basin surrounded by mountains, while Spring Valley, located to the west of Las Vegas, is slightly elevated with a predominantly flat landscape.
Both areas come under the jurisdiction of the Clark County School District. However, educational facilities in Las Vegas, such as universities and professional training centers, are more diverse due to its larger size. Spring Valley also has reputable schools, but lacks the variety of higher education institutions present in Las Vegas.
Las Vegas, being a world-renowned tourism hub, offers diverse work opportunities in the hospitality, entertainment, and gaming industries. The city's economy is more dynamic and provides higher salary averages. Spring Valley's economy is more residentially focused, with job opportunities mainly in the retail, healthcare, and educational sectors.
Biggest Employers
In Las Vegas, the largest employers are MGM Resorts International, Caesars Entertainment, and the Clark County School District. In contrast, Spring Valley's major employers include the Clark County School District and healthcare providers like Spring Valley Hospital Medical Center.
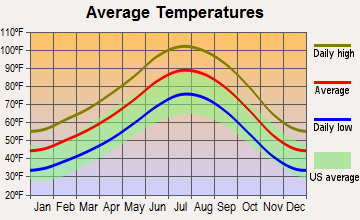
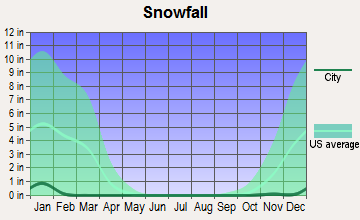
When it comes to weather, both Las Vegas and Spring Valley have similar climates, given their proximity and location in the Mojave Desert. They experience hot, dry summers and mild, cooler winters. However, Spring Valley tends to be slightly cooler due to its higher elevation.
Weather and climate
Type
Las Vegas
Spring Valley
Temperature - Average
65.5°F
66.1°F
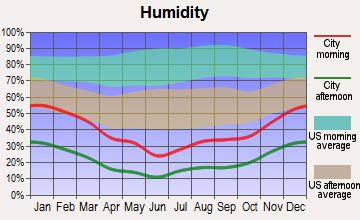
Humidity - Average morning or afternoon humidity
30.7%
30.8%
Humidity - Differences between morning and afternoon humidity
42%
42.1%
Humidity - Maximum monthly morning or afternoon humidity
52%
52.1%
Humidity - Minimum monthly morning or afternoon humidity
10%
10.1%
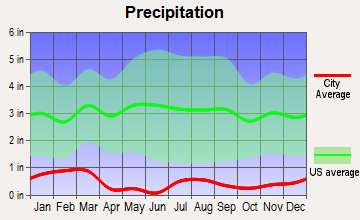
Precipitation - Yearly average
5.7 in
5.8 in
Snowfall - Yearly average
1.6 in
1.6 in
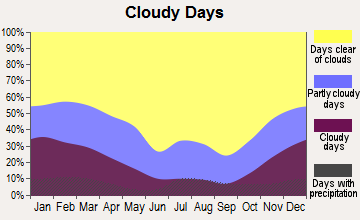
Clouds - Number of days clear of clouds
35.1%
35.1%
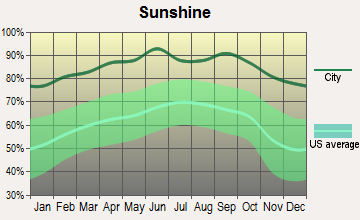
Sunshine amount - Average
91.8%
91.8%
Sunshine amount - Differences during a year
16%
16%
Sunshine amount - Maximum monthly
92%
91.9%
Sunshine amount - Minimum monthly
76%
75.9%
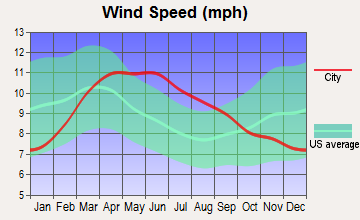
Wind speed - Average
9.2 mph
9.2 mph
Average climate in Las Vegas, Nevada
Average climate in Spring Valley, Nevada
Air pollution
Type
AQI
CO
NO2
OZONE
PM10
PM25
SO2
Year
Las Vegas
Spring Valley
Las Vegas
Spring Valley
Las Vegas
Spring Valley
Las Vegas
Spring Valley
Las Vegas
Spring Valley
Las Vegas
Spring Valley
Las Vegas
Spring Valley
2018
100
102
0.42
0.42
13.1
14.5
37.2
34.8
24.4
24.6
6.0
6.5
0.7
0.7
2017
101
102
0.29
0.31
13.0
14.5
38.5
34.4
20.3
20.1
7.3
6.3
0.8
0.8
2016
97
111
0.38
0.38
11.2
12.2
36.5
33.6
20.6
18.8
8.7
8.1
0.8
0.8
2015
92
92
0.36
0.38
12.4
13.2
35.6
33.7
18.9
18.7
8.4
8.0
1.2
1.2
2014
91
92
0.40
0.41
10.8
11.5
36.5
33.3
21.1
18.6
9.2
8.7
1.4
1.4
2013
103
103
0.45
0.44
9.6
10.7
36.9
33.8
22.1
18.7
8.6
8.1
1.5
1.5
2012
94
98
0.49
0.48
5.9
6.1
38.5
34.1
21.5
21.0
8.3
7.8
1.4
1.4
2011
85
86
0.40
0.42
5.3
5.3
37.5
34.1
18.2
17.3
7.8
7.1
1.2
1.2
2010
86
87
0.50
0.50
5.7
5.7
36.6
33.3
16.1
14.6
7.1
6.6
N/A
N/A
2009
87
83
0.56
0.57
6.0
6.0
33.3
32.0
20.9
17.9
8.3
7.8
N/A
N/A
2008
82
82
0.66
0.63
8.2
8.2
33.0
33.2
N/A
N/A
9.2
8.5
N/A
N/A
2007
97
98
0.61
0.53
11.7
10.6
32.4
33.6
N/A
N/A
8.6
8.2
0.1
0.1
2006
102
102
0.75
0.71
13.4
10.8
32.7
31.5
N/A
N/A
8.3
8.1
0.8
0.8
2005
100
101
0.76
0.76
15.1
12.6
30.2
29.3
N/A
N/A
7.8
7.7
5.3
5.3
2004
85
88
0.71
0.74
16.0
13.6
30.6
30.5
N/A
N/A
N/A
N/A
1.6
1.6
2003
99
99
0.67
0.52
15.9
12.8
29.8
30.4
N/A
N/A
N/A
N/A
1.0
0.9
2002
94
95
0.73
0.12
15.7
12.4
30.6
30.5
N/A
N/A
N/A
N/A
0.7
0.7
2001
95
96
0.76
0.07
15.0
11.3
29.4
30.3
N/A
N/A
N/A
N/A
1.1
1.0
2000
95
96
0.88
0.37
14.7
11.6
29.7
31.8
N/A
N/A
N/A
N/A
0.4
0.4
Natural disasters
Type
Las Vegas
Spring Valley
Tornado activity compared to U.S. average
2.1%
2.1%
Earthquake activity compared to U.S. average
6,093.4%
6,139.5%
Natural disasters compared to U.S. average
12%
12%
Transportation
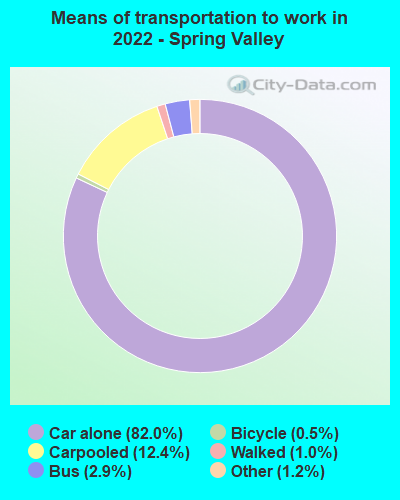
Las Vegas has more extensive public transportation, including buses and the monorail, catering to both residents and tourists.
Spring Valley has a well-maintained road network for commuting, but public transportation options are more limited compared to Las Vegas.
Transport
Type
Las Vegas
Spring Valley
Amtrak stations
1
0
Amtrak stations nearby
1
1
FAA registered aircraft
1
0
FAA registered aircraft manufacturers and dealers
81
0
Means of transportation to work
Type
Las Vegas
Spring Valley
Bicycle
0.1%
0.3%
Bus
2.2%
3.1%
Carpooled
10.3%
14.1%
Car alone
82.7%
76.5%
Motorcycle
0.4%
0.3%
Subway
0%
0.1%
Walked
1.4%
1.7%
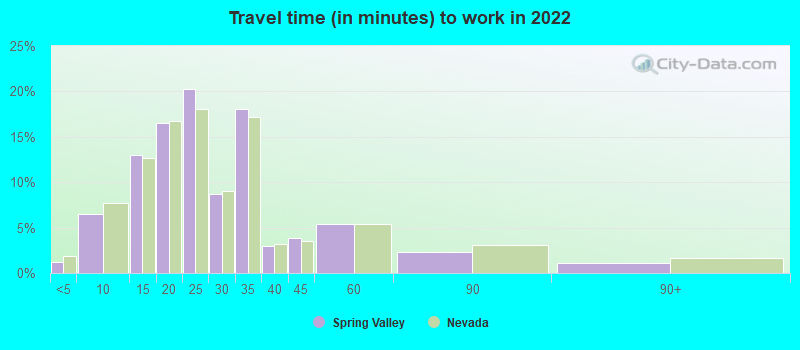
Average travel time to work
Type
Las Vegas
Spring Valley
Average
26.3 min
25.7 min
Other means
24 min
21.1 min
Public transportation
49.9 min
47.6 min
Private vehicle occupancy
Type
Las Vegas
Spring Valley
Average
1.2
1.2
Drove alone
88.9%
88%
In 2 person carpool
8.2%
9.6%
In 3 person carpool
2.1%
1.4%
In 4 person carpool
0.2%
0.5%
In 5-6 person carpool
0.4%
0.2%
In 7+ person carpool
0.2%
0.2%
How many people usually rode to work in the car, truck or van.
Real Estate
Real estate in Las Vegas tends to be more expensive due to high demand, particularly for properties close to the Strip or downtown. Spring Valley offers affordable housing and a more residential setting, attracting families and those looking for quieter neighborhoods.
Neighborhoods
Las Vegas is known for its iconic neighborhoods such as the Strip and Downtown, attracting tourists with casinos and entertainment venues. Spring Valley neighborhoods are typically quieter, featuring single-family homes, shopping centers, and parks.
Houses and residents
Type
Las Vegas
Spring Valley
Houses
269,602
94,405
Average household size (people)
2.7
2.5
Median year apartment built
1991
1998
Median year house/condo built
1995
2000
Length of stay in the house since moving in
10.1 years
9.9 years
Houses occupied
250,350 (92.9%)
88,063 (93.3%)
Houses occupied by owners
138,677 (55.4%)
40,227 (45.7%)
Houses occupied by renters
111,673 (44.6%)
47,836 (54.3%)
Median rent asked for vacant for-rent units
$1,176
$485.59
Median monthly housing costs
$1,255
$1,400
Median price asked for vacant for-sale houses and condos
$989,410
$442,486
Estimated median house or condo value
$362,400
$382,400
Median numbers of rooms
5.2
4.8
Median number of rooms in apartments
4.1
4.1
Median number of rooms in houses and condos
6.1
5.8
Median house price - detached houses
$439,169
$443,713
Median house price - in 2-unit structures
$161,204
$138,481
Median house price - in 3-to-4-unit structures
$201,871
$191,015
Median house price - in 5 or more unit structures
$327,174
$200,235
Median house price - mobile homes
$113,235
$131,058
Median house price - Townhouses or other attached units
$274,961
$392,352
Median house price - All housing units
$417,434
$402,364
Median house age
27
23
Renting percentage
43.5%
48.7%
Housing density (houses/condos per square mile)
2,379.4
2,830.3
House value disparities
27.1%
26.1%
Household income disparities
47.1%
45.3%
Median household income for houses/condes with a mortgage
$90,388
$82,617
Median household income for apartments without a mortgage
$62,287
$65,301
Housing units without a mortgage
1,172 (1.2%)
443 (1.7%)
Housing units with both a second mortgage and home equity loan
4,450 (4.6%)
2,148 (8.3%)
Housing units with a mortgage
95,992 (98.8%)
25,336 (98.3%)
Housing units with a home equity loan
178 (0.2%)
0 (0%)
Housing units with a second mortgage
5,092 (5.2%)
2,758 (10.7%)
House/condo owner moved in on average (years ago)
7
6
House/condo renter moved in on average (years ago)
2
1
Housing units lacking complete kitchen facilities
1.3%
0.8%
Housing units lacking complete plumbing facilities
1%
0.3%
Housing units in structures
Housing units in structures
Las Vegas
Spring Valley
One, detached
61.5%
49.6%
One, attached
5.3%
7.5%
Two
1.3%
1.3%
3 or 4
7.7%
6.6%
5 to 9
8.4%
9.7%
10 to 19
4.8%
5.8%
20 to 49
2.8%
3.6%
50 or more
6.8%
13.1%
Mobile homes
1.4%
2.7%
Boats, RVs, vans, etc.
0.1%
0.0%
Median real estate property taxes paid for housing units
Self-employed workers in own not incorporated business
18,990
5,829
State government workers
6,950
1,795
Unpaid family workers
614
0
Industries and Occupations
In Las Vegas, the predominant industries are tourism, gaming, and entertainment. Hence, the most common occupations are related to these industries, including hotel management, casino operations, and event management. Spring Valley offers jobs in education, retail, health care, and local business, reflecting its residential nature.
Building and grounds cleaning and maintenance occupations
5.8%
3.2%
Business and financial operations occupations
5.3%
5.8%
Health diagnosing and treating practitioners and other technical occupations
5.2%
6.5%
Healthcare support occupations
4.0%
4.6%
Health technologists and technicians
3.2%
3.0%
Material moving occupations
2.8%
0.8%
Legal occupations
2.0%
1.4%
Production occupations
2.0%
1.0%
Community and social service occupations
1.8%
0.5%
Computer and mathematical occupations
1.7%
4.3%
Arts, design, entertainment, sports, and media occupations
1.6%
2.4%
Firefighting and prevention, and other protective service workers including supervisors
0.9%
1.6%
Life, physical, and social science occupations
0.6%
1.7%
Health Care
Las Vegas offers a broader variety of healthcare facilities, including several large hospitals and specialized medical centers. In contrast, Spring Valley has fewer health care facilities, although key services are readily available.
Las Vegas boasts superior infrastructure, with world-class hotels, entertainment venues, and a comprehensive road network. Spring Valley maintains well-built suburban infrastructure, but it doesn't rival Las Vegas's urban development.
HMDA - Conventional home purchase loans - Applications denied
Year
Las Vegas
Spring Valley
1999
2,657
484
2000
579
101
2001
371
34
2002
380
51
2003
3,590
1,226
2004
5,908
2,298
2005
7,894
3,570
2006
6,914
2,556
2007
3,733
1,323
2008
1,431
659
2009
813
337
Culture and Food
Las Vegas, known as the "Entertainment Capital of the World", boasts a rich cultural scene with world-class entertainment and a wide range of cuisines available.
Spring Valley, while not as culturally diverse as Las Vegas, also offers a variety of dining options along with family-centric cultural events.
Sports Teams
Las Vegas is home to several major sports teams, including the Las Vegas Raiders (NFL) and the Vegas Golden Knights (NHL). Spring Valley lacks its own teams but is close enough to Las Vegas for residents to enjoy these sporting events.
 Las Vegas, NV
 Spring Valley, NV