When comparing Las Vegas, Nevada and Victorville, California, one will find notable contrasts in lifestyle offerings, economic opportunities, and living conditions. Las Vegas is world-renowned for its energetic nightlife, strong hospitality industry, and favorable tax laws, while Victorville presents a more suburban and calm living experience with a lower cost of living. The decision between these two cities comes down to individual preference in lifestyle, work environment, and what one values in terms of city amenities and services.
Distance between
Las Vegas, NV and
Victorville, CA : 166.3 miles
Las Vegas's population is larger by 376%. Its population has grown by 168,356 people (35.2%) since 2000. The population of Victorville has grown by 71,921 people (112.3%) during that time.
Las Vegas has a higher crime rate compared to the national average, primarily due to its prolific nightlife and large tourist population. However, like any city, crime levels vary by neighborhood. Victorville also has a high crime rate relative to the size of the city, with a substantial number of property crimes being reported. Both cities require residents and visitors to be vigilant and take standard urban safety precautions.
City-data.com crime index counts serious crimes and violent crime more heavily. It adjusts for the number of visitors and daily workers commuting into cities. (higher means more crime, U.S. average = 301.1)
City-data.com crime index counts serious crimes and violent crime more heavily. It adjusts for the number of visitors and daily workers commuting into cities. (higher means more crime, U.S. average = 301.1)
Sex Offenders
According to our data, there are 4,789 registered sex offenders living in Las Vegas and 360 registered sex offenders living in . The ratio of residents to sex offenders in Las Vegas is 132 to 1; the ratio in Victorville is 340 to 1. The number of registered sex offenders compared to the number of residents is much larger in Las Vegas than that in Victorville.
Cost of Living
The cost of living in Las Vegas is generally higher than in Victorville. Housing, groceries, and general expenses tend to cost more in Las Vegas due to the tourist-driven economy. Victorville, on the other hand, has a low cost of living relative to California's state average, making it more affordable for families and those on a modest income.
Income Tax
One of the major benefits of living in Las Vegas is that Nevada does not have state income tax. California, however, has one of the highest state income tax rates, which applies to Victorville residents.
Property Tax
Property taxes in Las Vegas are generally lower than the national average, which is favorable for homeowners. Conversely, Victorville homeowners pay California's comparatively high property tax rates.
Sales Tax
Nevada's state sales tax is higher than California's, but Las Vegas does not have additional local sales tax. Victorville, however, has added city-level sales tax on top of California's considerable state sales tax.
Income
Type
Las Vegas
Victorville
Estimated median household income
$59,746
$65,478
Estimated per capita income
$33,825
$21,771
Cost of living index (U.S. average is 100)
99.1
81.3
If you make $50,000 in Victorville, you will have to make $60,947 in Las Vegas to maintain the same standard of living.
Geographical Conditions
Las Vegas is located in a basin within the Mojave Desert, surrounded by mountain ranges. Victorville is located in the High Desert of California, resulting in a more temperate climate and different landscape.
Las Vegas has a higher student-to-teacher ratio in its public schools, whereas Victorville has smaller class sizes. University-wise, Las Vegas holds the University of Nevada, making it an attractive option for higher education. Victorville is home to Victor Valley College, a community college offering various programs.
The economy of Las Vegas is hugely driven by the tourism, gaming, and hospitality industries. These sectors provide a significant number of jobs. Victorville's economy is more varied with education, health care, and retail as leading industries. Unemployment rates are generally higher in Victorville than in Las Vegas.
Biggest Employers
Our top employers in Las Vegas include MGM Resorts International, Caesars Entertainment, and Wynn Resorts. Victorville's top employers are Victor Valley Global Medical Center, Desert Valley Hospital, and the Victor Elementary School District.
There were 2,700 building permits issued in Las Vegas in 2012 (1886 more than in 2011) compared to 642 building permits issued in Victorville in 2012 (530 more than in 2011).
In Las Vegas (Clark County), 56.4% voted for Democrats and 41.8% for Republicans in 2012 Presidential Election. In Victorville (San Bernardino County), 52.3% voted for Democrats and 45.0% for Republicans.
Elections
Type
Democrats
Republicans
Other
Year
Las Vegas
Victorville
Las Vegas
Victorville
Las Vegas
Victorville
2020
53.7%
54.2%
44.3%
43.6%
2.0%
2.2%
2016
52.4%
52.1%
41.7%
41.5%
5.8%
6.4%
2012
56.4%
52.3%
41.8%
45.0%
1.8%
2.6%
2008
58.5%
52.2%
39.5%
45.8%
2.0%
2.0%
2004
51.8%
43.8%
46.9%
55.6%
1.3%
0.6%
2000
51.4%
47.3%
44.8%
48.8%
3.8%
3.9%
1996
75.5%
44.4%
18.8%
43.6%
5.7%
12.1%
Breakdown of population affiliated with a religious congregation
Type
Adherents
Congregations
Religion
Las Vegas
Victorville
Las Vegas
Victorville
CATHOLIC CHURCH
18.1%
21.9%
4.0%
4.3%
SOUTHERN BAPTIST CONVENTION
1.6%
2.2%
11.2%
9.6%
EVANGELICAL LUTHERAN CHURCH IN AMERICA
0.4%
0.2%
1.6%
1.5%
SEVENTH DAY ADVENTIST CHURCH
0.2%
1.6%
1.6%
4.6%
MUSLIM ESTIMATE
0.1%
0.6%
0.6%
1.1%
Weather
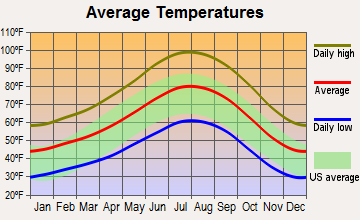
Las Vegas is situated in the Mojave Desert, leading to hot summers with temperatures often exceeding 100°F and mild winters. Rainfall levels are low throughout the year. Victorville has a desert climate as well, but is typically cooler due to its higher elevation. It experiences hot summers, colder winters, and slightly more rainfall than Las Vegas.
Weather and climate
Type
Las Vegas
Victorville
Temperature - Average
65.5°F
61.4°F
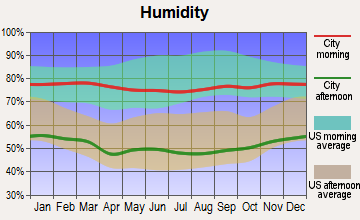
Humidity - Average morning or afternoon humidity
30.7%
63.4%
Humidity - Differences between morning and afternoon humidity
42%
18.3%
Humidity - Maximum monthly morning or afternoon humidity
52%
67.9%
Humidity - Minimum monthly morning or afternoon humidity
10%
49.6%
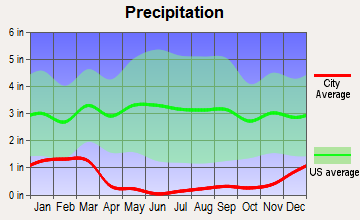
Precipitation - Yearly average
5.7 in
6.9 in
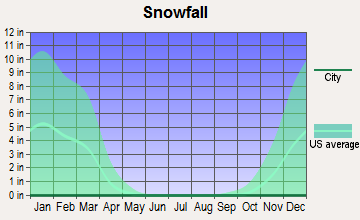
Snowfall - Yearly average
1.6 in
0 in
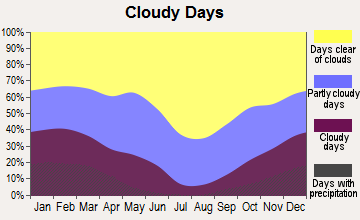
Clouds - Number of days clear of clouds
35.1%
27.5%
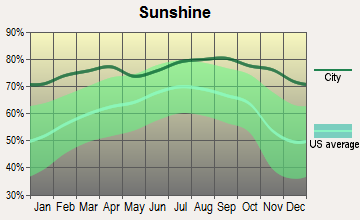
Sunshine amount - Average
91.8%
79%
Sunshine amount - Differences during a year
16%
20%
Sunshine amount - Maximum monthly
92%
84.1%
Sunshine amount - Minimum monthly
76%
64.1%
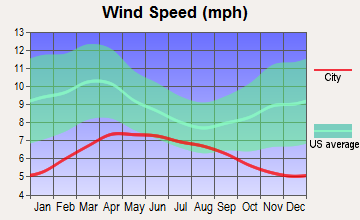
Wind speed - Average
9.2 mph
4.1 mph
Average climate in Las Vegas, Nevada
Average climate in Victorville, California
Air pollution
Type
AQI
CO
NO2
OZONE
PM10
PM25
SO2
Year
Las Vegas
Victorville
Las Vegas
Victorville
Las Vegas
Victorville
Las Vegas
Victorville
Las Vegas
Victorville
Las Vegas
Victorville
Las Vegas
Victorville
2018
100
112
0.42
0.30
13.1
11.5
37.2
37.6
24.4
29.5
6.0
8.4
0.7
1.1
2017
101
117
0.29
0.38
13.0
12.6
38.5
34.7
20.3
29.9
7.3
8.5
0.8
0.7
2016
97
107
0.38
0.43
11.2
10.2
36.5
36.8
20.6
29.2
8.7
6.5
0.8
0.6
2015
92
109
0.36
0.34
12.4
10.8
35.6
36.8
18.9
24.7
8.4
8.2
1.2
0.4
2014
91
107
0.40
0.31
10.8
13.2
36.5
37.2
21.1
29.5
9.2
9.5
1.4
1.1
2013
103
118
0.45
0.23
9.6
14.3
36.9
38.6
22.1
30.4
8.6
8.2
1.5
1.1
2012
94
116
0.49
0.24
5.9
13.3
38.5
37.4
21.5
26.6
8.3
9.3
1.4
1.0
2011
85
121
0.40
0.35
5.3
15.3
37.5
31.8
18.2
22.1
7.8
13.0
1.2
1.4
2010
86
115
0.50
0.31
5.7
15.1
36.6
35.3
16.1
21.8
7.1
12.4
N/A
0.9
2009
87
115
0.56
0.29
6.0
15.4
33.3
36.3
20.9
27.5
8.3
11.6
N/A
0.7
2008
82
119
0.66
0.22
8.2
16.3
33.0
34.8
N/A
64.8
9.2
N/A
N/A
0.5
2007
97
124
0.61
0.24
11.7
17.7
32.4
33.4
N/A
35.0
8.6
N/A
0.1
0.7
2006
102
112
0.75
0.33
13.4
19.7
32.7
32.1
N/A
32.0
8.3
N/A
0.8
1.0
2005
100
110
0.76
0.32
15.1
19.2
30.2
32.8
N/A
27.5
7.8
N/A
5.3
0.8
2004
85
111
0.71
0.35
16.0
21.1
30.6
31.7
N/A
29.0
N/A
N/A
1.6
0.9
2003
99
125
0.67
0.35
15.9
21.5
29.8
32.6
N/A
29.3
N/A
N/A
1.0
1.0
2002
94
127
0.73
0.40
15.7
22.2
30.6
32.7
N/A
33.2
N/A
N/A
0.7
1.3
2001
95
110
0.76
0.43
15.0
21.5
29.4
32.0
N/A
28.1
N/A
N/A
1.1
1.6
2000
95
122
0.88
0.39
14.7
21.6
29.7
31.6
N/A
32.1
N/A
N/A
0.4
1.4
Natural disasters
Type
Las Vegas
Victorville
Tornado activity compared to U.S. average
2.1%
12.8%
Earthquake activity compared to U.S. average
6,093.4%
7,678.5%
Natural disasters compared to U.S. average
12%
46%
Transportation
Las Vegas has an efficient public transportation system provided by RTC, including buses and monorails. Although significantly smaller, Victorville is serviced by the Victor Valley Transit Authority and is in proximity to major highways for commutes.
Transport
Type
Las Vegas
Victorville
Amtrak stations
1
1
Amtrak stations nearby
1
1
FAA registered aircraft
1
39
FAA registered aircraft manufacturers and dealers
81
1
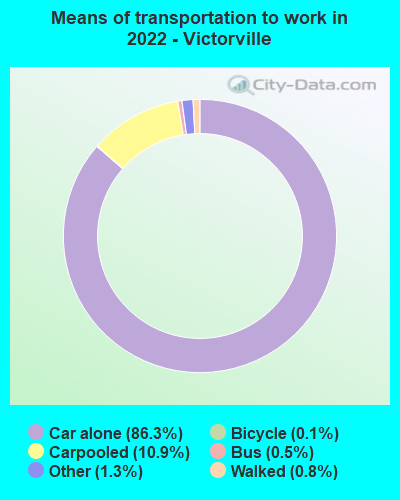
Means of transportation to work
Type
Las Vegas
Victorville
Bicycle
0.1%
0.1%
Bus
2.2%
0.8%
Carpooled
10.3%
9.4%
Car alone
82.7%
88.4%
Motorcycle
0.4%
0.2%
Walked
1.4%
0.7%
Average travel time to work
Type
Las Vegas
Victorville
Average
26.3 min
26.9 min
Other means
24 min
34.1 min
Public transportation
49.9 min
48.8 min
Private vehicle occupancy
Type
Las Vegas
Victorville
Average
1.2
1.2
Drove alone
88.9%
86.1%
In 2 person carpool
8.2%
9.5%
In 3 person carpool
2.1%
1.8%
In 4 person carpool
0.2%
0.8%
In 5-6 person carpool
0.4%
1.1%
In 7+ person carpool
0.2%
0.4%
How many people usually rode to work in the car, truck or van.
Real Estate
Real estate in Las Vegas is more expensive compared to Victorville. The city presents a diverse real estate market from affordable apartments to luxury villas. Victorville's real estate market is more reasonably priced, featuring mostly single-family homes.
Neighborhoods
Las Vegas is known for its vibrant neighborhoods like the entertainment-filled Strip and the artsy Downtown. Victorville is a more residential city with family-friendly neighborhoods like Spring Valley Lake and Brentwood.
Houses and residents
Type
Las Vegas
Victorville
Houses
269,602
39,786
Average household size (people)
2.7
3.4
Median year apartment built
1991
1989
Median year house/condo built
1995
1996
Length of stay in the house since moving in
10.1 years
10.4 years
Houses occupied
250,350 (92.9%)
38,400 (96.5%)
Houses occupied by owners
138,677 (55.4%)
23,477 (61.1%)
Houses occupied by renters
111,673 (44.6%)
14,923 (38.9%)
Median rent asked for vacant for-rent units
$1,176
$573.02
Median monthly housing costs
$1,255
$1,365
Median price asked for vacant for-sale houses and condos
$989,410
$172,643
Estimated median house or condo value
$362,400
$323,400
Median numbers of rooms
5.2
5.9
Median number of rooms in apartments
4.1
5.4
Median number of rooms in houses and condos
6.1
6.2
Median house age
27
28
Renting percentage
43.5%
38.2%
Housing density (houses/condos per square mile)
2,379.4
546.7
House value disparities
27.1%
22.7%
Household income disparities
47.1%
39.9%
Median household income for houses/condes with a mortgage
$90,388
$80,386
Median household income for apartments without a mortgage
$62,287
$65,821
Housing units without a mortgage
1,172 (1.2%)
230 (1.4%)
Housing units with both a second mortgage and home equity loan
4,450 (4.6%)
1,011 (6%)
Housing units with a mortgage
95,992 (98.8%)
16,588 (98.6%)
Housing units with a home equity loan
178 (0.2%)
0 (0%)
Housing units with a second mortgage
5,092 (5.2%)
1,241 (7.4%)
House/condo owner moved in on average (years ago)
7
8
House/condo renter moved in on average (years ago)
2
4
Housing units lacking complete kitchen facilities
1.3%
1.4%
Housing units lacking complete plumbing facilities
1%
0.9%
Housing units in structures
Housing units in structures
Las Vegas
Victorville
One, detached
61.5%
77.1%
One, attached
5.3%
1.3%
Two
1.3%
2.4%
3 or 4
7.7%
5.4%
5 to 9
8.4%
2.0%
10 to 19
4.8%
2.5%
20 to 49
2.8%
0.2%
50 or more
6.8%
2.7%
Mobile homes
1.4%
6.3%
Boats, RVs, vans, etc.
0.1%
0.1%
Median real estate property taxes paid for housing units
Self-employed workers in own not incorporated business
18,990
3,540
State government workers
6,950
2,583
Unpaid family workers
614
191
Industries and Occupations
Occupations in Las Vegas are primarily in the hospitality and retail sectors, reflecting the city's reliance on tourism. Victorville, while having a notable retail sector, also has significant employment in the public sector and health care.
Las Vegas has several large hospitals and health care centers, providing top-notch medical care. Victorville also has adequate health care resources with two major hospitals serving the local population.
Health (county statistics)
Type
Las Vegas
Victorville
General health status score of residents in this county from 1 (poor) to 5 (excellent)
Las Vegas boasts modern infrastructure suited to handle the influx of tourists, including a large airport and various entertainment venues. Victorville, a more residential city, has less extensive infrastructure but is located near major highways for easy commuting.
Infrastructure
Type
Las Vegas
Victorville
Hospitals
39
2
TV stations
12
9
Bank branches located here
281
17
Bank institutions located here
34
7
Drinking water stations with no reported violations in the past
32
2
Drinking water stations with reported violations in the past
HMDA - Conventional home purchase loans - Applications denied
Year
Las Vegas
Victorville
1999
2,657
114
2000
579
173
2001
371
159
2002
380
322
2003
3,590
498
2004
5,908
919
2005
7,894
1,268
2006
6,914
1,584
2007
3,733
907
2008
1,431
261
2009
813
144
Culture and Food
Las Vegas's culture is highly influenced by entertainment and tourism, with a bustling nightlife and world-class restaurants. Victorville has a quieter lifestyle with local eateries and cultural festivals offering a more community-centric experience.
Sports Teams
Las Vegas is home to several professional sports teams, including the Vegas Golden Knights (NHL) and Las Vegas Raiders (NFL). Victorville does not have any major sports teams but is in proximity to Los Angeles teams.


 Las Vegas, NV
 Victorville, CA