Long Beach and Burbank are unique California cities with distinctive qualities that can appeal to both residents and visitors. Long Beach, with its scenic coastal beauty and vibrant port industry, offers an invigorating mix of urban and seaside life. Burbank, known as the "Media Capital of the World," provides an up-close experience with the entertainment industry. Each city has a unique atmosphere, weather, educational opportunities, living costs, and work possibilities.
Distance between
Long Beach, CA and
Burbank, CA : 27.8 miles
Long Beach's population is larger by 333%. Its population has decreased by 5,460 people (1.2%) since 2000. The population of Burbank has grown by 5,085 people (5.1%) during that time.
According to publicly available data, Long Beach tends to have a higher crime rate compared to Burbank. However, the city's officials are taking aggressive measures to reduce crime and improve safety. Burbank is well-known for its low crime rate relative to other cities of its size, making it popular for families and those seeking a higher level of safety.
City-data.com crime index counts serious crimes and violent crime more heavily. It adjusts for the number of visitors and daily workers commuting into cities. (higher means more crime, U.S. average = 301.1)
City-data.com crime index counts serious crimes and violent crime more heavily. It adjusts for the number of visitors and daily workers commuting into cities. (higher means more crime, U.S. average = 301.1)
Sex Offenders
According to our data, there are 807 registered sex offenders living in Long Beach and 58 registered sex offenders living in . The ratio of residents to sex offenders in Long Beach is 583 to 1; the ratio in Burbank is 1,818 to 1. The number of registered sex offenders compared to the number of residents is much larger in Long Beach than that in Burbank.
Cost of Living
The cost of living in Burbank is generally higher than in Long Beach. Although both cities are pricier than the national average, housing tends to cost more in Burbank. By opting for Long Beach, you'll get more property per dollar spent, but living costs such as groceries and transportation are also matters to consider in both cities.
Income Tax
California has a progressive income tax, which varies from 1% to 13.3% depending on one's income level. The same tax rates apply to both cities, as there are no additional local income taxes.
Property Tax
The base rate for property tax in California is 1% of the assessed value, with additional levies and bonds applicable. Both Long Beach and Burbank follow this pattern, resulting in similar rates between cities, though the actual amounts will vary due to higher property values in Burbank.
Sales Tax
Both cities are subject to California's 6% state sales tax, plus a local district tax of around 2-3%, making a total sales tax rate of 8-9% in both Long Beach and Burbank.
Income
Type
Long Beach
Burbank
Estimated median household income
$73,905
$81,177
Estimated per capita income
$37,217
$51,035
Cost of living index (U.S. average is 100)
142
147.1
If you make $50,000 in Long Beach, you will have to make $51,796 in Burbank to maintain the same standard of living.
Geographical Conditions
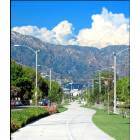
Long Beach is a coastal city endowed with a large sandy bay, a marina, and a busy shipping port. Burbank is set against the Verdugo Mountains’ foothills and is known for its flatlands and hills, providing a diverse range of views and landscapes.
The two cities showcase California's diverse educational opportunities. Long Beach is home to the prestigious California State University, Long Beach, one of the largest public universities in the state. Burbank, on the other hand, hosts a variety of private vocational and technical schools, particularly focused on the movie and animation industries.
The economy of Long Beach is largely driven by its sea port, technology businesses, and healthcare services. Burbank, often dubbed "The Media Capital of the World," harbors a powerhouse of entertainment and media companies including Warner Bros. Entertainment and The Walt Disney Company.
Biggest Employers
In Long Beach, biggest employers include Long Beach Memorial Medical Center, Long Beach Unified School District, and the City of Long Beach. In Burbank, the leading employers are The Walt Disney Company, Warner Bros. Entertainment, and Providence Saint Joseph Medical Center.
There were 304 building permits issued in Long Beach in 2012 (238 more than in 2011) compared to 172 building permits issued in Burbank in 2012 (166 more than in 2011).
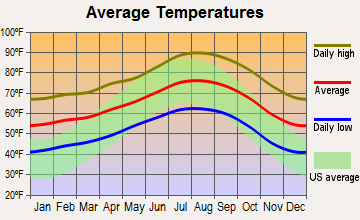
Weather
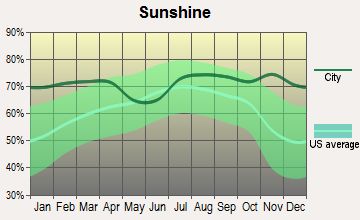
Long Beach, located on the Pacific coast, exhibits a Mediterranean climate with mild, wet winters, and warm to hot, dry summers. Enjoying much lower humidities than its coastal counterpart, Burbank tends to have a warmer, more desert-like climate, reaching higher temperatures in the summer. However, this inland city has the advantage that it's less affected by the marine layer, making its days more sunny and bright.
Weather and climate
Type
Long Beach
Burbank
Temperature - Average
65.3°F
64.7°F
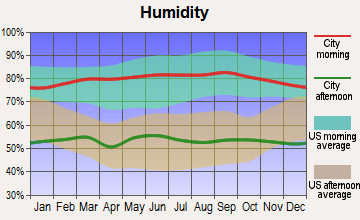
Humidity - Average morning or afternoon humidity
70.4%
61.3%
Humidity - Differences between morning and afternoon humidity
27%
16.5%
Humidity - Maximum monthly morning or afternoon humidity
79%
65.7%
Humidity - Minimum monthly morning or afternoon humidity
52%
49.3%
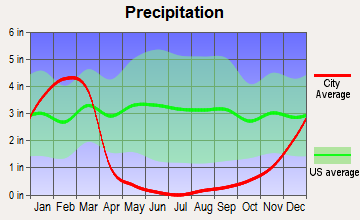
Precipitation - Yearly average
13.1 in
17.5 in
Snowfall - Yearly average
0 in
0 in
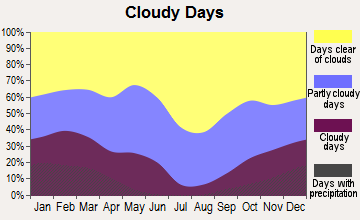
Clouds - Number of days clear of clouds
26.4%
28.9%
Sunshine amount - Average
78.4%
78.4%
Sunshine amount - Differences during a year
22%
22%
Sunshine amount - Maximum monthly
85%
85%
Sunshine amount - Minimum monthly
63%
63%
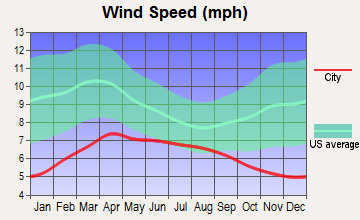
Wind speed - Average
6.1 mph
2.2 mph
Average climate in Long Beach, California
Average climate in Burbank, California
Air pollution
Type
AQI
CO
NO2
OZONE
PB
PM10
PM25
SO2
Year
Long Beach
Burbank
Long Beach
Burbank
Long Beach
Burbank
Long Beach
Burbank
Long Beach
Burbank
Long Beach
Burbank
Long Beach
Burbank
Long Beach
Burbank
2018
124
137
0.37
0.37
17.2
12.5
22.1
28.4
0.008
0.007
27.5
24.4
13.5
15.1
0.7
0.4
2017
122
143
0.36
0.41
18.1
13.2
23.2
29.4
0.007
0.006
26.7
25.0
14.5
15.6
0.8
0.5
2016
115
129
0.36
0.39
18.5
12.9
21.9
28.4
0.007
0.006
24.1
23.8
11.6
15.0
0.9
0.4
2015
111
130
0.38
0.39
19.9
13.4
22.5
28.9
0.005
0.005
25.0
21.8
13.9
16.0
0.9
0.2
2014
127
140
0.50
0.41
20.3
16.8
22.0
28.2
0.007
0.006
26.7
26.6
14.3
18.4
1.3
0.4
2013
126
137
0.48
0.45
20.0
20.5
24.7
28.0
0.005
0.007
32.3
25.1
14.6
17.6
1.0
0.3
2012
132
144
0.48
0.46
19.3
21.6
24.4
25.5
0.004
0.007
30.8
24.1
14.1
18.0
0.6
0.5
2011
119
141
0.43
0.49
20.2
22.7
23.4
22.3
0.006
0.009
28.4
24.3
15.6
19.1
1.2
0.4
2010
115
127
0.38
0.46
20.8
24.2
22.7
23.0
0.011
0.007
24.1
21.5
11.9
17.3
0.7
0.8
2009
132
153
0.50
0.53
21.0
27.6
22.0
24.2
0.008
0.009
27.7
40.9
13.1
20.0
1.1
0.5
2008
124
147
0.53
0.54
20.8
28.6
23.2
23.4
0.008
0.013
27.2
35.9
21.6
18.6
1.0
0.8
2007
109
126
0.60
0.57
20.3
28.5
21.1
22.1
0.010
0.012
N/A
N/A
N/A
N/A
1.4
1.0
2006
119
132
0.76
0.67
21.4
27.5
19.9
21.9
0.005
0.009
N/A
N/A
N/A
N/A
1.7
0.6
2005
108
132
0.74
0.76
24.3
29.2
20.5
19.9
0.011
0.014
N/A
N/A
N/A
N/A
2.7
1.6
2004
125
141
0.56
0.80
28.0
33.0
22.9
24.0
0.012
0.018
N/A
N/A
N/A
N/A
2.0
2.4
2003
130
145
0.83
1.00
28.1
35.1
22.4
22.6
0.032
0.025
N/A
N/A
N/A
N/A
1.1
1.3
2002
120
154
0.90
1.09
29.6
40.2
22.2
20.2
0.011
0.018
N/A
N/A
N/A
N/A
2.8
2.0
2001
124
136
0.81
1.15
30.3
41.1
21.5
17.5
0.011
0.016
N/A
N/A
N/A
N/A
3.3
0.7
2000
142
149
0.71
1.32
31.5
41.2
19.6
19.3
0.018
0.016
N/A
N/A
N/A
N/A
2.0
0.5
Natural disasters
Type
Long Beach
Burbank
Tornado activity compared to U.S. average
18.3%
15.9%
Earthquake activity compared to U.S. average
6,875.1%
7,202.5%
Natural disasters compared to U.S. average
57%
57%
Transportation
Long Beach boasts a well-connected transportation system, including buses, a light rail, and bike-sharing for local commuting and easy access to other California cities. Burbank provides comprehensive public transportation with buses, metro rail, and commuter rail services, its own airport also adds to the commuting convenience.
Transport
Type
Long Beach
Burbank
Amtrak stations
1
1
Amtrak stations nearby
3
3
FAA registered aircraft
312
101
FAA registered aircraft manufacturers and dealers
29
4
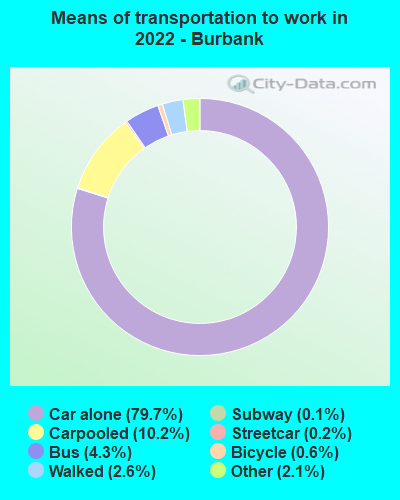
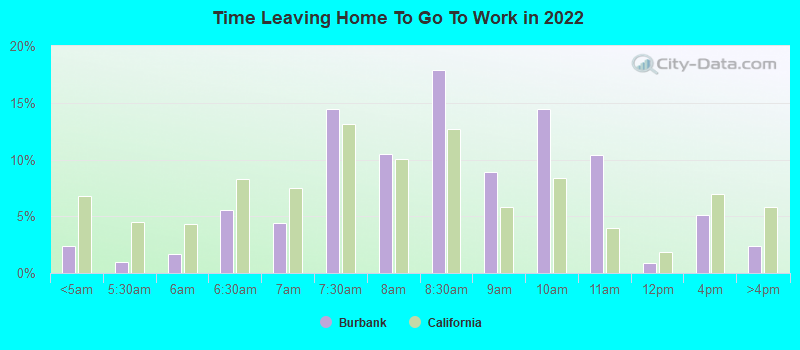
Means of transportation to work
Type
Long Beach
Burbank
Bicycle
0.5%
1.1%
Bus
3.3%
2.9%
Carpooled
9.8%
8.3%
Car alone
81.8%
82.4%
Motorcycle
0.2%
0.3%
Streetcar
0.1%
0.2%
Subway
0.5%
0.2%
Taxicab
0%
0.1%
Walked
2.8%
1.4%
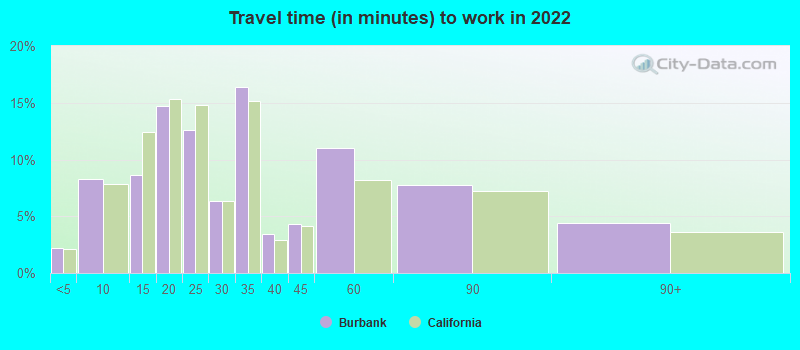
Average travel time to work
Type
Long Beach
Burbank
Average
30.7 min
31.1 min
Other means
28.5 min
27.1 min
Public transportation
46.4 min
44 min
Private vehicle occupancy
Type
Long Beach
Burbank
Average
1.1
1.1
Drove alone
89.7%
92.1%
In 2 person carpool
8.5%
5.2%
In 3 person carpool
1.4%
1.6%
In 4 person carpool
0.3%
0.9%
In 5-6 person carpool
0%
0.2%
How many people usually rode to work in the car, truck or van.
Real Estate
Real estate in Long Beach includes a mix of older craftsman-style homes, apartments, condos, and upscale waterfront homes. Burbank is characterized by many well-preserved older properties, single-family homes, and a variety of condominiums and townhomes. The prices in Burbank tend to be higher than in Long Beach, reflecting its safer neighborhoods and closeness to the entertainment industry.
Neighborhoods
Long Beach is renowned for its diverse neighborhoods, from artsy East Village to the exclusive Naples Island. Burbank is divided into two distinct areas: flatland and the hills. The flatland is largely dedicated to entertainment studios, while the hilly areas offer attractive residential neighborhoods, such as Burbank Hills and Chandler Park.
Houses and residents
Type
Long Beach
Burbank
Houses
179,856
48,556
Average household size (people)
2.8
2.5
Median year apartment built
1964
1972
Median year house/condo built
1954
1950
Length of stay in the house since moving in
15.7 years
16.6 years
Houses occupied
172,599 (96%)
44,471 (91.6%)
Houses occupied by owners
69,470 (40.2%)
19,869 (44.7%)
Houses occupied by renters
103,129 (59.8%)
24,602 (55.3%)
Median rent asked for vacant for-rent units
$1,057
$2,506
Median monthly housing costs
$1,692
$2,047
Median price asked for vacant for-sale houses and condos
$520,992
$693,908
Estimated median house or condo value
$693,600
$940,400
Median numbers of rooms
4.2
4.4
Median number of rooms in apartments
3.6
3.3
Median number of rooms in houses and condos
5.5
6
Median house price - detached houses
$900,658
Over $1,000,000
Median house price - in 2-unit structures
$823,515
$657,518
Median house price - in 3-to-4-unit structures
$495,928
Over $1,000,000
Median house price - in 5 or more unit structures
$488,399
$611,035
Median house price - mobile homes
$333,777
$674,363
Median house price - Townhouses or other attached units
$634,684
$792,978
Median house price - All housing units
$805,766
Over $1,000,000
Median house age
62
60
Renting percentage
58.4%
56%
Housing density (houses/condos per square mile)
3,565.7
2,798.9
House value disparities
21.3%
17%
Household income disparities
44.7%
46.5%
Median household income for houses/condes with a mortgage
$116,421
$152,292
Median household income for apartments without a mortgage
$79,392
$64,119
Housing units without a mortgage
394 (0.8%)
244 (1.7%)
Housing units with both a second mortgage and home equity loan
3,069 (6.2%)
1,336 (9.2%)
Housing units with a mortgage
49,321 (99.2%)
14,224 (98.3%)
Housing units with a home equity loan
48 (0.1%)
76 (0.5%)
Housing units with a second mortgage
3,709 (7.5%)
1,516 (10.5%)
House/condo owner moved in on average (years ago)
15
17
House/condo renter moved in on average (years ago)
3
5
Housing units lacking complete kitchen facilities
2.6%
1.9%
Housing units lacking complete plumbing facilities
0.4%
0.3%
Housing units in structures
Housing units in structures
Long Beach
Burbank
One, detached
40.2%
41.2%
One, attached
4.9%
7.9%
Two
5.3%
3.0%
3 or 4
8.8%
6.9%
5 to 9
10.4%
9.4%
10 to 19
10.8%
10.3%
20 to 49
8.0%
9.3%
50 or more
10.6%
12.0%
Mobile homes
0.8%
0.0%
Boats, RVs, vans, etc.
0.2%
0.0%
Median real estate property taxes paid for housing units
Self-employed workers in own not incorporated business
18,532
4,414
State government workers
6,550
403
Unpaid family workers
178
27
Industries and Occupations
While Burbank's economy is predominantly fueled by the entertainment industry, Long Beach has a broader spectrum of industries, including healthcare, education, and port-related professions. The job scenario in Burbank is closely linked to TV productions, film studios, and animation, while Long Beach offers opportunities in technology, healthcare, and freight transportation.
Health diagnosing and treating practitioners and other technical occupations
4.9%
4.5%
Community and social service occupations
4.4%
2.7%
Personal care and service occupations
3.6%
2.8%
Arts, design, entertainment, sports, and media occupations
3.0%
13.2%
Building and grounds cleaning and maintenance occupations
2.9%
2.7%
Health technologists and technicians
2.8%
1.5%
Material moving occupations
2.8%
2.3%
Production occupations
2.7%
1.8%
Computer and mathematical occupations
1.9%
2.1%
Transportation occupations
1.4%
0.3%
Life, physical, and social science occupations
1.3%
2.0%
Legal occupations
1.3%
1.2%
Health Care
Both cities offer high-quality healthcare services. Long Beach has world-class medical facilities including Long Beach Memorial Medical Center, one of the biggest hospitals in the region. Burbank is home to the leading Providence Saint Joseph Medical Center.
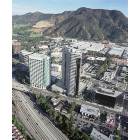
Long Beach is praised for its blend of unique neighborhoods and beach-town feel, while boasting modern infrastructure. Burbank, built within a basin of the San Fernando Valley, exhibits well-developed housing, commercial areas, and infrastructure, with the added convenience of a regional airport.
Infrastructure
Type
Long Beach
Burbank
Hospitals
17
2
TV stations
5
24
Bank branches located here
67
26
Bank institutions located here
18
13
Main business address for public companies
11
4
Drinking water stations with no reported violations in the past
2
2
Drinking water stations with reported violations in the past
HMDA - Conventional home purchase loans - Applications denied
Year
Long Beach
Burbank
1999
1,159
219
2000
710
253
2001
677
192
2002
708
249
2003
1,861
264
2004
2,162
389
2005
3,065
406
2006
3,591
622
2007
2,287
383
2008
887
233
2009
475
125
Culture and Food
Long Beach offers an active beach life culture with a rich array of ethnic cuisines, while Burbank offers a strong media-themed entertainment culture with notable dining options ranging from chain eateries to high-end restaurants.
Sports Teams
Neither city has a major league sports franchise, but Long Beach's location provides easier access to LA's sports teams, including the Dodgers, Lakers, Rams, and Kings. Burbank, though closer to the Hollywood sports scene, lacks accessibility to sports venues unlike Long Beach.


 Long Beach, CA
 Burbank, CA