Long Beach and El Toro are distinctive Californian cities, each offering a unique lifestyle. Long Beach, a bustling coastal city, is well-known for its vibrant urban life and diverse economy, while El Toro, nestled in the Orange County inland, provides a quieter, more suburban experience. This detailed comparison will guide you through the crucial factors that distinguish these cities, from crime rates, weather, and cost of living, to cultural, healthcare, and economic aspects.
While both cities are relatively safe, they do have different crime rates. Long Beach, being a larger urban area, has a slightly higher crime rate compared to the national average. However, various efforts by the local police department have proved successful in reducing crime rates over the years. Meanwhile, El Toro, with its smaller population and more suburban lifestyle, has a lower crime rate. Both cities have good police response times, making them safe for both residents and visitors alike.
Cost of Living
The cost of living in both cities is higher than the national average, in line with many parts of California. While Long Beach's cost of living is high, especially in terms of housing costs, it offers various types of housing and neighborhoods which can cater to diverse budgets. Meanwhile, El Toro, being a smaller and more suburban area, has higher housing costs on average due to its more upscale, spacious homes.
Income Tax
California has a progressive income tax system, which applies to both Long Beach and El Toro. The rates range based on income levels, with a higher income attracting a higher tax rate.
Property Tax
Both cities have similar property tax rates as they are both part of the same state. However, due to the higher property prices in El Toro, homeowners often end up paying more property taxes than those in Long Beach.
Sales Tax
Both Long Beach and El Toro have similarly high sales tax rates, exceeding the national average. As parts of California, they share the same state sales tax rate.
Income
Type
Long Beach
El Toro
Estimated median household income
$73,905
$132,724
Estimated per capita income
$37,217
$60,371
Cost of living index (U.S. average is 100)
142
95
If you make $50,000 in El Toro, you will have to make $74,737 in Long Beach to maintain the same standard of living.
Geographical Conditions
Long Beach is a coastal city with miles of beaches and marina, making it popular for water sports. El Toro, on the other hand, is inland, surrounded by green hills, and features a notable lake, Lake Forest.
Geographical information
Type
Long Beach
El Toro
Land area
50.4 sq. miles
74.2 sq. miles
Population density
9,041.5 people per sq. mile
2,412 people per sq. mile
Elevation
29 feet
520 feet
Relative area comparison
Long Beach, CA El Toro, CA
Education
Both cities are known for their strong educational systems. Long Beach Unified School District, one of the largest and most diverse in California, serves Long Beach. The city also hosts California State University, Long Beach, one of the largest public universities in the state. El Toro, though smaller, is part of the highly reputable Saddleback Valley Unified School District and close to several well-respected universities.
Long Beach has a much larger, more diverse economy compared to El Toro. Key sectors include healthcare, education, port-related industries, and tourism. Meanwhile, El Toro, while not boasting as many large employers as Long Beach, has a stable economy with key sectors in education, healthcare, and retail. Its residents often commute to nearby larger cities for work.
Biggest Employers
Long Beach's biggest employers include Long Beach Memorial Medical Center, Long Beach Unified School District, and the City of Long Beach. In El Toro, the top employers tend to be local schools and retail establishments, with many residents also working in nearby cities.
In Long Beach (Los Angeles County), 69.7% voted for Democrats and 27.8% for Republicans in 2012 Presidential Election. In El Toro (Orange County), 45.8% voted for Democrats and 52.0% for Republicans.
Elections
Type
Democrats
Republicans
Other
Year
Long Beach
El Toro
Long Beach
El Toro
Long Beach
El Toro
2020
71.0%
53.6%
26.9%
44.6%
2.1%
1.8%
2016
72.0%
50.9%
22.5%
42.4%
5.5%
6.7%
2012
69.7%
45.8%
27.8%
52.0%
2.4%
2.3%
2008
69.2%
47.8%
28.8%
50.3%
1.9%
1.9%
2004
63.3%
39.3%
35.7%
60.2%
1.0%
0.5%
2000
63.6%
40.4%
32.4%
55.9%
4.0%
3.7%
1996
59.3%
37.9%
31.0%
51.7%
9.7%
10.5%
Breakdown of population affiliated with a religious congregation
Type
Adherents
Congregations
Religion
Long Beach
El Toro
Long Beach
El Toro
CATHOLIC CHURCH
36.1%
26.5%
4.7%
4.4%
SOUTHERN BAPTIST CONVENTION
1.0%
2.3%
9.0%
8.8%
MUSLIM ESTIMATE
0.7%
0.8%
1.0%
1.3%
AMERICAN BAPTIST CHURCHES IN THE USA
0.5%
0.2%
3.1%
1.7%
SEVENTH DAY ADVENTIST CHURCH
0.5%
0.4%
2.4%
1.3%
EPISCOPAL CHURCH
0.4%
0.4%
1.4%
1.4%
EVANGELICAL LUTHERAN CHURCH IN AMERICA
0.2%
0.4%
1.9%
2.3%
LUTHERAN CHURCH
0.2%
0.6%
1.6%
2.0%
REFORMED CHURCH IN AMERICA
0.1%
0.3%
0.2%
0.2%
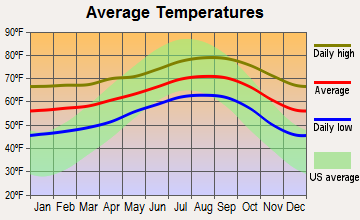
Weather
California is known for its pleasant weather and both Long Beach and El Toro are no exceptions. Long Beach, due to its coastal location, experiences mild, Mediterranean-type weather with cool, wet winters and warm, dry summers. It benefits from continuous ocean breezes which moderate temperatures year-round. El Toro, situated further inland, has a semi-arid climate. The summers can be hot, but winters are mild and it has more days of sunshine compared to Long Beach.
Weather and climate
Type
Long Beach
El Toro
Temperature - Average
65.3°F
63.3°F
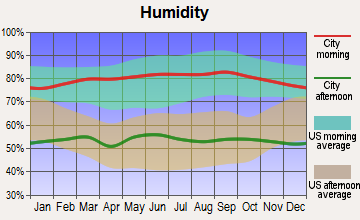
Humidity - Average morning or afternoon humidity
70.4%
68.9%
Humidity - Differences between morning and afternoon humidity
27%
24.8%
Humidity - Maximum monthly morning or afternoon humidity
79%
76.8%
Humidity - Minimum monthly morning or afternoon humidity
52%
52.1%
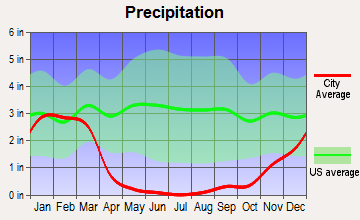
Precipitation - Yearly average
13.1 in
13.1 in
Snowfall - Yearly average
0 in
0 in
Clouds - Number of days clear of clouds
26.4%
26.7%
Sunshine amount - Average
78.4%
78.2%
Sunshine amount - Differences during a year
22%
21.7%
Sunshine amount - Maximum monthly
85%
84.3%
Sunshine amount - Minimum monthly
63%
62.6%
Wind speed - Average
6.1 mph
5.4 mph
Average climate in Long Beach, California
Average climate in El Toro, California
Air pollution
Type
AQI
CO
NO2
OZONE
PB
PM10
PM25
SO2
Year
Long Beach
El Toro
Long Beach
El Toro
Long Beach
El Toro
Long Beach
El Toro
Long Beach
Long Beach
El Toro
Long Beach
El Toro
Long Beach
El Toro
2018
124
121
0.37
0.23
17.2
12.5
22.1
32.7
0.008
N/A
27.5
25.4
13.5
10.7
0.7
N/A
2017
122
123
0.36
0.25
18.1
12.3
23.2
33.4
0.007
N/A
26.7
25.7
14.5
12.9
0.8
N/A
2016
115
112
0.36
0.19
18.5
11.7
21.9
32.6
0.007
N/A
24.1
23.5
11.6
12.0
0.9
0.1
2015
111
123
0.38
0.16
19.9
12.4
22.5
31.8
0.005
N/A
25.0
23.5
13.9
13.7
0.9
0.1
2014
127
109
0.50
0.15
20.3
12.2
22.0
30.6
0.007
N/A
26.7
26.3
14.3
15.0
1.3
0.3
2013
126
110
0.48
0.21
20.0
12.7
24.7
29.2
0.005
N/A
32.3
27.2
14.6
12.9
1.0
0.2
2012
132
114
0.48
0.28
19.3
12.1
24.4
28.9
0.004
N/A
30.8
25.5
14.1
13.6
0.6
0.1
2011
119
129
0.43
0.19
20.2
13.3
23.4
29.5
0.006
N/A
28.4
26.5
15.6
14.5
1.2
0.3
2010
115
114
0.38
0.25
20.8
13.1
22.7
29.7
0.011
N/A
24.1
23.6
11.9
14.0
0.7
0.6
2009
132
134
0.50
0.20
21.0
15.2
22.0
30.4
0.008
N/A
27.7
25.2
13.1
14.6
1.1
1.1
2008
124
142
0.53
0.29
20.8
15.9
23.2
30.8
0.008
N/A
27.2
33.3
21.6
14.5
1.0
1.1
2007
109
116
0.60
0.27
20.3
16.0
21.1
29.7
0.010
N/A
N/A
N/A
N/A
N/A
1.4
0.8
2006
119
115
0.76
0.33
21.4
16.8
19.9
29.6
0.005
N/A
N/A
N/A
N/A
N/A
1.7
1.3
2005
108
113
0.74
0.31
24.3
16.9
20.5
29.4
0.011
N/A
N/A
N/A
N/A
N/A
2.7
1.3
2004
125
134
0.56
0.35
28.0
17.9
22.9
32.3
0.012
N/A
N/A
N/A
N/A
N/A
2.0
1.6
2003
130
133
0.83
0.44
28.1
20.9
22.4
30.2
0.032
N/A
N/A
N/A
N/A
N/A
1.1
1.1
2002
120
130
0.90
0.46
29.6
20.3
22.2
27.1
0.011
N/A
N/A
N/A
N/A
N/A
2.8
1.6
2001
124
140
0.81
0.57
30.3
20.5
21.5
27.0
0.011
N/A
N/A
N/A
N/A
N/A
3.3
1.4
2000
142
140
0.71
0.48
31.5
23.3
19.6
23.1
0.018
N/A
N/A
N/A
N/A
N/A
2.0
1.9
Natural disasters
Type
Long Beach
El Toro
Tornado activity compared to U.S. average
18.3%
18.6%
Earthquake activity compared to U.S. average
6,875.1%
6,916.9%
Natural disasters compared to U.S. average
57%
32%
Transportation
Long Beach has a robust public transport system including buses, the Metro Blue line, and a bike sharing program. El Toro residents primarily utilize private vehicles; however, Orange County Transportation Authority provides bus services. Most residents commute to work, commonly to neighboring cities.
Transport
Type
Long Beach
El Toro
Amtrak stations
1
0
Amtrak stations nearby
3
3
FAA registered aircraft
312
0
FAA registered aircraft manufacturers and dealers
29
0
Means of transportation to work
Type
Long Beach
El Toro
Bicycle
0.5%
0.3%
Bus
3.3%
0.5%
Carpooled
9.8%
9.7%
Car alone
81.8%
83.4%
Motorcycle
0.2%
0.2%
Railroad
0%
0.2%
Subway
0.5%
0%
Walked
2.8%
0.6%
Average travel time to work
Type
Long Beach
El Toro
Average
30.7 min
25.6 min
Real Estate
Real estate in Long Beach offers a variety, from beachfront condos to suburban houses. El Toro is notable for its spacious, upscale homes, many with modern architecture and luxurious amenities. The real estate market is generally more expensive in El Toro than Long Beach due to the nature of the residential properties.
Neighborhoods
Long Beach offers a mix of urban and suburban neighborhoods, each with its distinct character. From Belmont Shore's beachfront homes to Bixby Knolls' urban vibe, there is much to choose from. El Toro, in contrast, is mainly suburban with neighborhoods featuring open spaces, scenic beauty, and tranquil suburban living.
Houses and residents
Type
Long Beach
El Toro
Houses
179,856
65,041
Average household size (people)
2.8
2.8
Houses occupied
172,599 (96%)
61,855 (95.1%)
Houses occupied by owners
69,470 (40.2%)
42,038 (68%)
Houses occupied by renters
103,129 (59.8%)
19,817 (32%)
Median rent asked for vacant for-rent units
$1,057
$3,113
Median price asked for vacant for-sale houses and condos
$520,992
$1,099,558
Estimated median house or condo value
$693,600
$956,652
Median number of rooms in apartments
3.6
3.9
Median number of rooms in houses and condos
5.5
6.1
Housing density (houses/condos per square mile)
3,565.7
876.6
Household income disparities
44.7%
35%
Housing units without a mortgage
394 (0.8%)
2,867 (7.8%)
Housing units with both a second mortgage and home equity loan
3,069 (6.2%)
154 (0.4%)
Housing units with a mortgage
49,321 (99.2%)
33,957 (92.2%)
Housing units with a home equity loan
48 (0.1%)
3,730 (10.1%)
Housing units with a second mortgage
3,709 (7.5%)
4,895 (13.3%)
Housing units lacking complete kitchen facilities
2.6%
0.3%
Housing units lacking complete plumbing facilities
Self-employed workers in own not incorporated business
18,532
7,511
State government workers
6,550
2,809
Unpaid family workers
178
330
Industries and Occupations
Long Beach's diverse economy brings about a variety of occupations, with a significant number of jobs in education, healthcare, and port-related industries. Conversely, El Toro, being more residential, has fewer industries and many residents commute to larger cities like Irvine and Los Angeles for work. The highest percentage of occupations here are in management and business.
Both cities have access to high-quality healthcare facilities. Long Beach has several major hospitals and a wide range of specialty clinics. El Toro, while not having a major hospital within the city, is close to top-rated hospitals in neighboring Irvine and Mission Viejo.
Health (county statistics)
Type
Long Beach
El Toro
General health status score of residents in this county from 1 (poor) to 5 (excellent)
Long Beach, as a larger city, benefits from comprehensive infrastructure, including an extensive road network, a large port, Long Beach Airport, and public transit systems. On the other hand, El Toro, while smaller, is well-planned and connected with major highways and nearby Orange County's public transit systems.
Infrastructure
Type
Long Beach
El Toro
TV stations
5
2
Bank branches located here
67
4
Bank institutions located here
18
3
Nuclear power plants nearby
0
2
Culture and Food
Long Beach is rich in culture and known for its diverse food scene, arts districts, music festivals, and historic landmarks. In contrast, El Toro offers a quieter lifestyle with a few local cultural events. It provides easy access to the rich cultural scene of the Orange County area.
Sports Teams
Long Beach doesn’t have any major professional sports teams but is home to several amateur sports teams and a Motor Cross Grand Prix. El Toro, while also lacking professional sports teams, enjoys proximity to the sports scene in nearby Los Angeles and Orange County.
 Long Beach, CA
 El Toro, CA