Long Beach and Glendale are two diverse, dynamic cities in Southern California, each with their unique charm and characteristics. Both provide excellent opportunities for visitors and residents alike, but a close examination reveals some key differences. The comparison encompasses various dimensions, including crime, weather, cost of living, education, economic prospects, infrastructure, industries, real-estate, neighborhoods, commuting, taxes, culture, sports, geographical conditions, and healthcare.
Distance between
Long Beach, CA and
Glendale, CA : 25.9 miles
Long Beach's population is larger by 137%. Its population has decreased by 5,460 people (1.2%) since 2000. The population of Glendale has decreased by 2,607 people (1.3%) during that time.
According to statistics, Long Beach generally exhibits higher crime rates compared to Glendale. While no urban center is devoid of crime, Glendale is regarded as one of the safest cities in the Los Angeles County. Its violent and property crime rates are traditionally below the national average. On the other hand, Long Beach, while not possessing extremely high crime rates, has a somewhat higher crime rate than Glendale and some areas should be avoided after dark. Both cities commit sufficient resources towards maintaining law and order and prioritizing safety.
City-data.com crime index counts serious crimes and violent crime more heavily. It adjusts for the number of visitors and daily workers commuting into cities. (higher means more crime, U.S. average = 301.1)
City-data.com crime index counts serious crimes and violent crime more heavily. It adjusts for the number of visitors and daily workers commuting into cities. (higher means more crime, U.S. average = 301.1)
Sex Offenders
According to our data, there are 807 registered sex offenders living in Long Beach and 70 registered sex offenders living in . The ratio of residents to sex offenders in Long Beach is 583 to 1; the ratio in Glendale is 2,869 to 1. The number of registered sex offenders compared to the number of residents is much larger in Long Beach than that in Glendale.
Cost of Living
The overall cost of living in both Long Beach and Glendale is significantly higher than the national average due to California's higher costs, particularly in housing. Glendale tends to be a bit more expensive than Long Beach, largely driven by housing costs and living expenses. Both cities have a diverse mix of dining and shopping options catering to both economy and luxury markets.
Income Tax
California's state income tax is one of the highest in the nation. This is no different in both Long Beach and Glendale as they adhere to the state tax regime. Recent laws have increased the top marginal tax rate in California, affecting high-income earners in both cities.
Property Tax
Property tax rates in California are generally below the national average, but high property values often result in substantial property tax bills. Both Long Beach and Glendale have similar rates, although property values may be higher in Glendale.
Sales Tax
Both Long Beach and Glendale follow California's high sales tax rate structure. As of 2021, the total sales tax rate in Long Beach is 10.25% while in Glendale it is 10.25% as well, with differences largely coming from city-imposed additions to the base state sales tax.
Income
Type
Long Beach
Glendale
Estimated median household income
$73,905
$79,633
Estimated per capita income
$37,217
$41,791
Cost of living index (U.S. average is 100)
142
148.1
If you make $50,000 in Long Beach, you will have to make $52,148 in Glendale to maintain the same standard of living.
Geographical Conditions
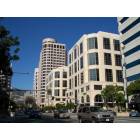
The geographical conditions of both cities differ considerably. Long Beach, with its coastal location, offers waterfront views, beaches, and mild sea breezes. The city sits relatively flat on the coastal plane. Glendale, while landlocked, operates on hilly terrain, with foothill neighborhoods offering fantastic views of greater Los Angeles.
Long Beach offers a more diverse range of educational institutions, including the esteemed California State University, Long Beach. Glendale, offers an equally strong education system, highlighted by Glendale Community College and a number of highly rated public and private schools. The quality of schools in both the cities is fairly comparible with different options based on neighborhood.
The economic structures of Glendale and Long Beach are diverse and relatively robust. Long Beach has a robust economy with strengths in sectors like healthcare, education, and the arts. The Port of Long Beach is also a significant economic contributor. While Glendale has a more service-oriented economy dominated by sectors such as finance, entertainment, and healthcare. The unemployment rates in both cities are reflective of the overall state average.
Biggest Employers
The biggest employers in Long Beach include Long Beach Unified School District, the City of Long Beach, and Long Beach Memorial Medical Center. Glendale's major employers include the city's Adventist Health medical center, Glendale Unified School District and the City of Glendale.
There were 304 building permits issued in Long Beach in 2012 (238 more than in 2011) compared to 134 building permits issued in Glendale in 2012 (123 more than in 2011).
Weather
Weather in both Long Beach and Glendale is typical of Southern California - marked by mild, wet winters and hot, dry summers. While Long Beach is coastal and has a Mediterranean climate with cool ocean breezes that moderate the heat and temperatures generally ranging from 70 to 80 degrees, Glendale, being further inland, has a slightly warmer and cooler climate with moderate temperature ranges, particularly in the peak summer and winter months.
Weather and climate
Type
Long Beach
Glendale
Temperature - Average
65.3°F
65.2°F
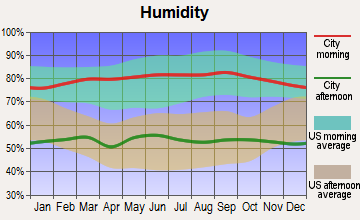
Humidity - Average morning or afternoon humidity
70.4%
61.3%
Humidity - Differences between morning and afternoon humidity
27%
16.4%
Humidity - Maximum monthly morning or afternoon humidity
79%
65.6%
Humidity - Minimum monthly morning or afternoon humidity
52%
49.2%
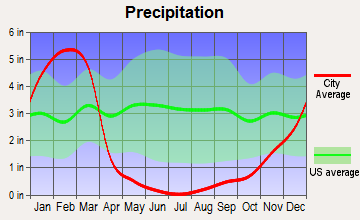
Precipitation - Yearly average
13.1 in
22.2 in
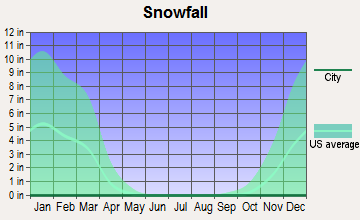
Snowfall - Yearly average
0 in
0 in
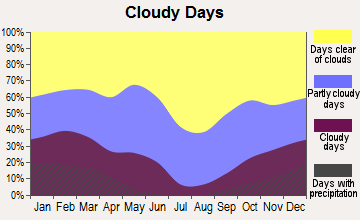
Clouds - Number of days clear of clouds
26.4%
29.4%
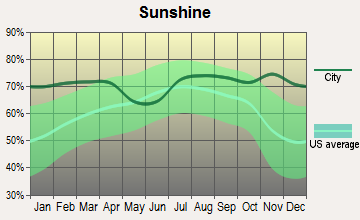
Sunshine amount - Average
78.4%
78.4%
Sunshine amount - Differences during a year
22%
22%
Sunshine amount - Maximum monthly
85%
85%
Sunshine amount - Minimum monthly
63%
63%
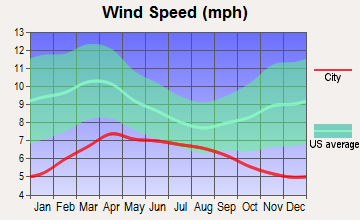
Wind speed - Average
6.1 mph
2.2 mph
Average climate in Long Beach, California
Average climate in Glendale, California
Air pollution
Type
AQI
CO
NO2
OZONE
PB
PM10
PM25
SO2
Year
Long Beach
Glendale
Long Beach
Glendale
Long Beach
Glendale
Long Beach
Glendale
Long Beach
Glendale
Long Beach
Glendale
Long Beach
Glendale
Long Beach
Glendale
2018
124
138
0.37
0.38
17.2
13.2
22.1
27.2
0.008
0.008
27.5
28.1
13.5
15.3
0.7
0.4
2017
122
145
0.36
0.40
18.1
14.0
23.2
28.3
0.007
0.007
26.7
31.8
14.5
15.5
0.8
0.4
2016
115
131
0.36
0.37
18.5
13.9
21.9
27.3
0.007
0.007
24.1
30.3
11.6
14.7
0.9
0.3
2015
111
138
0.38
0.38
19.9
14.1
22.5
27.7
0.005
0.006
25.0
29.5
13.9
16.3
0.9
0.2
2014
127
144
0.50
0.41
20.3
16.3
22.0
27.6
0.007
0.006
26.7
30.9
14.3
18.4
1.3
0.3
2013
126
140
0.48
0.45
20.0
18.9
24.7
27.0
0.005
0.007
32.3
25.4
14.6
17.2
1.0
0.3
2012
132
148
0.48
0.46
19.3
19.4
24.4
25.5
0.004
0.007
30.8
24.4
14.1
17.8
0.6
0.5
2011
119
144
0.43
0.48
20.2
20.4
23.4
23.2
0.006
0.009
28.4
25.8
15.6
18.7
1.2
0.4
2010
115
133
0.38
0.48
20.8
21.6
22.7
23.3
0.011
0.012
24.1
24.1
11.9
17.0
0.7
0.7
2009
132
154
0.50
0.48
21.0
24.5
22.0
24.0
0.008
0.011
27.7
40.6
13.1
19.3
1.1
0.5
2008
124
154
0.53
0.51
20.8
25.8
23.2
23.4
0.008
0.014
27.2
37.5
21.6
18.2
1.0
0.8
2007
109
130
0.60
0.55
20.3
26.2
21.1
22.3
0.010
0.016
N/A
N/A
N/A
N/A
1.4
1.1
2006
119
134
0.76
0.62
21.4
25.5
19.9
22.2
0.005
0.009
N/A
N/A
N/A
N/A
1.7
0.9
2005
108
134
0.74
0.69
24.3
26.7
20.5
20.8
0.011
0.015
N/A
N/A
N/A
N/A
2.7
1.8
2004
125
142
0.56
0.77
28.0
29.7
22.9
24.4
0.012
0.019
N/A
N/A
N/A
N/A
2.0
2.4
2003
130
147
0.83
0.96
28.1
32.4
22.4
23.0
0.032
0.027
N/A
N/A
N/A
N/A
1.1
1.4
2002
120
154
0.90
1.03
29.6
36.0
22.2
21.5
0.011
0.022
N/A
N/A
N/A
N/A
2.8
2.1
2001
124
143
0.81
1.09
30.3
36.9
21.5
18.9
0.011
0.028
N/A
N/A
N/A
N/A
3.3
1.3
2000
142
151
0.71
1.20
31.5
36.8
19.6
19.4
0.018
0.025
N/A
N/A
N/A
N/A
2.0
0.8
Natural disasters
Type
Long Beach
Glendale
Tornado activity compared to U.S. average
18.3%
16.5%
Earthquake activity compared to U.S. average
6,875.1%
7,228.9%
Natural disasters compared to U.S. average
57%
57%
Transportation
Long Beach enjoys access to a larger public transit system, including metro rail, buses, and a bike share program, with greater accessibility to Los Angeles and other parts of the county. Glendale, while having a robust bus network and connections to the greater Los Angeles Metro rail system, is somewhat less convenient for those heavily reliant on public transit.
Transport
Type
Long Beach
Glendale
Amtrak stations
1
1
Amtrak stations nearby
3
3
FAA registered aircraft
312
76
FAA registered aircraft manufacturers and dealers
29
3
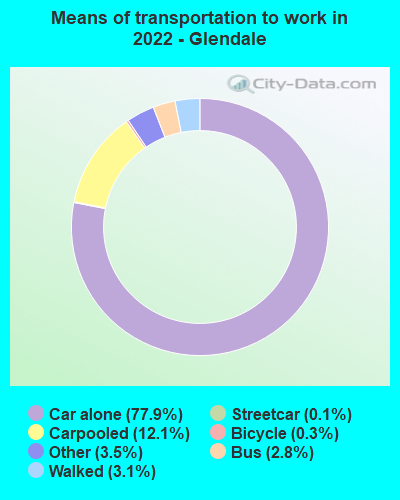
Means of transportation to work
Type
Long Beach
Glendale
Bicycle
0.5%
0.5%
Bus
3.3%
2.6%
Carpooled
9.8%
9.5%
Car alone
81.8%
81.7%
Motorcycle
0.2%
0.1%
Railroad
0%
0.2%
Subway
0.5%
0.1%
Walked
2.8%
3.4%
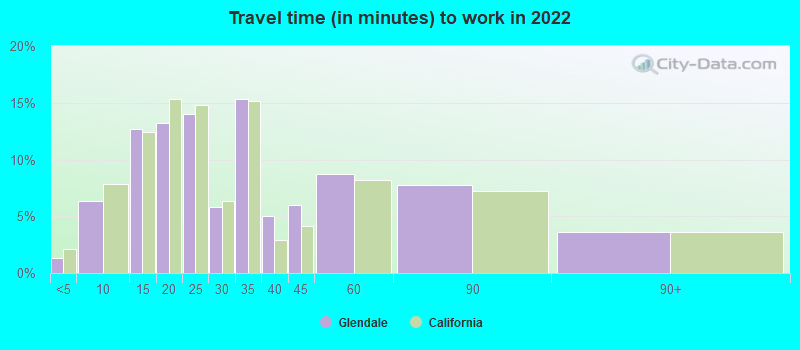
Average travel time to work
Type
Long Beach
Glendale
Average
30.7 min
29.8 min
Other means
28.5 min
28 min
Public transportation
46.4 min
45 min
Private vehicle occupancy
Type
Long Beach
Glendale
Average
1.1
1.1
Drove alone
89.7%
94.8%
In 2 person carpool
8.5%
4%
In 3 person carpool
1.4%
0.5%
In 4 person carpool
0.3%
0.3%
In 5-6 person carpool
0%
0.4%
How many people usually rode to work in the car, truck or van.
Real Estate
Real estate pricing in both Long Beach and Glendale is higher than the national average, reflective of the overall state trend. Glendale often experiences higher real estate prices than Long Beach, largely due to its proximity to central Los Angeles. The options are diverse in both areas, offering a mix of residential homes, apartments, and luxury properties.
Neighborhoods
Both cities offer diverse neighborhood offerings. Long Beach is known for its seaside charm and offers a mix of beachside, downtown, and suburban neighborhoods, each with their distinct character. Glendale is touted for its comfortable suburban living and offers a mix of residential neighborhoods with access to parks, dining, and shopping.
Houses and residents
Type
Long Beach
Glendale
Houses
179,856
76,220
Average household size (people)
2.8
2.6
Median year apartment built
1964
1971
Median year house/condo built
1954
1955
Length of stay in the house since moving in
15.7 years
15.8 years
Houses occupied
172,599 (96%)
70,831 (92.9%)
Houses occupied by owners
69,470 (40.2%)
25,211 (35.6%)
Houses occupied by renters
103,129 (59.8%)
45,620 (64.4%)
Median rent asked for vacant for-rent units
$1,057
$1,925
Median monthly housing costs
$1,692
$2,004
Median price asked for vacant for-sale houses and condos
$520,992
$886,794
Estimated median house or condo value
$693,600
$995,700
Median numbers of rooms
4.2
4.5
Median number of rooms in apartments
3.6
4
Median number of rooms in houses and condos
5.5
6
Median house price - detached houses
$900,658
Over $1,000,000
Median house price - in 2-unit structures
$823,515
$692,572
Median house price - in 3-to-4-unit structures
$495,928
Over $1,000,000
Median house price - in 5 or more unit structures
$488,399
$790,093
Median house price - Townhouses or other attached units
$634,684
$720,498
Median house price - All housing units
$805,766
Over $1,000,000
Median house age
62
55
Renting percentage
58.4%
61.9%
Housing density (houses/condos per square mile)
3,565.7
2,487.2
House value disparities
21.3%
20.5%
Household income disparities
44.7%
46.1%
Median household income for houses/condes with a mortgage
$116,421
$145,822
Median household income for apartments without a mortgage
$79,392
$86,918
Housing units without a mortgage
394 (0.8%)
313 (1.8%)
Housing units with both a second mortgage and home equity loan
3,069 (6.2%)
1,058 (6%)
Housing units with a mortgage
49,321 (99.2%)
17,459 (98.2%)
Housing units with a home equity loan
48 (0.1%)
128 (0.7%)
Housing units with a second mortgage
3,709 (7.5%)
1,688 (9.5%)
House/condo owner moved in on average (years ago)
15
16
House/condo renter moved in on average (years ago)
3
4
Housing units lacking complete kitchen facilities
2.6%
4.6%
Housing units lacking complete plumbing facilities
0.4%
1%
Housing units in structures
Housing units in structures
Long Beach
Glendale
One, detached
40.2%
33.7%
One, attached
4.9%
3.3%
Two
5.3%
2.0%
3 or 4
8.8%
6.5%
5 to 9
10.4%
14.9%
10 to 19
10.8%
12.4%
20 to 49
8.0%
16.1%
50 or more
10.6%
10.6%
Mobile homes
0.8%
0.4%
Boats, RVs, vans, etc.
0.2%
0.0%
Median real estate property taxes paid for housing units
Self-employed workers in own not incorporated business
18,532
8,104
State government workers
6,550
2,498
Unpaid family workers
178
49
Industries and Occupations
Some of the top industries in Long Beach include healthcare, arts, entertainment, recreation, and education. In contrast, Glendale's economy is largely driven by the entertainment industry, financial services, and healthcare. Occupations in both cities are reflective of these dominant industries, with a diverse range of job opportunities available in both.
Health diagnosing and treating practitioners and other technical occupations
4.9%
7.6%
Community and social service occupations
4.4%
2.4%
Personal care and service occupations
3.6%
3.2%
Arts, design, entertainment, sports, and media occupations
3.0%
6.1%
Building and grounds cleaning and maintenance occupations
2.9%
2.8%
Health technologists and technicians
2.8%
2.7%
Material moving occupations
2.8%
0.1%
Production occupations
2.7%
1.3%
Computer and mathematical occupations
1.9%
0.8%
Transportation occupations
1.4%
0.4%
Life, physical, and social science occupations
1.3%
1.0%
Legal occupations
1.3%
3.7%
Health Care
Long Beach and Glendale offer comprehensive health care facilities. Long Beach has a large public health infrastructure, including the Long Beach Memorial Medical Center. Glendale has Adventist Health and the Glendale Memorial Hospital, among other facilities. Both cities are highly rated for healthcare accessibility and quality.
Both cities boast robust and well-developed infrastructures. Long Beach, known for its port, offers a beach city layout with a diverse array of residential, business and industrial areas. Glendale, on the other hand, is well planned and has a more suburban feel with comfortable residential areas, a bustling downtown and well-kept parks.
HMDA - Conventional home purchase loans - Applications denied
Year
Long Beach
Glendale
1999
1,159
441
2000
710
398
2001
677
285
2002
708
311
2003
1,861
435
2004
2,162
532
2005
3,065
745
2006
3,591
924
2007
2,287
695
2008
887
348
2009
475
151
Culture and Food
Both Long Beach and Glendale have a vibrant cultural scene and a vibrant food scene reflective of their diverse populations. Long Beach, with its seaside location, offers a range of seafood and international fare, while Glendale, known for its Armenian community, offers an eclectic mix of Armenian and other international cuisines.
Sports Teams
While Long Beach doesn't have any major professional sports teams, it's proximity to Los Angeles gives residents easy access to the Lakers, Dodgers, Rams and more. Glendale, also benefits from its proximity to L.A. and additionally hosts a few minor league and college sports teams.


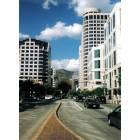


 Long Beach, CA
 Glendale, CA