Long Beach and Jurupa Valley, California, offer unique living experiences with their distinct characteristics. Located on the Pacific Ocean, Long Beach boasts seaside attractions and a hustling-bustling lifestyle, while Jurupa Valley, nestled beside the Santa Ana River, offers a tranquil semi-rural living environment. Although these two cities are not apart from each other, a comparison between them sheds light on varying crime rates, weather conditions, cost of living, educational opportunities, economic growth, infrastructural development, employment sectors, housing market, neighborhoods, transportation facilities, tax structures, cultural richness, sports landscape, geographical features, and health care facilities.
In terms of crime and safety, Long Beach records higher crime rates than Jurupa Valley, which is relatively safer. This is particularly noticeable in property crimes, where Long Beach's rates are significantly higher. However, both cities have police departments that continually work towards improving safety and reducing crime rates.
Cost of Living
Living in Long Beach is more costly than in Jurupa Valley. In terms of housing, groceries, transportation, and utilities, Long Beach tend to be pricier, while Jurupa Valley is considered more affordable, making it a good alternative for those on a budget.
Income Tax
California imposes the same income tax rate on residents, irrespective of their city. Hence, residents of both Long Beach and Jurupa Valley are governed by the same state income tax structure.
Property Tax
The average property tax rate in Long Beach is slightly higher than that in Jurupa Valley, reflecting the higher property values in Long Beach.
Sales Tax
Both Long Beach and Jurupa Valley have a sales tax rate of 7.25%, which is the same as the statewide average in California.
Income
Type
Long Beach
Jurupa
Estimated median household income
$73,905
$80,697
Estimated per capita income
$37,217
$26,950
Cost of living index (U.S. average is 100)
142
86.5
If you make $50,000 in Jurupa, you will have to make $82,081 in Long Beach to maintain the same standard of living.
Geographical Conditions
Long Beach is a coastal city, providing beachside living and panoramic ocean views, and is relatively flat. On the contrary, Jurupa Valley is located inland and features rolling hills, offering an agricultural and semi-rural ambiance.
Geographical information
Type
Long Beach
Jurupa
Land area
50.4 sq. miles
60.8 sq. miles
Population density
9,041.5 people per sq. mile
1,847.2 people per sq. mile
Relative area comparison
Long Beach, CA Jurupa, CA
Education
There are more educational opportunities in Long Beach due to its larger size and population. It is home to the well-respected California State University, Long Beach, and Long Beach City College. Jurupa Valley offers quality education through Riverside County School District but lacks higher learning institutions within the city.
Long Beach has a diversified economy, with sectors like healthcare, education, logistics, and aerospace playing vital roles. Conversely, Jurupa Valley's economy is less diverse, with a significant focus on retail trade and construction.
Biggest Employers
Long Beach's biggest employers are Long Beach Memorial Medical Center, Long Beach Unified School District, and the City of Long Beach. Jurupa Valley's largest employer is the Jurupa Unified School District.
In Long Beach (Los Angeles County), 69.7% voted for Democrats and 27.8% for Republicans in 2012 Presidential Election. In Jurupa (Riverside County), 49.6% voted for Democrats and 48.0% for Republicans.
Elections
Type
Democrats
Republicans
Other
Year
Long Beach
Jurupa
Long Beach
Jurupa
Long Beach
Jurupa
2020
71.0%
53.0%
26.9%
45.0%
2.1%
2.0%
2016
72.0%
49.7%
22.5%
44.4%
5.5%
5.9%
2012
69.7%
49.6%
27.8%
48.0%
2.4%
2.4%
2008
69.2%
50.4%
28.8%
48.1%
1.9%
1.5%
2004
63.3%
41.3%
35.7%
58.2%
1.0%
0.6%
2000
63.6%
45.0%
32.4%
51.6%
4.0%
3.4%
1996
59.3%
43.0%
31.0%
45.6%
9.7%
11.3%
Breakdown of population affiliated with a religious congregation
Type
Adherents
Congregations
Religion
Long Beach
Jurupa
Long Beach
Jurupa
CATHOLIC CHURCH
36.1%
27.5%
4.7%
4.5%
SOUTHERN BAPTIST CONVENTION
1.0%
1.2%
9.0%
11.2%
MUSLIM ESTIMATE
0.7%
0.5%
1.0%
0.7%
AMERICAN BAPTIST CHURCHES IN THE USA
0.5%
0.0%
3.1%
0.7%
SEVENTH DAY ADVENTIST CHURCH
0.5%
0.9%
2.4%
3.4%
EPISCOPAL CHURCH
0.4%
0.2%
1.4%
1.4%
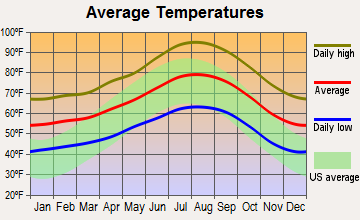
Weather
Long Beach enjoys a Mediterranean climate with warm, dry summers, and cool, wet winters. It offers sunshine nearly all year round, which is perfect for beach activities. On the other hand, Jurupa Valley experiences a semi-arid climate, with hotter summers and milder winters compared to Long Beach, nonetheless, the weather is still quite pleasant for outdoor activities.
Weather and climate
Type
Long Beach
Jurupa
Temperature - Average
65.3°F
65.7°F
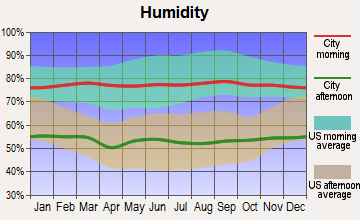
Humidity - Average morning or afternoon humidity
70.4%
66.8%
Humidity - Differences between morning and afternoon humidity
27%
21.6%
Humidity - Maximum monthly morning or afternoon humidity
79%
73.7%
Humidity - Minimum monthly morning or afternoon humidity
52%
52.1%
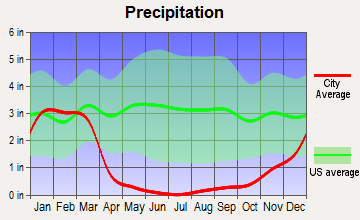
Precipitation - Yearly average
13.1 in
13.4 in
Snowfall - Yearly average
0 in
0 in
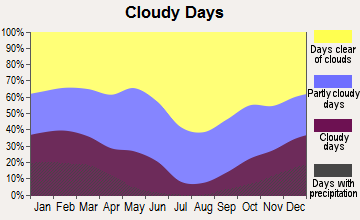
Clouds - Number of days clear of clouds
26.4%
27.4%
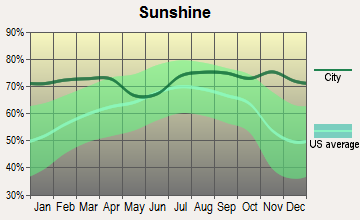
Sunshine amount - Average
78.4%
78.3%
Sunshine amount - Differences during a year
22%
21.8%
Sunshine amount - Maximum monthly
85%
84.6%
Sunshine amount - Minimum monthly
63%
62.8%
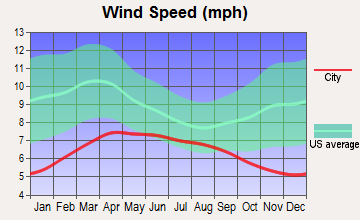
Wind speed - Average
6.1 mph
4.6 mph
Average climate in Long Beach, California
Average climate in Jurupa, California
Air pollution
Type
AQI
CO
NO2
OZONE
PB
PM10
PM25
SO2
Year
Long Beach
Jurupa
Long Beach
Jurupa
Long Beach
Jurupa
Long Beach
Jurupa
Long Beach
Jurupa
Long Beach
Jurupa
Long Beach
Jurupa
Long Beach
Jurupa
2018
124
153
0.37
0.28
17.2
13.7
22.1
29.9
0.008
0.006
27.5
51.8
13.5
15.1
0.7
0.4
2017
122
152
0.36
0.28
18.1
13.3
23.2
30.4
0.007
0.004
26.7
57.2
14.5
15.6
0.8
0.3
2016
115
140
0.36
0.25
18.5
13.7
21.9
30.6
0.007
0.006
24.1
51.8
11.6
16.5
0.9
0.3
2015
111
148
0.38
0.25
19.9
13.5
22.5
29.9
0.005
0.004
25.0
51.3
13.9
18.5
0.9
0.3
2014
127
148
0.50
0.25
20.3
13.9
22.0
30.1
0.007
0.006
26.7
56.9
14.3
18.7
1.3
0.3
2013
126
148
0.48
0.21
20.0
14.0
24.7
28.9
0.005
0.006
32.3
54.8
14.6
18.3
1.0
0.2
2012
132
148
0.48
0.25
19.3
14.5
24.4
29.2
0.004
0.007
30.8
53.0
14.1
20.1
0.6
0.3
2011
119
150
0.43
0.35
20.2
15.1
23.4
30.4
0.006
0.006
28.4
49.6
15.6
22.0
1.2
0.4
2010
115
145
0.38
0.39
20.8
15.4
22.7
29.7
0.011
0.008
24.1
42.6
11.9
20.5
0.7
1.2
2009
132
153
0.50
0.36
21.0
16.7
22.0
27.8
0.008
0.009
27.7
38.4
13.1
18.9
1.1
1.4
2008
124
164
0.53
0.31
20.8
18.2
23.2
29.4
0.008
0.009
27.2
42.7
21.6
18.7
1.0
1.0
2007
109
138
0.60
0.65
20.3
21.5
21.1
28.0
0.010
0.011
N/A
N/A
N/A
N/A
1.4
1.6
2006
119
129
0.76
0.58
21.4
22.2
19.9
27.6
0.005
0.005
N/A
N/A
N/A
N/A
1.7
1.5
2005
108
134
0.74
0.54
24.3
24.1
20.5
27.0
0.011
0.012
N/A
N/A
N/A
N/A
2.7
3.1
2004
125
143
0.56
0.73
28.0
20.0
22.9
29.0
0.012
0.013
N/A
N/A
N/A
N/A
2.0
2.8
2003
130
144
0.83
0.74
28.1
24.2
22.4
27.9
0.032
0.013
N/A
N/A
N/A
N/A
1.1
1.9
2002
120
142
0.90
0.80
29.6
26.5
22.2
27.9
0.011
0.015
N/A
N/A
N/A
N/A
2.8
0.3
2001
124
147
0.81
0.79
30.3
27.4
21.5
25.4
0.011
0.025
N/A
N/A
N/A
N/A
3.3
1.0
2000
142
158
0.71
0.82
31.5
26.3
19.6
24.5
0.018
0.031
N/A
N/A
N/A
N/A
2.0
1.3
Natural disasters
Type
Long Beach
Jurupa
Tornado activity compared to U.S. average
18.3%
17.7%
Earthquake activity compared to U.S. average
6,875.1%
7,347.7%
Natural disasters compared to U.S. average
57%
46%
Transportation
Long Beach boasts an effective public transportation system that includes buses, light rails, and water taxis, and it's also served by the Long Beach Airport. Jurupa Valley mainly relies on road transportation, with access to several major highways for commuting.
Transport
Type
Long Beach
Jurupa
Amtrak stations
1
0
Amtrak stations nearby
3
3
FAA registered aircraft
312
0
FAA registered aircraft manufacturers and dealers
29
0
Means of transportation to work
Type
Long Beach
Jurupa
Bicycle
0.5%
0.3%
Bus
3.3%
0.8%
Carpooled
9.8%
20.4%
Car alone
81.8%
72.4%
Motorcycle
0.2%
0.3%
Railroad
0%
0.5%
Subway
0.5%
0%
Walked
2.8%
1.1%
Average travel time to work
Type
Long Beach
Jurupa
Average
30.7 min
33.3 min
Real Estate
The real estate market in Long Beach is considerably more expensive than in Jurupa Valley, reflecting its higher cost of living. Housing options in Long Beach range from beachfront condos to suburban-style homes. Jurupa Valley, however, offers more affordable housing, primarily consisting of single-family homes.
Neighborhoods
Long Beach is known for its diverse neighborhoods, each with its unique character, from the bustling Downtown area to the serene Alamitos Bay. Jurupa Valley has largely suburban neighborhoods offering a quiet and peaceful environment.
Houses and residents
Type
Long Beach
Jurupa
Houses
179,856
24,828
Average household size (people)
2.8
3.9
Houses occupied
172,599 (96%)
23,695 (95.4%)
Houses occupied by owners
69,470 (40.2%)
16,891 (71.3%)
Houses occupied by renters
103,129 (59.8%)
6,804 (28.7%)
Median rent asked for vacant for-rent units
$1,057
$1,354
Median price asked for vacant for-sale houses and condos
$520,992
$464,486
Estimated median house or condo value
$693,600
$459,195
Median number of rooms in apartments
3.6
4.3
Median number of rooms in houses and condos
5.5
6.2
Renting percentage
58.4%
27.7%
Housing density (houses/condos per square mile)
3,565.7
408.7
Household income disparities
44.7%
41.2%
Housing units without a mortgage
394 (0.8%)
1,818 (12.7%)
Housing units with both a second mortgage and home equity loan
3,069 (6.2%)
8 (0.1%)
Housing units with a mortgage
49,321 (99.2%)
12,451 (87.3%)
Housing units with a home equity loan
48 (0.1%)
740 (5.2%)
Housing units with a second mortgage
3,709 (7.5%)
2,211 (15.5%)
Housing units lacking complete kitchen facilities
2.6%
1.1%
Housing units lacking complete plumbing facilities
Self-employed workers in own not incorporated business
18,532
2,794
State government workers
6,550
806
Unpaid family workers
178
147
Industries and Occupations
In Long Beach, the largest industries are healthcare, education, and trade, with healthcare professionals, educators, and retail workers dominating. In Jurupa Valley, the primary industries are retail trade and construction, hence, jobs are mainly concentrated in these areas.
Long Beach offers more extensive health care options with several hospitals and clinics. Jurupa Valley provides necessary health services but residents might need to travel to nearby larger cities for specialized medical care.
Health (county statistics)
Type
Long Beach
Jurupa
General health status score of residents in this county from 1 (poor) to 5 (excellent)
As a larger metropolitan area, Long Beach boasts superior infrastructure, including a bustling port, a number of hospitals, and various entertainment options. Jurupa Valley, being a newer and smaller city, doesn't offer the same level of infrastructure but has essential amenities and is rapidly developing.
Infrastructure
Type
Long Beach
Jurupa
TV stations
5
8
Schools
School facilities
Type
Long Beach
Jurupa
Private elementary/middle schools
24
0
Private high schools
8
0
Public elementary/middle schools
61
20
Public high schools
14
7
Colleges/Universities
7
0
Culture and Food
Long Beach has a vibrant cultural scene with a wide array of restaurants, theatres, and music festivals. Jurupa Valley has a smaller, yet growing, cultural scene with a focus on local traditions and is known for its Mexican cuisine.
Sports Teams
Long Beach doesn't have major sports teams but is close to Los Angeles, home to many. Jurupa Valley, being a smaller city, doesn't host significant sports teams but residents often support Los Angeles-based teams.
 Long Beach, CA
 Jurupa, CA