Long Beach and Moreno Valley are two distinct cities in Southern California. Long Beach is a bustling urban shoreline metropolis, while Moreno Valley presents a comfortable suburban ambiance. The differences are dense, from crime rates, weather, cost of living, to culture, food, and sports. When considering relocating or visiting, it's important to understand these differences to make an informed decision. The following comparison provides in-depth information, shedding light on what to expect in these cities.
Distance between
Long Beach, CA and
Moreno Valley, CA : 54.0 miles
Long Beach's population is larger by 116%. Its population has decreased by 5,460 people (1.2%) since 2000. The population of Moreno Valley has grown by 69,219 people (48.6%) during that time.
In comparison to national averages, both Long Beach and Moreno Valley have higher crime rates, but Long Beach's are considerably higher. While both cities place significant focus on community safety measures, Long Beach's urban density contributes to higher crime rates. Statistics show that Moreno Valley is safer than 32% of the cities in the United States, while Long Beach is 7% safer. For tourists, it's best to be aware of the surroundings and abide by standard safety procedures.
City-data.com crime index counts serious crimes and violent crime more heavily. It adjusts for the number of visitors and daily workers commuting into cities. (higher means more crime, U.S. average = 301.1)
City-data.com crime index counts serious crimes and violent crime more heavily. It adjusts for the number of visitors and daily workers commuting into cities. (higher means more crime, U.S. average = 301.1)
Sex Offenders
According to our data, there are 807 registered sex offenders living in Long Beach and 306 registered sex offenders living in . The ratio of residents to sex offenders in Long Beach is 583 to 1; the ratio in Moreno Valley is 672 to 1. The number of registered sex offenders compared to the number of residents in Long Beach is near to than in Moreno Valley.
Cost of Living
Living in Long Beach is generally more expensive than Moreno Valley. Housing costs are significantly higher in Long Beach, as are the prices for goods and services. However, the median household income in Long Beach is also higher than in Moreno Valley, somewhat balancing these costs. Those contemplating relocation should consider their income against these costs.
Income Tax
California has a progressive income tax and applies to residents in both cities. The tax is based on income level with the highest bracket taxed at 13.3%. This is a uniform rate across the state.
Property Tax
Property tax rates in these cities are near California's average of 0.77%. However, due to higher property values in Long Beach, homeowners may end up paying more annually.
Sales Tax
Both cities operate under California's sales tax system. The rate for Long Beach is 10.25%, while Moreno Valley has a rate of 7.75%. This difference can mount over time and should be considered when calculating the cost of living.
Income
Type
Long Beach
Moreno Valley
Estimated median household income
$73,905
$79,840
Estimated per capita income
$37,217
$25,319
Cost of living index (U.S. average is 100)
142
82.3
If you make $50,000 in Moreno Valley, you will have to make $86,270 in Long Beach to maintain the same standard of living.
Geographical Conditions
Long Beach is coastal with a flat terrain, beautiful beaches, and waterfront amenities. Moreno Valley is inland, surrounded by rolling hills and offers great outdoor activities such as hiking and camping. Depending on personal preference, these geographical conditions can be a major attraction.
Both cities have a range of educational opportunities. Long Beach is home to California State University, Long Beach, and a robust public school system. In contrast, Moreno Valley offers a variety of solid public and charter schools served by the Moreno Valley Unified School District. For education-centric families, both cities offer diverse options.
Long Beach has a broad economy with a strong presence in healthcare, aerospace, and the port industry. Moreno Valley's economy is smaller but diverse, with sectors like healthcare and logistics offering the most employment. Job growth rates are positive for both cities, but Long Beach offers higher paying opportunities.
Biggest Employers
In Long Beach, top employers include Long Beach Memorial Medical Center, Long Beach Unified School District, and Boeing. Moreno Valley's leading employers are the Moreno Valley Unified School District, the County of Riverside, and Amazon. These employers not only add to the cities' economies, but also provide substantial contributions to their communities.
There were 304 building permits issued in Long Beach in 2012 (238 more than in 2011) compared to 377 building permits issued in Moreno Valley in 2012 (354 more than in 2011).
In Long Beach (Los Angeles County), 69.7% voted for Democrats and 27.8% for Republicans in 2012 Presidential Election. In Moreno Valley (Riverside County), 49.6% voted for Democrats and 48.0% for Republicans.
Elections
Type
Democrats
Republicans
Other
Year
Long Beach
Moreno Valley
Long Beach
Moreno Valley
Long Beach
Moreno Valley
2020
71.0%
53.0%
26.9%
45.0%
2.1%
2.0%
2016
72.0%
49.7%
22.5%
44.4%
5.5%
5.9%
2012
69.7%
49.6%
27.8%
48.0%
2.4%
2.4%
2008
69.2%
50.4%
28.8%
48.1%
1.9%
1.5%
2004
63.3%
41.3%
35.7%
58.2%
1.0%
0.6%
2000
63.6%
45.0%
32.4%
51.6%
4.0%
3.4%
1996
59.3%
43.0%
31.0%
45.6%
9.7%
11.3%
Breakdown of population affiliated with a religious congregation
Type
Adherents
Congregations
Religion
Long Beach
Moreno Valley
Long Beach
Moreno Valley
CATHOLIC CHURCH
36.1%
27.5%
4.7%
4.5%
SOUTHERN BAPTIST CONVENTION
1.0%
1.2%
9.0%
11.2%
MUSLIM ESTIMATE
0.7%
0.5%
1.0%
0.7%
AMERICAN BAPTIST CHURCHES IN THE USA
0.5%
0.0%
3.1%
0.7%
SEVENTH DAY ADVENTIST CHURCH
0.5%
0.9%
2.4%
3.4%
EPISCOPAL CHURCH
0.4%
0.2%
1.4%
1.4%
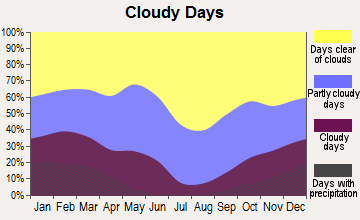
Weather
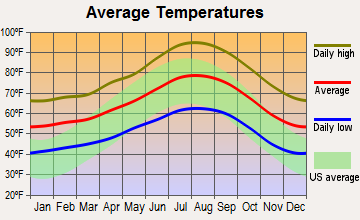
Both cities share a similar Mediterranean climate, characterized by warm, dry summers and mild, wet winters. However, Long Beach, being coastal, has a more temperate climate with cooler summers and slightly warmer winters than Moreno Valley. Moreno Valley has a hotter summer, with temperatures reaching the high 90s. For those looking for year-round beach weather, Long Beach would be more suitable.
Weather and climate
Type
Long Beach
Moreno Valley
Temperature - Average
65.3°F
65.1°F
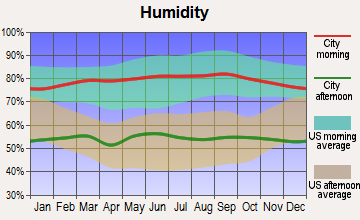
Humidity - Average morning or afternoon humidity
70.4%
66.7%
Humidity - Differences between morning and afternoon humidity
27%
21.1%
Humidity - Maximum monthly morning or afternoon humidity
79%
73.3%
Humidity - Minimum monthly morning or afternoon humidity
52%
52.3%
Precipitation - Yearly average
13.1 in
11.6 in
Snowfall - Yearly average
0 in
0 in
Clouds - Number of days clear of clouds
26.4%
27.3%
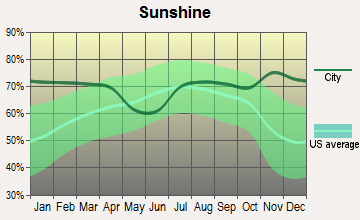
Sunshine amount - Average
78.4%
78%
Sunshine amount - Differences during a year
22%
20.8%
Sunshine amount - Maximum monthly
85%
83%
Sunshine amount - Minimum monthly
63%
62.2%
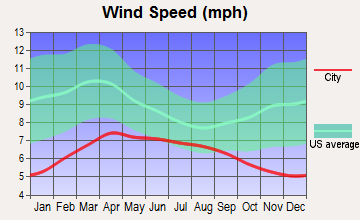
Wind speed - Average
6.1 mph
4.5 mph
Average climate in Long Beach, California
Average climate in Moreno Valley, California
Air pollution
Type
AQI
CO
NO2
OZONE
PB
PM10
PM25
SO2
Year
Long Beach
Moreno Valley
Long Beach
Moreno Valley
Long Beach
Moreno Valley
Long Beach
Moreno Valley
Long Beach
Moreno Valley
Long Beach
Moreno Valley
Long Beach
Moreno Valley
Long Beach
Moreno Valley
2018
124
154
0.37
0.33
17.2
12.3
22.1
33.4
0.008
0.006
27.5
35.0
13.5
11.6
0.7
0.4
2017
122
145
0.36
0.34
18.1
12.2
23.2
35.1
0.007
0.004
26.7
37.6
14.5
13.2
0.8
0.3
2016
115
143
0.36
0.34
18.5
12.4
21.9
33.4
0.007
0.006
24.1
36.8
11.6
12.9
0.9
0.3
2015
111
145
0.38
0.32
19.9
12.2
22.5
33.2
0.005
0.004
25.0
34.7
13.9
13.7
0.9
0.3
2014
127
146
0.50
0.35
20.3
14.4
22.0
33.1
0.007
0.006
26.7
37.2
14.3
15.6
1.3
0.3
2013
126
150
0.48
0.35
20.0
14.7
24.7
32.7
0.005
0.006
32.3
35.7
14.6
14.4
1.0
0.3
2012
132
145
0.48
0.33
19.3
15.2
24.4
32.6
0.004
0.007
30.8
34.4
14.1
15.2
0.6
0.3
2011
119
149
0.43
0.34
20.2
15.3
23.4
33.0
0.006
0.006
28.4
34.4
15.6
16.6
1.2
0.4
2010
115
146
0.38
0.37
20.8
16.4
22.7
32.5
0.011
0.008
24.1
31.5
11.9
15.8
0.7
1.2
2009
132
151
0.50
0.34
21.0
17.8
22.0
32.1
0.008
0.010
27.7
35.0
13.1
17.0
1.1
1.4
2008
124
156
0.53
0.38
20.8
18.1
23.2
32.6
0.008
0.011
27.2
41.2
21.6
15.7
1.0
1.1
2007
109
127
0.60
0.55
20.3
19.0
21.1
31.3
0.010
0.013
N/A
N/A
N/A
N/A
1.4
1.6
2006
119
129
0.76
0.51
21.4
19.7
19.9
30.6
0.005
0.007
N/A
N/A
N/A
N/A
1.7
1.5
2005
108
131
0.74
0.50
24.3
21.1
20.5
27.5
0.011
0.012
N/A
N/A
N/A
N/A
2.7
3.0
2004
125
140
0.56
0.63
28.0
18.1
22.9
31.3
0.012
0.013
N/A
N/A
N/A
N/A
2.0
2.7
2003
130
144
0.83
0.78
28.1
21.7
22.4
31.9
0.032
0.021
N/A
N/A
N/A
N/A
1.1
1.8
2002
120
142
0.90
0.79
29.6
22.9
22.2
31.3
0.011
0.016
N/A
N/A
N/A
N/A
2.8
0.4
2001
124
147
0.81
0.79
30.3
24.2
21.5
30.8
0.011
0.039
N/A
N/A
N/A
N/A
3.3
1.0
2000
142
157
0.71
0.83
31.5
23.4
19.6
28.2
0.018
0.034
N/A
N/A
N/A
N/A
2.0
1.4
Natural disasters
Type
Long Beach
Moreno Valley
Tornado activity compared to U.S. average
18.3%
16.4%
Earthquake activity compared to U.S. average
6,875.1%
7,327.3%
Natural disasters compared to U.S. average
57%
46%
Transportation
Both cities have comprehensive public transportation systems. Long Beach Transit provides bus and water taxi services, while Moreno Valley offers bus service through the Riverside Transit Agency. Both cities are linked to wider Southern California via extensive freeway networks, making commuting accessible in both cities.
Transport
Type
Long Beach
Moreno Valley
Amtrak stations
1
1
Amtrak stations nearby
3
3
FAA registered aircraft
312
27
FAA registered aircraft manufacturers and dealers
29
2
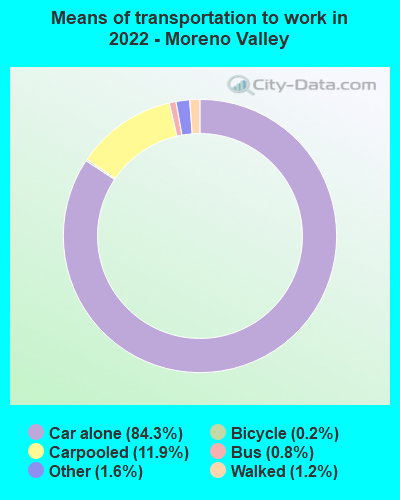
Means of transportation to work
Type
Long Beach
Moreno Valley
Bicycle
0.5%
0.1%
Bus
3.3%
1.2%
Carpooled
9.8%
11.2%
Car alone
81.8%
84.7%
Motorcycle
0.2%
0.3%
Streetcar
0.1%
0.1%
Subway
0.5%
0%
Walked
2.8%
1.2%
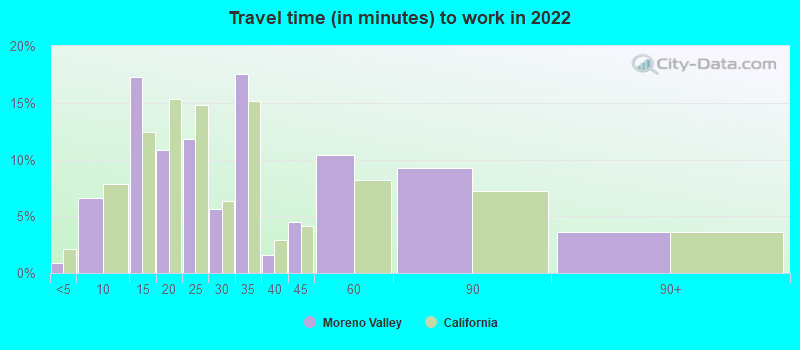
Average travel time to work
Type
Long Beach
Moreno Valley
Average
30.7 min
29.1 min
Other means
28.5 min
34.1 min
Public transportation
46.4 min
55.2 min
Private vehicle occupancy
Type
Long Beach
Moreno Valley
Average
1.1
1.2
Drove alone
89.7%
84.3%
In 2 person carpool
8.5%
12.3%
In 3 person carpool
1.4%
2.7%
In 4 person carpool
0.3%
0.4%
In 5-6 person carpool
0%
0.1%
In 7+ person carpool
0%
0.2%
How many people usually rode to work in the car, truck or van.
Real Estate
Real estate in Long Beach tends to be more expensive than Moreno Valley due to its coastal location and diverse amenities. Moreno Valley, with its suburban ambiance, provides more affordable options for families. Potential buyers and renters should navigate the market carefully to find options that suit their budget and lifestyle.
Neighborhoods
Long Beach offers a diverse mix of neighborhoods from the affluent Naples and Belmont Shore to the culturally rich East Village. Moreno Valley has planned communities such as Rancho Belago that offer suburban living with numerous amenities. Each city has neighborhoods that cater to a diverse range of demographic and lifestyle preferences.
Houses and residents
Type
Long Beach
Moreno Valley
Houses
179,856
55,128
Average household size (people)
2.8
3.7
Median year apartment built
1964
1990
Median year house/condo built
1954
1987
Length of stay in the house since moving in
15.7 years
13.4 years
Houses occupied
172,599 (96%)
54,104 (98.1%)
Houses occupied by owners
69,470 (40.2%)
33,152 (61.3%)
Houses occupied by renters
103,129 (59.8%)
20,952 (38.7%)
Median rent asked for vacant for-rent units
$1,057
$1,620
Median monthly housing costs
$1,692
$1,773
Median price asked for vacant for-sale houses and condos
$520,992
$478,171
Estimated median house or condo value
$693,600
$422,500
Median numbers of rooms
4.2
5.9
Median number of rooms in apartments
3.6
4.9
Median number of rooms in houses and condos
5.5
6.3
Median house price - detached houses
$900,658
$408,231
Median house price - in 2-unit structures
$823,515
Over $1,000,000
Median house price - in 3-to-4-unit structures
$495,928
$287,962
Median house price - in 5 or more unit structures
$488,399
$227,600
Median house price - mobile homes
$333,777
$77,425
Median house price - Townhouses or other attached units
$634,684
$416,724
Median house price - All housing units
$805,766
$396,904
Median house age
62
33
Renting percentage
58.4%
35.3%
Housing density (houses/condos per square mile)
3,565.7
1,076.1
House value disparities
21.3%
18.2%
Household income disparities
44.7%
37.8%
Median household income for houses/condes with a mortgage
$116,421
$96,852
Median household income for apartments without a mortgage
$79,392
$72,290
Housing units without a mortgage
394 (0.8%)
207 (0.8%)
Housing units with both a second mortgage and home equity loan
3,069 (6.2%)
1,146 (4.3%)
Housing units with a mortgage
49,321 (99.2%)
26,147 (99.2%)
Housing units with a home equity loan
48 (0.1%)
24 (0.1%)
Housing units with a second mortgage
3,709 (7.5%)
1,290 (4.9%)
House/condo owner moved in on average (years ago)
15
13
House/condo renter moved in on average (years ago)
3
4
Housing units lacking complete kitchen facilities
2.6%
1.7%
Housing units lacking complete plumbing facilities
0.4%
0.1%
Housing units in structures
Housing units in structures
Long Beach
Moreno Valley
One, detached
40.2%
79.5%
One, attached
4.9%
2.4%
Two
5.3%
0.7%
3 or 4
8.8%
2.2%
5 to 9
10.4%
5.6%
10 to 19
10.8%
2.7%
20 to 49
8.0%
1.5%
50 or more
10.6%
3.3%
Mobile homes
0.8%
1.9%
Boats, RVs, vans, etc.
0.2%
0.0%
Median real estate property taxes paid for housing units
Self-employed workers in own not incorporated business
18,532
4,730
State government workers
6,550
1,746
Unpaid family workers
178
181
Industries and Occupations
Long Beach has a diverse economy with industries ranging from healthcare and tourism to aerospace and technology. Moreno Valley also has a variety of industries, but is largely dominated by the logistics, healthcare, and retail sectors. The diversity in both cities offers numerous opportunities for professionals in various fields.
Long Beach boasts impressive infrastructure, with a mix of residential and commercial areas complemented by extensive public spaces. Moreno Valley offers a more suburban feel, with infrastructure catering more towards residential needs. Both cities have a strong commitment to developing sustainable and efficient infrastructure.
Infrastructure
Type
Long Beach
Moreno Valley
Hospitals
17
8
TV stations
5
5
Bank branches located here
67
15
Bank institutions located here
18
7
Drinking water stations with no reported violations in the past
2
1
Drinking water stations with reported violations in the past
HMDA - Conventional home purchase loans - Applications denied
Year
Long Beach
Moreno Valley
1999
1,159
253
2000
710
0
2001
677
0
2002
708
0
2003
1,861
1,150
2004
2,162
1,936
2005
3,065
2,705
2006
3,591
2,993
2007
2,287
1,542
2008
887
599
2009
475
269
Culture and Food
Long Beach boasts a vibrant cultural scene with diverse food options, numerous festivals, and a rich arts scene. Moreno Valley, while smaller, offers a variety of cultural events and food options that reflect its diverse population. Both cities cater to tastes ranging from global gourmet to local delicacies.
Sports Teams
As part of the Greater Los Angeles area, Long Beach residents support regional teams like the Lakers (NBA), Kings (NHL), Dodgers (MLB), and Rams and Chargers (NFL). Moreno Valley, also being part of the Southern California region, supports the same teams.


 Long Beach, CA
 Moreno Valley, CA