Long Beach and Orange are two vibrant cities in Southern California, each boasting a unique quality of life. While Long Beach provides a high-energy, urban lifestyle with a strong maritime heritage, Orange caters to those looking for a more suburban ambiance and historical charm. However, these two cities offer different experiences in terms of crime and safety, weather, cost of living, education, economy, infrastructure, and more. This comprehensive comparison will provide useful insights for individuals considering a move, and for those planning to visit as tourists.
Distance between
Long Beach, CA and
Orange, CA : 18.7 miles
Long Beach's population is larger by 232%. Its population has decreased by 5,460 people (1.2%) since 2000. The population of Orange has grown by 8,443 people (6.6%) during that time.
In terms of crime and safety, Orange generally has a lower crime rate and is considered safer than Long Beach. Long Beach, being a larger city, struggles with higher crime rates, though it's worth noting that some neighborhoods are safer than others. Both cities have active police departments working towards reducing crime and ensuring safety for residents and visitors.
City-data.com crime index counts serious crimes and violent crime more heavily. It adjusts for the number of visitors and daily workers commuting into cities. (higher means more crime, U.S. average = 301.1)
City-data.com crime index counts serious crimes and violent crime more heavily. It adjusts for the number of visitors and daily workers commuting into cities. (higher means more crime, U.S. average = 301.1)
Sex Offenders
According to our data, there are 807 registered sex offenders living in Long Beach and 127 registered sex offenders living in . The ratio of residents to sex offenders in Long Beach is 583 to 1; the ratio in Orange is 1,106 to 1. The number of registered sex offenders compared to the number of residents is larger in Long Beach than in Orange.
Cost of Living
In terms of cost of living, both cities are higher than the national average, as is common in California. However, Long Beach is generally less expensive than Orange, particularly in terms of housing. It's important to factor in the higher cost of living when considering relocation to either of these cities.
Income Tax
Both Long Beach and Orange, like all Californian cities, follow the state's progressive income tax system. The rates range from 1% to 13.3% based on income level.
Property Tax
In terms of property tax, Long Beach and Orange both adhere to California's property tax rate of approximately 1.1% of assessed home value, although this can vary slightly depending on bond measures and special levies.
Sales Tax
The total sales tax rate in Long Beach is 10.25%, while Orange has a slightly lower rate at 7.75%. These rates include the California state sales tax of 6%.
Income
Type
Long Beach
Orange
Estimated median household income
$73,905
$103,045
Estimated per capita income
$37,217
$41,925
Cost of living index (U.S. average is 100)
142
88.6
If you make $50,000 in Orange, you will have to make $80,135 in Long Beach to maintain the same standard of living.
Geographical Conditions
Long Beach is a coastal city, known for its busy port and stunning beaches. Orange is an inland city and is less affected by the maritime climate, offering a warmer and more consistent climate.
Both Long Beach and Orange boast strong educational systems. Long Beach is home to the third largest school district in California and offers a wide variety of schools and programs. The city also hosts university options, including California State University, Long Beach. Orange is part of the Orange Unified School District and is close to notable higher education institutions such as Chapman University and Santiago Canyon College.
Long Beach has a diverse economy with key sectors including healthcare, trade, and education. The Port of Long Beach is a significant contributor to the economy and offers employment opportunities. Orange, on the other hand, leans more towards healthcare and retail trade. Both cities have seen consistent economic growth over the years.
Biggest Employers
In Long Beach, the biggest employers are the Long Beach Unified School District, City of Long Beach, and Long Beach Memorial Medical Center. Orange's biggest employers include University of California, Irvine Medical Center, Sisters of St Joseph Hospital, and Chapman University.
There were 304 building permits issued in Long Beach in 2012 (238 more than in 2011) compared to 79 building permits issued in Orange in 2012 (74 more than in 2011).
In Long Beach (Los Angeles County), 69.7% voted for Democrats and 27.8% for Republicans in 2012 Presidential Election. In Orange (Orange County), 45.8% voted for Democrats and 52.0% for Republicans.
Elections
Type
Democrats
Republicans
Other
Year
Long Beach
Orange
Long Beach
Orange
Long Beach
Orange
2020
71.0%
53.6%
26.9%
44.6%
2.1%
1.8%
2016
72.0%
50.9%
22.5%
42.4%
5.5%
6.7%
2012
69.7%
45.8%
27.8%
52.0%
2.4%
2.3%
2008
69.2%
47.8%
28.8%
50.3%
1.9%
1.9%
2004
63.3%
39.3%
35.7%
60.2%
1.0%
0.5%
2000
63.6%
40.4%
32.4%
55.9%
4.0%
3.7%
1996
59.3%
37.9%
31.0%
51.7%
9.7%
10.5%
Breakdown of population affiliated with a religious congregation
Type
Adherents
Congregations
Religion
Long Beach
Orange
Long Beach
Orange
CATHOLIC CHURCH
36.1%
26.5%
4.7%
4.4%
SOUTHERN BAPTIST CONVENTION
1.0%
2.3%
9.0%
8.8%
MUSLIM ESTIMATE
0.7%
0.8%
1.0%
1.3%
AMERICAN BAPTIST CHURCHES IN THE USA
0.5%
0.2%
3.1%
1.7%
SEVENTH DAY ADVENTIST CHURCH
0.5%
0.4%
2.4%
1.3%
EPISCOPAL CHURCH
0.4%
0.4%
1.4%
1.4%
EVANGELICAL LUTHERAN CHURCH IN AMERICA
0.2%
0.4%
1.9%
2.3%
LUTHERAN CHURCH
0.2%
0.6%
1.6%
2.0%
REFORMED CHURCH IN AMERICA
0.1%
0.3%
0.2%
0.2%
Weather
Weather in both cities is characterized by the mild, Mediterranean climate typical of Southern California. Long Beach, being a coastal city, tends to be cooler with ocean breezes, while Orange, located inland, experiences warmer temperatures especially during the summer. Both cities have plenty of sunny days and minimal rainfall, perfect for outdoor activities year-round.
Weather and climate
Type
Long Beach
Orange
Temperature - Average
65.3°F
65°F
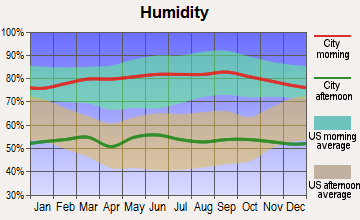
Humidity - Average morning or afternoon humidity
70.4%
69.5%
Humidity - Differences between morning and afternoon humidity
27%
25.6%
Humidity - Maximum monthly morning or afternoon humidity
79%
77.7%
Humidity - Minimum monthly morning or afternoon humidity
52%
52%
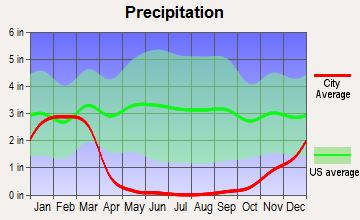
Precipitation - Yearly average
13.1 in
11.9 in
Snowfall - Yearly average
0 in
0 in
Clouds - Number of days clear of clouds
26.4%
26.7%
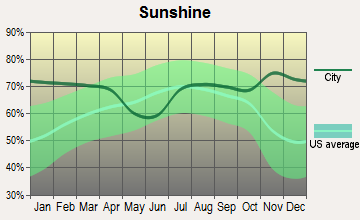
Sunshine amount - Average
78.4%
78.4%
Sunshine amount - Differences during a year
22%
21.9%
Sunshine amount - Maximum monthly
85%
84.9%
Sunshine amount - Minimum monthly
63%
62.9%
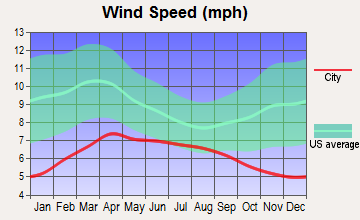
Wind speed - Average
6.1 mph
5.7 mph
Average climate in Long Beach, California
Average climate in Orange, California
Air pollution
Type
AQI
CO
NO2
OZONE
PB
PM10
PM25
SO2
Year
Long Beach
Orange
Long Beach
Orange
Long Beach
Orange
Long Beach
Orange
Long Beach
Orange
Long Beach
Orange
Long Beach
Orange
Long Beach
Orange
2018
124
144
0.37
0.34
17.2
14.0
22.1
27.3
0.008
0.007
27.5
29.0
13.5
12.6
0.7
0.7
2017
122
151
0.36
0.39
18.1
14.6
23.2
28.3
0.007
0.007
26.7
29.6
14.5
13.8
0.8
0.5
2016
115
137
0.36
0.40
18.5
14.3
21.9
28.0
0.007
0.007
24.1
26.3
11.6
13.1
0.9
0.3
2015
111
145
0.38
0.36
19.9
14.7
22.5
28.1
0.005
0.007
25.0
27.0
13.9
14.9
0.9
0.3
2014
127
141
0.50
0.33
20.3
15.0
22.0
27.5
0.007
0.008
26.7
29.1
14.3
15.9
1.3
0.4
2013
126
143
0.48
0.38
20.0
15.6
24.7
26.4
0.005
0.005
32.3
30.5
14.6
14.1
1.0
0.4
2012
132
144
0.48
0.39
19.3
15.2
24.4
26.0
0.004
0.005
30.8
29.2
14.1
15.0
0.6
0.2
2011
119
143
0.43
0.37
20.2
16.6
23.4
26.6
0.006
0.007
28.4
29.0
15.6
16.6
1.2
0.7
2010
115
139
0.38
0.40
20.8
16.9
22.7
26.1
0.011
0.009
24.1
25.3
11.9
15.1
0.7
0.6
2009
132
154
0.50
0.39
21.0
18.4
22.0
26.8
0.008
0.009
27.7
25.2
13.1
15.8
1.1
1.1
2008
124
158
0.53
0.41
20.8
20.1
23.2
27.0
0.008
0.010
27.2
30.1
21.6
18.6
1.0
1.1
2007
109
135
0.60
0.42
20.3
20.2
21.1
26.0
0.010
0.012
N/A
N/A
N/A
N/A
1.4
0.8
2006
119
128
0.76
0.46
21.4
20.7
19.9
25.9
0.005
0.008
N/A
N/A
N/A
N/A
1.7
1.3
2005
108
128
0.74
0.47
24.3
21.8
20.5
26.9
0.011
0.013
N/A
N/A
N/A
N/A
2.7
1.3
2004
125
134
0.56
0.55
28.0
22.1
22.9
30.3
0.012
0.014
N/A
N/A
N/A
N/A
2.0
1.6
2003
130
143
0.83
0.68
28.1
25.5
22.4
24.8
0.032
0.025
N/A
N/A
N/A
N/A
1.1
1.1
2002
120
134
0.90
0.72
29.6
25.6
22.2
22.7
0.011
0.019
N/A
N/A
N/A
N/A
2.8
1.9
2001
124
143
0.81
0.85
30.3
27.3
21.5
22.8
0.011
0.035
N/A
N/A
N/A
N/A
3.3
1.6
2000
142
149
0.71
0.83
31.5
29.7
19.6
22.3
0.018
0.030
N/A
N/A
N/A
N/A
2.0
1.9
Natural disasters
Type
Long Beach
Orange
Tornado activity compared to U.S. average
18.3%
19.3%
Earthquake activity compared to U.S. average
6,875.1%
7,026.4%
Natural disasters compared to U.S. average
57%
32%
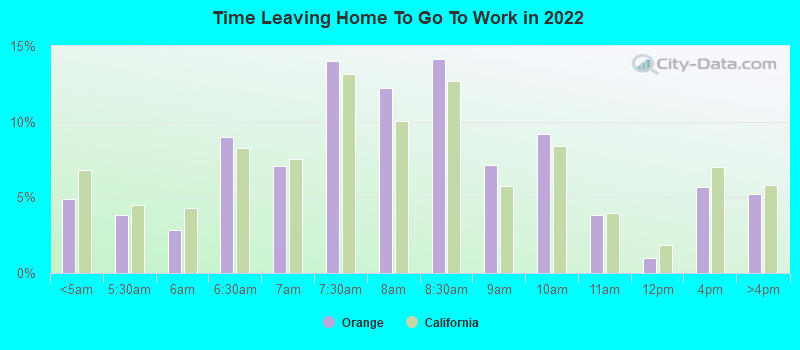
Transportation
Both cities have good transportation systems. Long Beach Transit provides bus and shuttle services, while Metrolink serves Orange. Both cities are also served by Los Angeles’ Metrolink system. Commuting can be challenging due to traffic, particularly in Long Beach. However, both cities also foster biking and walking, providing a greener mode of commuting.
Transport
Type
Long Beach
Orange
Amtrak stations
1
0
Amtrak stations nearby
3
3
FAA registered aircraft
312
72
FAA registered aircraft manufacturers and dealers
29
2
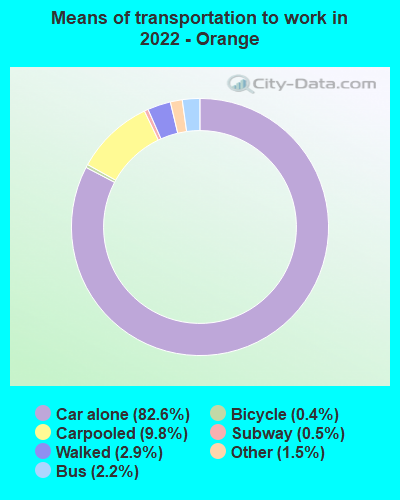
Means of transportation to work
Type
Long Beach
Orange
Bicycle
0.5%
0.5%
Bus
3.3%
1.2%
Carpooled
9.8%
11.2%
Car alone
81.8%
83%
Motorcycle
0.2%
0.2%
Railroad
0%
0.3%
Subway
0.5%
0.3%
Walked
2.8%
2.1%
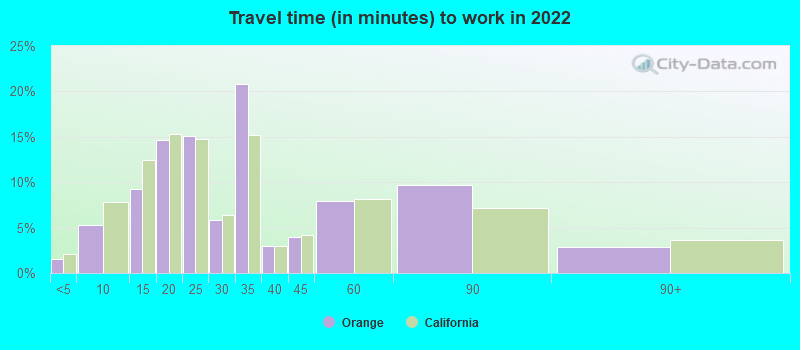
Average travel time to work
Type
Long Beach
Orange
Average
30.7 min
31.3 min
Other means
28.5 min
25.6 min
Public transportation
46.4 min
45.4 min
Private vehicle occupancy
Type
Long Beach
Orange
Average
1.1
1.3
Drove alone
89.7%
85.8%
In 2 person carpool
8.5%
9.2%
In 3 person carpool
1.4%
1.5%
In 4 person carpool
0.3%
2%
In 5-6 person carpool
0%
1.6%
How many people usually rode to work in the car, truck or van.
Real Estate
The real estate market in both cities is competitive due to their desirable Southern California locations. However, housing in Long Beach tends to be more affordable than in Orange. Both cities offer a range of property types including apartments, townhouses, and single-family homes.
Neighborhoods
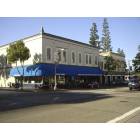
Long Beach is known for its diverse neighborhoods, each offering a different vibe. From the lively Downtown area to quiet suburban neighborhoods, there's a variety to choose from. Orange is known for its quaint and historic neighborhoods, particularly the Old Towne area which is on the National Register of Historic Places.
Houses and residents
Type
Long Beach
Orange
Houses
179,856
45,377
Average household size (people)
2.8
3
Median year apartment built
1964
1975
Median year house/condo built
1954
1970
Length of stay in the house since moving in
15.7 years
15.4 years
Houses occupied
172,599 (96%)
43,291 (95.4%)
Houses occupied by owners
69,470 (40.2%)
24,222 (56%)
Houses occupied by renters
103,129 (59.8%)
19,069 (44%)
Median rent asked for vacant for-rent units
$1,057
$3,066
Median monthly housing costs
$1,692
$2,103
Median price asked for vacant for-sale houses and condos
$520,992
$1,306,159
Estimated median house or condo value
$693,600
$827,200
Median numbers of rooms
4.2
5.3
Median number of rooms in apartments
3.6
4.1
Median number of rooms in houses and condos
5.5
6.3
Median house price - detached houses
$900,658
$943,896
Median house price - in 2-unit structures
$823,515
$539,500
Median house price - in 3-to-4-unit structures
$495,928
Over $1,000,000
Median house price - in 5 or more unit structures
$488,399
$632,238
Median house price - mobile homes
$333,777
$111,668
Median house price - Townhouses or other attached units
$634,684
$661,387
Median house price - All housing units
$805,766
$889,359
Median house age
62
49
Renting percentage
58.4%
39.3%
Housing density (houses/condos per square mile)
3,565.7
1,939.6
House value disparities
21.3%
20.3%
Household income disparities
44.7%
40.6%
Median household income for houses/condes with a mortgage
$116,421
$144,254
Median household income for apartments without a mortgage
$79,392
$87,481
Housing units without a mortgage
394 (0.8%)
317 (1.8%)
Housing units with both a second mortgage and home equity loan
3,069 (6.2%)
927 (5.3%)
Housing units with a mortgage
49,321 (99.2%)
17,033 (98.2%)
Housing units with a home equity loan
48 (0.1%)
53 (0.3%)
Housing units with a second mortgage
3,709 (7.5%)
1,157 (6.7%)
House/condo owner moved in on average (years ago)
15
14
House/condo renter moved in on average (years ago)
3
4
Housing units lacking complete kitchen facilities
2.6%
3%
Housing units lacking complete plumbing facilities
0.4%
0.6%
Housing units in structures
Housing units in structures
Long Beach
Orange
One, detached
40.2%
55.0%
One, attached
4.9%
8.3%
Two
5.3%
2.1%
3 or 4
8.8%
8.8%
5 to 9
10.4%
3.5%
10 to 19
10.8%
2.1%
20 to 49
8.0%
6.1%
50 or more
10.6%
10.6%
Mobile homes
0.8%
3.4%
Boats, RVs, vans, etc.
0.2%
0.0%
Median real estate property taxes paid for housing units
Self-employed workers in own not incorporated business
18,532
6,160
State government workers
6,550
2,223
Unpaid family workers
178
72
Industries and Occupations
Important industries in Long Beach include shipping, healthcare, and aerospace. Orange, on the other hand, largely relies on healthcare, retail trade, and education. The most common occupations in Long Beach are in office and administrative sectors, while Orange leans towards sales and management roles.
Both cities have high-quality healthcare facilities. Long Beach is home to several hospitals including Long Beach Memorial Medical Center. Orange hosts the University of California, Irvine Medical Center and St. Joseph Hospital, both highly regarded institutions.
Health (county statistics)
Type
Long Beach
Orange
General health status score of residents in this county from 1 (poor) to 5 (excellent)
The infrastructure in Long Beach is more urban and developed due to its size. With high-rise buildings, bustling downtown, and extensive port facilities, it's a busy city. Orange has a smaller, more suburban feel, with an emphasis on preserving its historic buildings particularly in its Old Towne District.
Infrastructure
Type
Long Beach
Orange
Hospitals
17
9
TV stations
5
4
Bank branches located here
67
30
Bank institutions located here
18
13
Main business address for public companies
11
1
Drinking water stations with no reported violations in the past
2
1
Drinking water stations with reported violations in the past
HMDA - Conventional home purchase loans - Applications denied
Year
Long Beach
Orange
1999
1,159
451
2000
710
380
2001
677
299
2002
708
300
2003
1,861
478
2004
2,162
589
2005
3,065
645
2006
3,591
769
2007
2,287
561
2008
887
287
2009
475
133
Culture and Food
Long Beach boasts a vibrant culture with a busy arts scene, diverse cuisine, and numerous festivals. Its waterfront location adds to its maritime charm. Orange, though smaller, offers a hearty dose of culture through its historic district and a diverse food scene, with a focus on locally-owned and operated establishments.
Sports Teams
While Long Beach doesn’t have its own major league sports team, it has a close proximity to Los Angeles, which hosts teams in all major sports. Orange also lacks a home team but is near Anaheim, home to the Angels (MLB) and Ducks (NHL).


 Long Beach, CA
 Orange, CA