Long Beach and Riverside are two diverse and unique cities in Southern California, both with their own distinctive advantages. Being coastal, Long Beach is known for its pleasant weather, beachfront lifestyle and higher cost of living, while Riverside, tucked inland, offers lower living costs, a more relaxed lifestyle and a wealth of natural beauty. While each city has different characteristics, all aspects must be considered when deciding on your next move or visit.
Distance between
Long Beach, CA and
Riverside, CA : 44.8 miles
Long Beach's population is larger by 44%. Its population has decreased by 5,460 people (1.2%) since 2000. The population of Riverside has grown by 62,095 people (24.3%) during that time.
When it comes to crime, Long Beach’s overall crime rate sits a bit higher than the national average. The city, however, consists of several neighborhoods with varying degrees of safety. Riverside, on the other hand, boasts a lower crime rate compared to the national average. But as is the case with any city, experience could vary based on specific neighborhoods you reside in or visit.
City-data.com crime index counts serious crimes and violent crime more heavily. It adjusts for the number of visitors and daily workers commuting into cities. (higher means more crime, U.S. average = 301.1)
City-data.com crime index counts serious crimes and violent crime more heavily. It adjusts for the number of visitors and daily workers commuting into cities. (higher means more crime, U.S. average = 301.1)
Sex Offenders
According to our data, there are 1,153 registered sex offenders living in Long Beach and 767 registered sex offenders living in . The ratio of residents to sex offenders in Long Beach is 408 to 1; the ratio in Riverside is 423 to 1. The number of registered sex offenders compared to the number of residents in Long Beach is near to than in Riverside.
Cost of Living
Long Beach has a higher cost of living due to its coastal location, desirable weather, and access to beaches, which can all drive up living costs, especially for housing. Riverside is generally cheaper in terms of cost of living, making it more affordable for families and retirees alike. Groceries, healthcare and utilities also tend to be cheaper in Riverside compared to Long Beach.
Income Tax
California’s state income tax is progressive-based, ranging from 1% to 13.3%, and applies to both Long Beach and Riverside. Thus, residents of both cities would see no difference in state income tax.
Property Tax
Property tax rates in California are the same for every city, including Long Beach and Riverside. Each county, however, may have additional levies and special district taxes. Both Los Angeles County (Long Beach) and Riverside County's rates are around 1% of a property's assessed value.
Sales Tax
Sales tax in both Long Beach and Riverside is equal, set at 7.75% by the state of California. This standard rate applies to all retail sales, leases, and rentals of most goods.
Income
Type
Long Beach
Riverside
Estimated median household income
$73,905
$76,558
Estimated per capita income
$37,217
$29,013
Cost of living index (U.S. average is 100)
142
83
If you make $50,000 in Riverside, you will have to make $85,542 in Long Beach to maintain the same standard of living.
Geographical Conditions
Long Beach, a coastal city, features miles of beachfront, providing abundant opportunities for outdoor activities. Riverside, located inland, is surrounded by the Box Springs Mountain and Sycamore Canyon Wilderness Park, offering a more countryside feel.
Both Long Beach and Riverside offer quality education but with a slight edge favoring Long Beach. Home to the Long Beach Unified School District, one of the highest-rated school districts in the country, it also hosts Long Beach State University. Riverside, however, is home to the prestigious University of California, Riverside, and various community colleges.
Long Beach's economy is diverse and robust, with industries like healthcare, aerospace, trade and education providing numerous job opportunities. Riverside's economy is driven by education, healthcare, retail, and logistics sectors. Even though both cities offer ample work opportunities, household income tends to be higher in Long Beach.
Biggest Employers
In Long Beach, some of the biggest employers include the Long Beach Unified School District, City of Long Beach, Boeing, and MemorialCare Health System. In Riverside, the University of California, Riverside, County of Riverside, and Riverside Unified School District rank among the largest employers.
There were 304 building permits issued in Long Beach in 2012 (238 more than in 2011) compared to 293 building permits issued in Riverside in 2012 (250 more than in 2011).
In Long Beach (Los Angeles County), 69.7% voted for Democrats and 27.8% for Republicans in 2012 Presidential Election. In Riverside (Riverside County), 49.6% voted for Democrats and 48.0% for Republicans.
Elections
Type
Democrats
Republicans
Other
Year
Long Beach
Riverside
Long Beach
Riverside
Long Beach
Riverside
2020
71.0%
53.0%
26.9%
45.0%
2.1%
2.0%
2016
72.0%
49.7%
22.5%
44.4%
5.5%
5.9%
2012
69.7%
49.6%
27.8%
48.0%
2.4%
2.4%
2008
69.2%
50.4%
28.8%
48.1%
1.9%
1.5%
2004
63.3%
41.3%
35.7%
58.2%
1.0%
0.6%
2000
63.6%
45.0%
32.4%
51.6%
4.0%
3.4%
1996
59.3%
43.0%
31.0%
45.6%
9.7%
11.3%
Breakdown of population affiliated with a religious congregation
Type
Adherents
Congregations
Religion
Long Beach
Riverside
Long Beach
Riverside
CATHOLIC CHURCH
36.1%
27.5%
4.7%
4.5%
SOUTHERN BAPTIST CONVENTION
1.0%
1.2%
9.0%
11.2%
MUSLIM ESTIMATE
0.7%
0.5%
1.0%
0.7%
AMERICAN BAPTIST CHURCHES IN THE USA
0.5%
0.0%
3.1%
0.7%
SEVENTH DAY ADVENTIST CHURCH
0.5%
0.9%
2.4%
3.4%
EPISCOPAL CHURCH
0.4%
0.2%
1.4%
1.4%
Weather
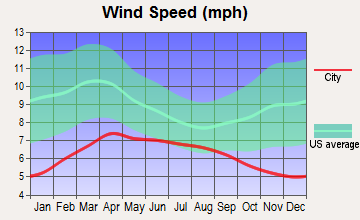
Weather in Long Beach is consistently sunny and mild due to its coastal location, with temperatures seldom below 50°F or above 85°F. It offers a pleasant climate that appeals to both residents and tourists. Riverside, in contrast, experiences a semi-arid climate, typically hotter in summer and cooler in winter. It can occasionally experience dramatic temperature fluctuations in a single day.
Weather and climate
Type
Long Beach
Riverside
Temperature - Average
65.3°F
66°F
Humidity - Average morning or afternoon humidity
70.4%
66.7%
Humidity - Differences between morning and afternoon humidity
27%
21.4%
Humidity - Maximum monthly morning or afternoon humidity
79%
73.5%
Humidity - Minimum monthly morning or afternoon humidity
52%
52.1%
Precipitation - Yearly average
13.1 in
10.3 in
Snowfall - Yearly average
0 in
0 in
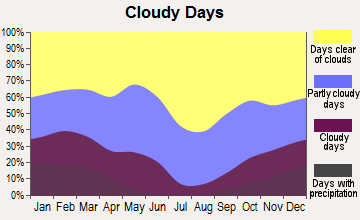
Clouds - Number of days clear of clouds
26.4%
27.3%
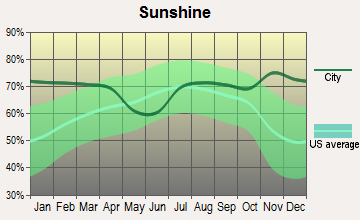
Sunshine amount - Average
78.4%
78.2%
Sunshine amount - Differences during a year
22%
21.5%
Sunshine amount - Maximum monthly
85%
84.2%
Sunshine amount - Minimum monthly
63%
62.6%
Wind speed - Average
6.1 mph
4.5 mph
Average climate in Long Beach, California
Average climate in Riverside, California
Air pollution
Type
AQI
CO
NO2
OZONE
PB
PM10
PM25
SO2
Year
Long Beach
Riverside
Long Beach
Riverside
Long Beach
Riverside
Long Beach
Riverside
Long Beach
Riverside
Long Beach
Riverside
Long Beach
Riverside
Long Beach
Riverside
2018
124
153
0.37
0.35
17.2
14.4
22.1
29.8
0.008
0.006
27.5
44.6
13.5
13.6
0.7
0.4
2017
122
151
0.36
0.34
18.1
14.7
23.2
31.5
0.007
0.004
26.7
48.4
14.5
14.8
0.8
0.3
2016
115
140
0.36
0.33
18.5
14.8
21.9
30.9
0.007
0.006
24.1
44.4
11.6
14.5
0.9
0.2
2015
111
147
0.38
0.33
19.9
14.5
22.5
30.8
0.005
0.004
25.0
43.6
13.9
15.4
0.9
0.3
2014
127
147
0.50
0.37
20.3
15.9
22.0
30.7
0.007
0.006
26.7
34.1
14.3
16.5
1.3
0.3
2013
126
147
0.48
0.38
20.0
16.4
24.7
29.2
0.005
0.006
32.3
33.2
14.6
16.4
1.0
0.2
2012
132
148
0.48
0.35
19.3
16.4
24.4
30.2
0.004
0.007
30.8
32.3
14.1
16.0
0.6
0.3
2011
119
150
0.43
0.37
20.2
16.3
23.4
32.0
0.006
0.006
28.4
33.1
15.6
15.2
1.2
0.3
2010
115
144
0.38
0.42
20.8
17.8
22.7
30.9
0.011
0.008
24.1
31.9
11.9
15.5
0.7
1.3
2009
132
151
0.50
0.37
21.0
20.0
22.0
29.0
0.008
0.009
27.7
38.0
13.1
19.6
1.1
1.5
2008
124
157
0.53
0.41
20.8
20.5
23.2
30.0
0.008
0.010
27.2
43.6
21.6
16.3
1.0
0.9
2007
109
135
0.60
0.65
20.3
20.8
21.1
28.3
0.010
0.011
N/A
N/A
N/A
N/A
1.4
1.6
2006
119
129
0.76
0.58
21.4
21.0
19.9
28.0
0.005
0.005
N/A
N/A
N/A
N/A
1.7
1.4
2005
108
134
0.74
0.53
24.3
22.8
20.5
27.3
0.011
0.012
N/A
N/A
N/A
N/A
2.7
3.3
2004
125
142
0.56
0.72
28.0
18.5
22.9
29.5
0.012
0.013
N/A
N/A
N/A
N/A
2.0
3.1
2003
130
144
0.83
0.75
28.1
22.7
22.4
28.5
0.032
0.013
N/A
N/A
N/A
N/A
1.1
2.0
2002
120
142
0.90
0.82
29.6
24.9
22.2
28.5
0.011
0.015
N/A
N/A
N/A
N/A
2.8
0.2
2001
124
145
0.81
0.79
30.3
25.7
21.5
26.1
0.011
0.025
N/A
N/A
N/A
N/A
3.3
0.9
2000
142
157
0.71
0.82
31.5
24.2
19.6
25.0
0.018
0.031
N/A
N/A
N/A
N/A
2.0
1.2
Natural disasters
Type
Long Beach
Riverside
Tornado activity compared to U.S. average
18.3%
17.4%
Earthquake activity compared to U.S. average
6,875.1%
7,322.6%
Natural disasters compared to U.S. average
57%
46%
Transportation
Long Beach offers more robust public transportation and commuting options, including a light rail system. Riverside, more spread out, has a less extensive public transit system but offers a Metrolink train system that connects it to Greater Los Angeles, providing convenient commuting options.
Transport
Type
Long Beach
Riverside
Amtrak stations
1
1
Amtrak stations nearby
3
3
FAA registered aircraft
312
307
FAA registered aircraft manufacturers and dealers
29
15
Means of transportation to work
Type
Long Beach
Riverside
Bicycle
0.5%
0.5%
Bus
3.3%
0.9%
Carpooled
9.8%
9%
Car alone
81.8%
85.7%
Motorcycle
0.2%
0.3%
Railroad
0%
0.4%
Subway
0.5%
0.1%
Walked
2.8%
2.3%
Average travel time to work
Type
Long Beach
Riverside
Average
30.7 min
31.3 min
Other means
28.5 min
28.7 min
Public transportation
46.4 min
45.3 min
Private vehicle occupancy
Type
Long Beach
Riverside
Average
1.1
1.1
Drove alone
89.7%
89.1%
In 2 person carpool
8.5%
8.4%
In 3 person carpool
1.4%
2%
In 4 person carpool
0.3%
0.2%
In 5-6 person carpool
0%
0.2%
In 7+ person carpool
0%
0.1%
How many people usually rode to work in the car, truck or van.
Real Estate
Real-estate in Long Beach is substantially more expensive due to its coastal location and favorable climate. Riverside real-estate, while on the rise, remains more affordable, presenting opportunities for those seeking home ownership at a lower cost.
Neighborhoods
Long Beach neighborhoods range from upscale, such as Belmont Shore and Naples, to more affordable like North Long Beach. Riverside, more rural, offers a mix of suburban neighborhoods like Canyon Crest and Wood Streets that boast a small-town feel.
Houses and residents
Type
Long Beach
Riverside
Houses
179,856
94,246
Average household size (people)
2.8
3.2
Median year apartment built
1964
1982
Median year house/condo built
1954
1974
Length of stay in the house since moving in
15.7 years
14.2 years
Houses occupied
172,599 (96%)
91,110 (96.7%)
Houses occupied by owners
69,470 (40.2%)
51,211 (56.2%)
Houses occupied by renters
103,129 (59.8%)
39,899 (43.8%)
Median rent asked for vacant for-rent units
$1,057
$1,277
Median monthly housing costs
$1,692
$1,680
Median price asked for vacant for-sale houses and condos
$520,992
$414,585
Estimated median house or condo value
$693,600
$483,300
Median numbers of rooms
4.2
5.2
Median number of rooms in apartments
3.6
3.9
Median number of rooms in houses and condos
5.5
6.1
Median house price - detached houses
$900,658
$548,362
Median house price - in 2-unit structures
$823,515
$525,372
Median house price - in 3-to-4-unit structures
$495,928
$450,463
Median house price - in 5 or more unit structures
$488,399
$408,213
Median house price - mobile homes
$333,777
$81,780
Median house price - Townhouses or other attached units
$634,684
$442,670
Median house price - All housing units
$805,766
$529,360
Median house age
62
44
Renting percentage
58.4%
44.3%
Housing density (houses/condos per square mile)
3,565.7
1,206.8
House value disparities
21.3%
21%
Household income disparities
44.7%
40.5%
Median household income for houses/condes with a mortgage
$116,421
$104,161
Median household income for apartments without a mortgage
$79,392
$71,925
Housing units without a mortgage
394 (0.8%)
393 (1%)
Housing units with both a second mortgage and home equity loan
3,069 (6.2%)
1,312 (3.3%)
Housing units with a mortgage
49,321 (99.2%)
39,744 (99%)
Housing units with a home equity loan
48 (0.1%)
123 (0.3%)
Housing units with a second mortgage
3,709 (7.5%)
2,112 (5.3%)
House/condo owner moved in on average (years ago)
15
13
House/condo renter moved in on average (years ago)
3
3
Housing units lacking complete kitchen facilities
2.6%
2.5%
Housing units lacking complete plumbing facilities
0.4%
0.4%
Housing units in structures
Housing units in structures
Long Beach
Riverside
One, detached
40.2%
63.1%
One, attached
4.9%
5.6%
Two
5.3%
1.1%
3 or 4
8.8%
3.7%
5 to 9
10.4%
6.8%
10 to 19
10.8%
7.0%
20 to 49
8.0%
4.6%
50 or more
10.6%
6.4%
Mobile homes
0.8%
1.8%
Boats, RVs, vans, etc.
0.2%
0.0%
Median real estate property taxes paid for housing units
Self-employed workers in own not incorporated business
18,532
8,164
State government workers
6,550
8,293
Unpaid family workers
178
199
Industries and Occupations
Long Beach is known for its healthcare, aerospace, education and port-related industries. Riverside, by contrast, is arguably more blue-collar, tied to the warehousing and logistics sectors, in addition to education and healthcare.
Both Long Beach and Riverside have numerous healthcare facilities. Long Beach Memorial Medical Center and Miller Children's and Women's Hospital Long Beach are prominent in Long Beach, while in Riverside, the top-ranked hospitals include Riverside Community Hospital and Kaiser Permanente Riverside Medical Center.
Health (county statistics)
Type
Long Beach
Riverside
General health status score of residents in this county from 1 (poor) to 5 (excellent)
Long Beach is more developed in terms of infrastructure, boasting high-quality roads, extensive bike lanes, parks, and beachfront properties. Riverside, while more relaxed and slower-paced, offers a combination of historical and modern architecture, with notable improvements in its downtown infrastructure lately.
Infrastructure
Type
Long Beach
Riverside
Hospitals
17
20
TV stations
5
5
Bank branches located here
67
61
Bank institutions located here
18
18
Main business address for public companies
11
2
Drinking water stations with no reported violations in the past
2
2
Drinking water stations with reported violations in the past
HMDA - Conventional home purchase loans - Applications denied
Year
Long Beach
Riverside
1999
1,159
794
2000
710
375
2001
677
310
2002
708
405
2003
1,861
1,399
2004
2,162
1,892
2005
3,065
2,728
2006
3,591
3,235
2007
2,287
1,568
2008
887
544
2009
475
285
Culture and Food
Long Beach has a vibrant and diverse food scene, featuring cuisine from around the globe. Its cultural attractions include The Museum of Latin American Art and Aquarium of the Pacific. Riverside also offers a unique culture, with attractions like the Riverside Art Museum and Mission Inn Hotel and Spa, and a range of locally-owned restaurants serving diverse fare.
Sports Teams
Neither city hosts a major league sports team, but Long Beach's proximity to Los Angeles allows easy access to Lakers, Dodgers, and Rams games. Riverside residents frequently support Inland Empire teams like the Inland Empire 66ers.


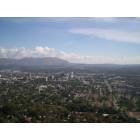
 Long Beach, CA
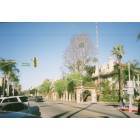
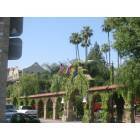
 Riverside, CA