The comparison between Long Beach, CA, and South Coast, CA, considers various aspects like crime and safety, weather, cost of living, education, and more. These two Californian gems, although close in proximity, show diverging peculiarities. Whether you're a potential resident or a visitor, the cities offer unique experiences from cultural richness to business opportunities, which are reflected in their lifestyle, occupations, and recreational offerings.
Long Beach has seen a significant reduction in crime rates over the years, with violent and property crimes below the national average. The city's focus on community policing has improved residents' safety. South Coast, known for its luxurious coastal communities, generally experiences a lower crime rate. Both areas are considered relatively safe, but as always, it's essential to exercise general precautions.
Cost of Living
The cost of living in Long Beach is notably less than in South Coast. South Coast is known for its expensive homes, contributing to its high cost of living. However, this is balanced out by the excellent amenities that the city offers. Irrespective, potential residents should consider both their budget and lifestyle preferences when choosing between these two cities.
Income Tax
Both Long Beach and South Coast fall under California's income tax rules, which are progressive and range from 1% to 13.3%, depending on income level.
Property Tax
Property taxes vary in both cities but generally fall under the California average of 0.73% of assessed home value. South Coast, with its higher property values, can lead to heftier property taxes.
Sales Tax
The sales tax in Long Beach is 10.25%, while South Coast cities typically have a sales tax around the same range. California's state sales tax is 6%, but local municipalities can add additional taxes, affecting the total rate.
Income
Type
Long Beach
South Coast
Estimated median household income
$73,905
$112,870
Estimated per capita income
$37,217
$68,453
Cost of living index (U.S. average is 100)
142
96.8
If you make $50,000 in South Coast, you will have to make $73,347 in Long Beach to maintain the same standard of living.
Geographical Conditions
Long Beach has geographical advantages with its beautiful beaches and proximity to the Pacific Ocean. South Coast is known for its breathtaking coastal views, sandy beaches, and preserved natural areas that offer hiking trails and outdoor adventures.
Geographical information
Type
Long Beach
South Coast
Land area
50.4 sq. miles
101 sq. miles
Population density
9,041.5 people per sq. mile
2,953.2 people per sq. mile
Relative area comparison
Long Beach, CA South Coast, CA
Education
Long Beach is home to the prestigious California State University, Long Beach and several high-ranking public schools. South Coast also boasts of high-quality education institutions, including a strong community college district. In both cities, residents have access to excellent educational opportunities.
Long Beach has a diverse economy with sectors like healthcare, education, and port-related industries thriving. South Coast, on the other hand, is known for its strong retail and tourism sectors. Both cities provide numerous job opportunities, but the type of industry one may want to work in could influence their choice of residence.
Biggest Employers
Long Beach's major employers include Long Beach Unified School District, Long Beach Memorial Medical Center, and the City of Long Beach. South Coast, on the other hand, sees large-scale employment in companies like Pimco, Pacific Life, and numerous retail outlets.
In Long Beach (Los Angeles County), 69.7% voted for Democrats and 27.8% for Republicans in 2012 Presidential Election. In South Coast (Orange County), 45.8% voted for Democrats and 52.0% for Republicans.
Elections
Type
Democrats
Republicans
Other
Year
Long Beach
South Coast
Long Beach
South Coast
Long Beach
South Coast
2020
71.0%
53.6%
26.9%
44.6%
2.1%
1.8%
2016
72.0%
50.9%
22.5%
42.4%
5.5%
6.7%
2012
69.7%
45.8%
27.8%
52.0%
2.4%
2.3%
2008
69.2%
47.8%
28.8%
50.3%
1.9%
1.9%
2004
63.3%
39.3%
35.7%
60.2%
1.0%
0.5%
2000
63.6%
40.4%
32.4%
55.9%
4.0%
3.7%
1996
59.3%
37.9%
31.0%
51.7%
9.7%
10.5%
Breakdown of population affiliated with a religious congregation
Type
Adherents
Congregations
Religion
Long Beach
South Coast
Long Beach
South Coast
CATHOLIC CHURCH
36.1%
26.5%
4.7%
4.4%
SOUTHERN BAPTIST CONVENTION
1.0%
2.3%
9.0%
8.8%
MUSLIM ESTIMATE
0.7%
0.8%
1.0%
1.3%
AMERICAN BAPTIST CHURCHES IN THE USA
0.5%
0.2%
3.1%
1.7%
SEVENTH DAY ADVENTIST CHURCH
0.5%
0.4%
2.4%
1.3%
EPISCOPAL CHURCH
0.4%
0.4%
1.4%
1.4%
EVANGELICAL LUTHERAN CHURCH IN AMERICA
0.2%
0.4%
1.9%
2.3%
LUTHERAN CHURCH
0.2%
0.6%
1.6%
2.0%
REFORMED CHURCH IN AMERICA
0.1%
0.3%
0.2%
0.2%
Weather
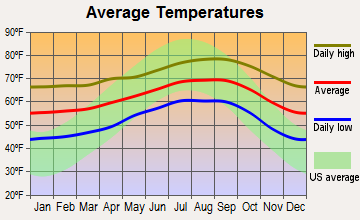
Long Beach enjoys a Mediterranean climate, characterized by hot, dry summers and mild, rainy winters. This makes it a great place to enjoy outdoor activities almost all year. South Coast experiences similar weather patterns and is also ideal for outdoor enthusiasts. The weather conditions make both cities attractive to tourists.
Weather and climate
Type
Long Beach
South Coast
Temperature - Average
65.3°F
62.1°F
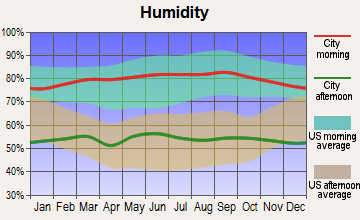
Humidity - Average morning or afternoon humidity
70.4%
69.1%
Humidity - Differences between morning and afternoon humidity
27%
24.6%
Humidity - Maximum monthly morning or afternoon humidity
79%
77%
Humidity - Minimum monthly morning or afternoon humidity
52%
52.4%
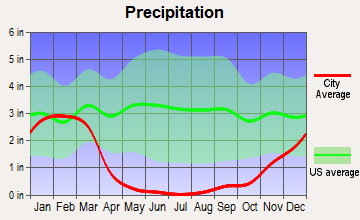
Precipitation - Yearly average
13.1 in
13.4 in
Snowfall - Yearly average
0 in
0 in
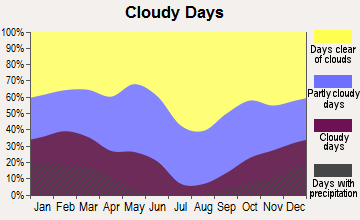
Clouds - Number of days clear of clouds
26.4%
26.7%
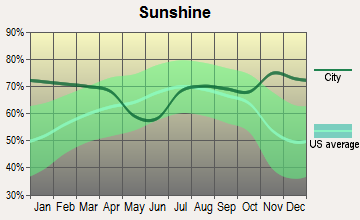
Sunshine amount - Average
78.4%
77.6%
Sunshine amount - Differences during a year
22%
20.5%
Sunshine amount - Maximum monthly
85%
81.9%
Sunshine amount - Minimum monthly
63%
61.4%
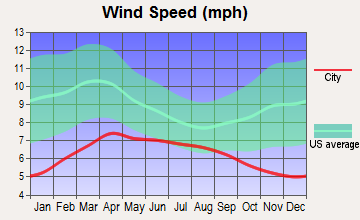
Wind speed - Average
6.1 mph
5.5 mph
Average climate in Long Beach, California
Average climate in South Coast, California
Air pollution
Type
AQI
CO
NO2
OZONE
PB
PM10
PM25
SO2
Year
Long Beach
South Coast
Long Beach
South Coast
Long Beach
South Coast
Long Beach
South Coast
Long Beach
Long Beach
South Coast
Long Beach
South Coast
Long Beach
South Coast
2018
124
105
0.37
0.18
17.2
8.6
22.1
34.0
0.008
N/A
27.5
22.7
13.5
7.0
0.7
N/A
2017
122
111
0.36
0.21
18.1
8.4
23.2
34.7
0.007
N/A
26.7
23.0
14.5
11.3
0.8
N/A
2016
115
105
0.36
0.14
18.5
9.6
21.9
33.8
0.007
N/A
24.1
21.9
11.6
9.8
0.9
0.1
2015
111
111
0.38
0.10
19.9
10.5
22.5
32.9
0.005
N/A
25.0
19.4
13.9
10.5
0.9
0.1
2014
127
100
0.50
0.11
20.3
9.8
22.0
31.3
0.007
N/A
26.7
25.4
14.3
11.8
1.3
0.3
2013
126
97
0.48
0.17
20.0
10.6
24.7
30.0
0.005
N/A
32.3
24.5
14.6
10.3
1.0
0.2
2012
132
101
0.48
0.26
19.3
10.1
24.4
29.9
0.004
N/A
30.8
21.5
14.1
10.5
0.6
0.1
2011
119
113
0.43
0.15
20.2
10.2
23.4
30.3
0.006
N/A
28.4
24.0
15.6
10.9
1.2
0.3
2010
115
101
0.38
0.21
20.8
10.9
22.7
30.6
0.011
N/A
24.1
23.3
11.9
11.4
0.7
0.6
2009
132
120
0.50
0.15
21.0
13.0
22.0
31.5
0.008
N/A
27.7
27.3
13.1
12.4
1.1
1.1
2008
124
131
0.53
0.26
20.8
13.2
23.2
32.0
0.008
N/A
27.2
38.8
21.6
9.4
1.0
1.1
2007
109
110
0.60
0.24
20.3
13.7
21.1
30.6
0.010
N/A
N/A
N/A
N/A
N/A
1.4
0.8
2006
119
112
0.76
0.30
21.4
14.8
19.9
30.6
0.005
N/A
N/A
N/A
N/A
N/A
1.7
1.3
2005
108
109
0.74
0.28
24.3
13.7
20.5
29.9
0.011
N/A
N/A
N/A
N/A
N/A
2.7
1.3
2004
125
130
0.56
0.29
28.0
15.5
22.9
32.5
0.012
N/A
N/A
N/A
N/A
N/A
2.0
1.6
2003
130
132
0.83
0.38
28.1
18.2
22.4
31.3
0.032
N/A
N/A
N/A
N/A
N/A
1.1
1.1
2002
120
129
0.90
0.40
29.6
17.7
22.2
28.4
0.011
N/A
N/A
N/A
N/A
N/A
2.8
1.6
2001
124
137
0.81
0.52
30.3
18.5
21.5
27.8
0.011
N/A
N/A
N/A
N/A
N/A
3.3
1.4
2000
142
140
0.71
0.52
31.5
21.2
19.6
24.5
0.018
N/A
N/A
N/A
N/A
N/A
2.0
1.9
Natural disasters
Type
Long Beach
South Coast
Tornado activity compared to U.S. average
18.3%
17.1%
Earthquake activity compared to U.S. average
6,875.1%
6,728.5%
Natural disasters compared to U.S. average
57%
32%
Transportation
Long Beach offers varied transportation options, including an efficient bus system, light rail, and bike-friendly paths. South Coast provides less public transit but still supports commuting with well-structured road networks and the iconic Pacific Coast Highway.
Transport
Type
Long Beach
South Coast
Amtrak stations
1
0
Amtrak stations nearby
3
3
FAA registered aircraft
312
0
FAA registered aircraft manufacturers and dealers
29
0
Means of transportation to work
Type
Long Beach
South Coast
Bicycle
0.5%
0.3%
Bus
3.3%
1%
Carpooled
9.8%
10.5%
Car alone
81.8%
79.2%
Motorcycle
0.2%
0.2%
Railroad
0%
0.4%
Subway
0.5%
0%
Walked
2.8%
1.7%
Average travel time to work
Type
Long Beach
South Coast
Average
30.7 min
27.9 min
Real Estate
Real estate prices are generally higher in South Coast, reflecting its luxurious coastal communities. Long Beach offers a broader range of property types and prices, making it more affordable for many. However, both cities offer excellent real estate investment opportunities.
Neighborhoods
Long Beach is renowned for its diverse neighborhoods, each with its unique character - from urban downtown to seaside Belmont Shore. South Coast's neighborhoods exude luxury and charm, showcasing beautiful homes, and are typically quieter than their Long Beach counterparts.
Houses and residents
Type
Long Beach
South Coast
Houses
179,856
124,031
Average household size (people)
2.8
2.5
Houses occupied
172,599 (96%)
117,093 (94.4%)
Houses occupied by owners
69,470 (40.2%)
81,601 (69.7%)
Houses occupied by renters
103,129 (59.8%)
35,492 (30.3%)
Median rent asked for vacant for-rent units
$1,057
$2,718
Median price asked for vacant for-sale houses and condos
$520,992
$1,099,558
Estimated median house or condo value
$693,600
Over $1,000,000
Median number of rooms in apartments
3.6
3.9
Median number of rooms in houses and condos
5.5
5.1
Renting percentage
58.4%
33.8%
Housing density (houses/condos per square mile)
3,565.7
1,227.5
Household income disparities
44.7%
38.1%
Housing units without a mortgage
394 (0.8%)
10,715 (16.4%)
Housing units with both a second mortgage and home equity loan
3,069 (6.2%)
248 (0.4%)
Housing units with a mortgage
49,321 (99.2%)
54,674 (83.6%)
Housing units with a home equity loan
48 (0.1%)
5,859 (9%)
Housing units with a second mortgage
3,709 (7.5%)
7,560 (11.6%)
Housing units lacking complete kitchen facilities
2.6%
0.8%
Housing units lacking complete plumbing facilities
Self-employed workers in own not incorporated business
18,532
17,244
State government workers
6,550
4,403
Unpaid family workers
178
640
Industries and Occupations
Some of Long Beach's prominent industries include healthcare, education, and technology. In contrast, South Coast's economy more heavily leans towards retail, services, and tourism. Jobseekers may find wider opportunities in their desired industry depending on the city they choose.
Both cities offer reliable healthcare services. Long Beach has several highly-rated hospitals, including the Long Beach Memorial Medical Center. South Coast communities also have access to high-quality healthcare facilities and services.
Health (county statistics)
Type
Long Beach
South Coast
General health status score of residents in this county from 1 (poor) to 5 (excellent)
Long Beach is a modern city with well-developed infrastructure. It's home to one of the world’s busiest seaports and has an efficient transportation system. South Coast's infrastructure is equally developed but emphasizes the preservation of its stunning natural environment and coastal beauty.
Infrastructure
Type
Long Beach
South Coast
TV stations
5
1
Nuclear power plants nearby
0
2
Culture and Food
Long Beach boasts a rich cultural scene with ethnic diversity reflected in its food, art, music, and festivals. South Coast cities offer a blend of high-end dining, wineries, and local food joints. Both areas offer distinctive culinary experiences.
Sports Teams
Long Beach doesn't have major professional sports teams but supports various minor league teams and is passionate about collegiate sports. South Coast doesn't host any major sports teams, but residents are in proximity to teams in Los Angeles.
 Long Beach, CA
 South Coast, CA