As potential cities of interest in California, Long Beach and Upper San Gabriel Valley have distinct characteristics. While Long Beach is renowned for its urban feel, beach location, and cultural diversity, Upper San Gabriel Valley boasts lush greenery, serene neighborhoods, and a strong sense of community. These differences span across various aspects including crime and safety, weather, cost of living, and more. Let's delve deeper into comparisons between these two locales.
Long Beach has a higher crime rate than national averages, but it largely depends on the specific neighborhood. The city has initiated numerous safety programs and the situation is consistently improving. On the other hand, Upper San Gabriel Valley, being largely suburban, has lower crime rates, providing a more secure environment for residents and tourists.
Cost of Living
Living in Long Beach can be more expensive than in Upper San Gabriel Valley. Housing costs, in particular, are higher in Long Beach. Despite this, there are areas in both cities that can accommodate various budget ranges, making either location feasible depending on financial capability and preferences.
Income Tax
Both Long Beach and Upper San Gabriel Valley fall under the California state income tax structure, which is a progressive system with rates ranging from 1% to 13.3% based on income.
Property Tax
The average property tax rate for both locations is approximately 0.77% of assessed home value, which stands below the national average. However, housing values in Long Beach tend to be higher, which could result in larger tax bills.
Sales Tax
Both cities fall under California's jurisdiction and therefore have the same sales tax rate, which is currently 7.25%. However, Long Beach imposes an additional city sales tax, making the total sales tax in the city a bit higher.
Income
Type
Long Beach
Upper San Gabriel Valley
Estimated median household income
$73,905
$80,436
Estimated per capita income
$37,217
$33,562
Cost of living index (U.S. average is 100)
142
159.5
If you make $50,000 in Long Beach, you will have to make $56,162 in Upper San Gabriel Valley to maintain the same standard of living.
Geographical Conditions
Long Beach benefits from a coastal location, providing beautiful ocean views and beach amenities. Upper San Gabriel Valley is nestled against the San Gabriel Mountains, boasting lush landscapes and hiking options.
Geographical information
Type
Long Beach
Upper San Gabriel Valley
Land area
50.4 sq. miles
49.4 sq. miles
Population density
9,041.5 people per sq. mile
6,624.2 people per sq. mile
Relative area comparison
Long Beach, CA Upper San Gabriel Valley, CA
Education
The quality of education varies in both places. Long Beach has several highly rated schools and also hosts California State University Long Beach. Upper San Gabriel Valley is home to excellent school districts, with the majority of their schools highly ranked as well.
Long Beach's economy is quite versatile, with sectors like healthcare, aerospace, technology, and retail contributing to local employment. Upper San Gabriel Valley has a mixed economy with a prominence of manufacturing and retail jobs. Unemployment rates in both areas are comparable to the national average.
Biggest Employers
In Long Beach, major employers include Long Beach Unified School District, City of Long Beach, and Long Beach Memorial Medical Center. In Upper San Gabriel Valley, top employers include City of Hope, Westfield Santa Anita, and Macy's.
Weather
Both cities enjoy the quintessential Southern California weather. Long Beach, being a coastal city, experiences mild, slightly cooler temperatures throughout the year. Upper San Gabriel Valley, while slightly warmer, boasts clean, fresh air due to its location near the mountains. Both locales have ample sunshine and are great for outdoor activities.
Weather and climate
Type
Long Beach
Upper San Gabriel Valley
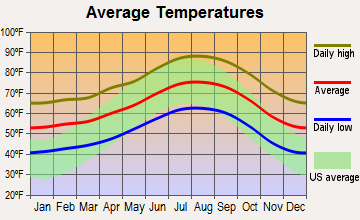
Temperature - Average
65.3°F
63.5°F
Humidity - Average morning or afternoon humidity
70.4%
62.2%
Humidity - Differences between morning and afternoon humidity
27%
17.3%
Humidity - Maximum monthly morning or afternoon humidity
79%
67%
Humidity - Minimum monthly morning or afternoon humidity
52%
49.7%
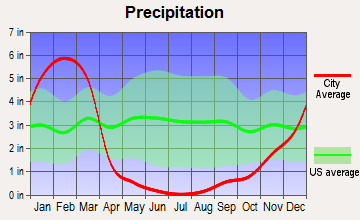
Precipitation - Yearly average
13.1 in
24.3 in
Snowfall - Yearly average
0 in
0 in
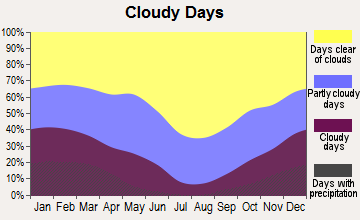
Clouds - Number of days clear of clouds
26.4%
29.4%
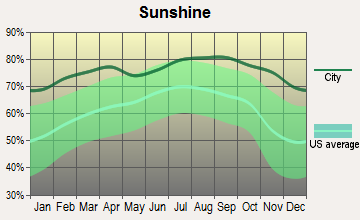
Sunshine amount - Average
78.4%
78.4%
Sunshine amount - Differences during a year
22%
22%
Sunshine amount - Maximum monthly
85%
85%
Sunshine amount - Minimum monthly
63%
63%
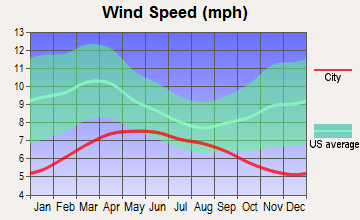
Wind speed - Average
6.1 mph
2.6 mph
Average climate in Long Beach, California
Average climate in Upper San Gabriel Valley, California
Air pollution
Type
AQI
CO
NO2
OZONE
PB
PM10
PM25
SO2
Year
Long Beach
Upper San Gabriel Valley
Long Beach
Upper San Gabriel Valley
Long Beach
Upper San Gabriel Valley
Long Beach
Upper San Gabriel Valley
Long Beach
Upper San Gabriel Valley
Long Beach
Upper San Gabriel Valley
Long Beach
Upper San Gabriel Valley
Long Beach
Upper San Gabriel Valley
2018
124
142
0.37
0.37
17.2
14.2
22.1
28.5
0.008
0.007
27.5
28.5
13.5
14.1
0.7
0.4
2017
122
146
0.36
0.36
18.1
15.1
23.2
29.8
0.007
0.007
26.7
31.2
14.5
14.0
0.8
0.5
2016
115
136
0.36
0.33
18.5
15.5
21.9
28.1
0.007
0.007
24.1
28.6
11.6
13.0
0.9
0.4
2015
111
143
0.38
0.33
19.9
15.2
22.5
28.4
0.005
0.007
25.0
28.4
13.9
15.2
0.9
0.3
2014
127
141
0.50
0.35
20.3
16.7
22.0
28.0
0.007
0.007
26.7
31.3
14.3
14.9
1.3
0.5
2013
126
144
0.48
0.39
20.0
17.3
24.7
26.6
0.005
0.007
32.3
29.3
14.6
14.4
1.0
0.4
2012
132
148
0.48
0.43
19.3
18.2
24.4
25.9
0.004
0.006
30.8
28.7
14.1
16.5
0.6
0.5
2011
119
146
0.43
0.47
20.2
19.1
23.4
24.8
0.006
0.008
28.4
28.9
15.6
17.6
1.2
0.5
2010
115
133
0.38
0.48
20.8
19.2
22.7
24.6
0.011
0.011
24.1
27.0
11.9
15.5
0.7
0.5
2009
132
153
0.50
0.39
21.0
21.0
22.0
25.4
0.008
0.011
27.7
32.0
13.1
17.2
1.1
0.4
2008
124
155
0.53
0.54
20.8
23.1
23.2
24.9
0.008
0.013
27.2
32.1
21.6
16.9
1.0
0.6
2007
109
135
0.60
0.55
20.3
24.6
21.1
23.1
0.010
0.016
N/A
N/A
N/A
N/A
1.4
1.0
2006
119
128
0.76
0.58
21.4
24.9
19.9
22.8
0.005
0.009
N/A
N/A
N/A
N/A
1.7
1.5
2005
108
128
0.74
0.61
24.3
25.4
20.5
21.3
0.011
0.015
N/A
N/A
N/A
N/A
2.7
1.7
2004
125
134
0.56
0.71
28.0
26.0
22.9
23.8
0.012
0.018
N/A
N/A
N/A
N/A
2.0
2.4
2003
130
143
0.83
0.89
28.1
30.7
22.4
23.3
0.032
0.025
N/A
N/A
N/A
N/A
1.1
1.6
2002
120
137
0.90
0.91
29.6
32.5
22.2
21.9
0.011
0.022
N/A
N/A
N/A
N/A
2.8
2.2
2001
124
143
0.81
1.04
30.3
33.1
21.5
20.1
0.011
0.031
N/A
N/A
N/A
N/A
3.3
2.3
2000
142
151
0.71
1.07
31.5
33.5
19.6
20.1
0.018
0.028
N/A
N/A
N/A
N/A
2.0
1.3
Natural disasters
Type
Long Beach
Upper San Gabriel Valley
Tornado activity compared to U.S. average
18.3%
18%
Earthquake activity compared to U.S. average
6,875.1%
7,264.5%
Natural disasters compared to U.S. average
57%
57%
Transportation
Long Beach has an effective public transit system and it's also bike-friendly. Upper San Gabriel Valley also has public transportation options, but a car is generally needed for commuting. Traffic in both areas can be cumbersome during peak hours.
Transport
Type
Long Beach
Upper San Gabriel Valley
Amtrak stations
1
0
Amtrak stations nearby
3
3
FAA registered aircraft
312
0
FAA registered aircraft manufacturers and dealers
29
0
Means of transportation to work
Type
Long Beach
Upper San Gabriel Valley
Bicycle
0.5%
1.1%
Bus
3.3%
3.9%
Carpooled
9.8%
16.6%
Car alone
81.8%
71.1%
Motorcycle
0.2%
0.1%
Subway
0.5%
0%
Taxicab
0%
0.1%
Walked
2.8%
3.2%
Average travel time to work
Type
Long Beach
Upper San Gabriel Valley
Average
30.7 min
29.1 min
Real Estate
Real estate in Long Beach is diverse, with a mix of single-family homes, condos, and apartments. Upper San Gabriel Valley has a more suburban feel with a prevalence of single-family homes. Prices in Long Beach are generally higher due to its coastal location.
Neighborhoods
Both cities have a mix of upscale and working-class neighborhoods. Long Beach neighborhoods such as Belmont Shore and Naples are highly desired. Upper San Gabriel Valley, with its distinct communities including Arcadia and San Marino, offers many family-oriented neighborhoods.
Houses and residents
Type
Long Beach
Upper San Gabriel Valley
Houses
179,856
99,295
Average household size (people)
2.8
3.3
Houses occupied
172,599 (96%)
96,186 (96.9%)
Houses occupied by owners
69,470 (40.2%)
52,398 (54.5%)
Houses occupied by renters
103,129 (59.8%)
43,788 (45.5%)
Median rent asked for vacant for-rent units
$1,057
$1,771
Median price asked for vacant for-sale houses and condos
$520,992
$1,138,428
Estimated median house or condo value
$693,600
$740,686
Median number of rooms in apartments
3.6
3.7
Median number of rooms in houses and condos
5.5
5.9
Renting percentage
58.4%
44.9%
Housing density (houses/condos per square mile)
3,565.7
2,008.8
Household income disparities
44.7%
44%
Housing units without a mortgage
394 (0.8%)
11,525 (24.8%)
Housing units with both a second mortgage and home equity loan
3,069 (6.2%)
137 (0.3%)
Housing units with a mortgage
49,321 (99.2%)
34,867 (75.2%)
Housing units with a home equity loan
48 (0.1%)
3,133 (6.8%)
Housing units with a second mortgage
3,709 (7.5%)
4,036 (8.7%)
Housing units lacking complete kitchen facilities
2.6%
1.5%
Housing units lacking complete plumbing facilities
Self-employed workers in own not incorporated business
18,532
10,209
State government workers
6,550
3,180
Unpaid family workers
178
401
Industries and Occupations
Healthcare, education, trade and transportation are dominant industries in Long Beach. Upper San Gabriel Valley has a slightly different focus with manufacturing, healthcare and retail trade being the leading industries. The diverse job market in both areas caters to various occupational backgrounds.
Health Care
Healthcare facilities in Long Beach are numerous, with Long Beach Memorial Medical Center being one of the largest. In Upper San Gabriel Valley, top-rated facilities include Methodist Hospital of Southern California and City of Hope.
Infrastructure
Long Beach shows excellent infrastructure development with continuous improvements targeting public spaces, parks, and community centers. Upper San Gabriel Valley also prioritizes infrastructure focused on enhancing quality of life, though the pace of development may be slower due to its suburban nature.
Infrastructure
Type
Long Beach
Upper San Gabriel Valley
TV stations
5
27
Culture and Food
Long Beach has a rich cultural diversity, reflected in its multitude of food offerings, festivals, and art scenes. Upper San Gabriel Valley, known for its predominant Asian population, excels in offering authentic Asian cuisines and cultural events.
Sports Teams
While Long Beach doesn't host any major sports team, it's close to L.A. where many prominent teams are based. Upper San Gabriel Valley, being more suburban, also doesn't have any major sports teams, but residents enjoy easy access to L.A.'s sports scene.
 Long Beach, CA
 Upper San Gabriel Valley, CA