Los Angeles, California, and Bronx, New York, offer unique and diverse experiences for both residents and tourists. The differences come down to factors such as climate, cost of living, education opportunities, economic conditions, infrastructure, industries and occupations, major employers, real estate markets, neighborhood personality, public transportation availability, tax structure, cultural and culinary offerings, sports favorites, geographical conditions, and healthcare services.
Crime rates in both Los Angeles and the Bronx have been steadily decreasing over the past several years. However, like any major urban area, both cities have neighborhoods with higher rates of crime. LA's crime rate is marginally lower compared to Bronx when considering both property and violent crime. But overall, both places are relatively safe if one takes necessary precautions. Tourists visiting either city should remain vigilant, particularly in crowded areas.
Cost of Living
The cost of living in both cities is relatively high compared to the national average, but Los Angeles generally tops the Bronx, especially in terms of housing costs. Everything from groceries to healthcare tends to be more expensive in LA.
Income Tax
California has a progressive income tax system, with rates ranging from 1% to 13.3%. New York also has a progressive income tax, with rates ranging from 4% to 8.82% - additionally, NYC imposes its own city income tax.
Property Tax
Property tax rates in LA County average about 0.72%, lower than the Bronx's 0.94%. However, due to higher housing prices, the actual amount paid in LA can be higher.
Sales Tax
The overall sales tax rate in Los Angeles is 9.5%, higher than the Bronx's 8.875% rate. However, specifics can vary depending on the type of goods purchased.
Income
Type
Los Angeles
Bronx
Estimated median household income
$70,372
$43,011
Estimated per capita income
$39,509
$23,354
Cost of living index (U.S. average is 100)
145.1
172.8
If you make $50,000 in Los Angeles, you will have to make $59,545 in Bronx to maintain the same standard of living.
Geographical Conditions
LA spans from mountains to ocean, offering a variety of outdoor activities. The Bronx includes plenty of parks, including the famed Bronx Zoo and the New York Botanical Garden, but fewer natural adventure opportunities compared to LA.
Geographical information
Type
Los Angeles
Bronx
Land area
469.1 sq. miles
42 sq. miles
Population density
8,206.1 people per sq. mile
32,928 people per sq. mile
Elevation
330 feet
120 feet
Relative area comparison
Los Angeles, CA Bronx, NY
Education
Both LA and the Bronx boast diverse educational opportunities. LA is home to prestigious schools such as the University of Southern California (USC) and UCLA. The Bronx houses top institutions like Fordham University. For primary and secondary education, both places have public, private, and charter options, although LA has a larger array of choices.
Los Angeles has a stronger and more diverse economy, offering numerous opportunities in entertainment, tech, healthcare, education, and tourism sectors. The Bronx's economy is less diverse, relying heavily on the retail, healthcare, and public sectors. LA's unemployment rate tends to be lower than the Bronx's.
Biggest Employers
In LA, some of the biggest employers include UCLA Health, Northrop Grumman, and Walt Disney Co. In the Bronx, Montefiore Medical Center, the NYC Department of Education, and the USPS are significant employers.
In Los Angeles (Los Angeles County), 69.7% voted for Democrats and 27.8% for Republicans in 2012 Presidential Election. In Bronx (Bronx County), 91.9% voted for Democrats and 8.1% for Republicans.
Elections
Type
Democrats
Republicans
Other
Year
Los Angeles
Bronx
Los Angeles
Bronx
Los Angeles
Bronx
2020
71.0%
83.7%
26.9%
16.0%
2.1%
0.3%
2016
72.0%
88.6%
22.5%
9.5%
5.5%
2.0%
2012
69.7%
91.9%
27.8%
8.1%
2.4%
0.0%
2008
69.2%
89.0%
28.8%
11.0%
1.9%
0.0%
2004
63.3%
82.9%
35.7%
16.5%
1.0%
0.6%
2000
63.6%
86.5%
32.4%
11.8%
4.0%
1.7%
1996
59.3%
85.8%
31.0%
10.5%
9.7%
3.7%
Breakdown of population affiliated with a religious congregation
Type
Adherents
Congregations
Religion
Los Angeles
Bronx
Los Angeles
Bronx
CATHOLIC CHURCH
36.1%
25.5%
4.7%
11.5%
SOUTHERN BAPTIST CONVENTION
1.0%
0.2%
9.0%
2.4%
MUSLIM ESTIMATE
0.7%
2.8%
1.0%
3.9%
AMERICAN BAPTIST CHURCHES IN THE USA
0.5%
0.7%
3.1%
4.4%
SEVENTH DAY ADVENTIST CHURCH
0.5%
0.7%
2.4%
6.5%
EPISCOPAL CHURCH
0.4%
0.4%
1.4%
3.7%
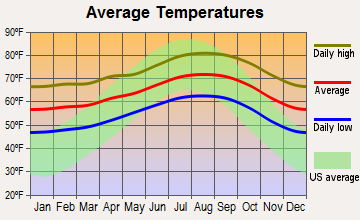
Weather
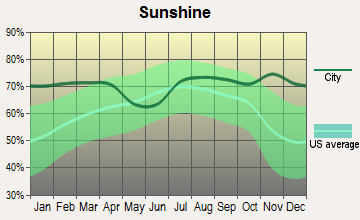
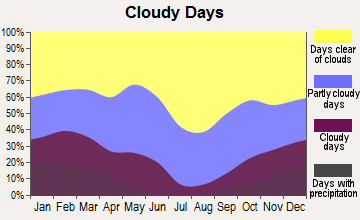
Weather is a notable contrast. Los Angeles is known for its sunny, mild climate, with warm, dry summers and mild, slightly wetter winters, perfect for those who prefer a consistent, warm climate. The Bronx, like the rest of New York City, has a humid subtropical climate, with hot summers and cold winters where snowfall can be expected.
Weather and climate
Type
Los Angeles
Bronx
Temperature - Average
63.9°F
54.7°F
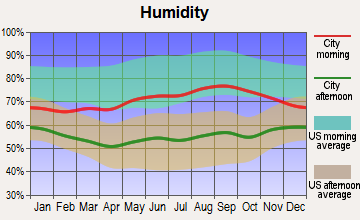
Humidity - Average morning or afternoon humidity
60.9%
67.2%
Humidity - Differences between morning and afternoon humidity
16.1%
26.4%
Humidity - Maximum monthly morning or afternoon humidity
65.1%
75.6%
Humidity - Minimum monthly morning or afternoon humidity
49%
49.2%
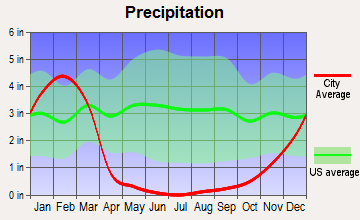
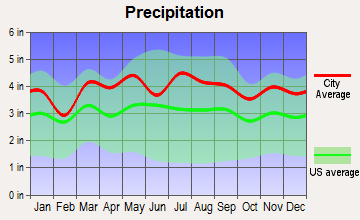
Precipitation - Yearly average
17.1 in
47 in
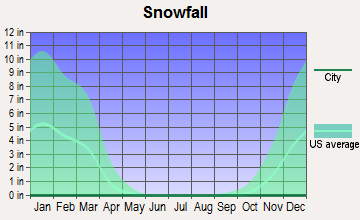
Snowfall - Yearly average
0 in
54.5 in
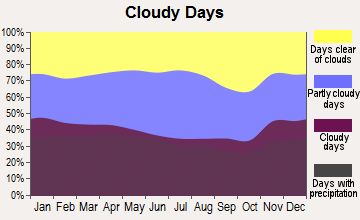
Clouds - Number of days clear of clouds
29.9%
16.5%
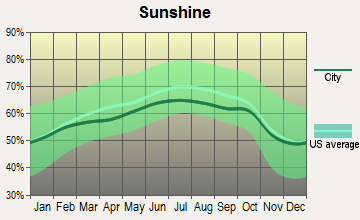
Sunshine amount - Average
78.4%
60.2%
Sunshine amount - Differences during a year
22%
20%
Sunshine amount - Maximum monthly
85%
64%
Sunshine amount - Minimum monthly
63%
44%
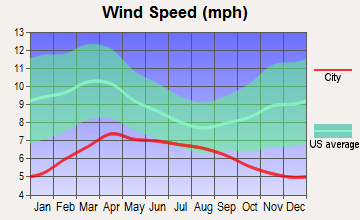
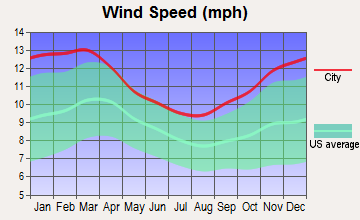
Wind speed - Average
2.1 mph
10.7 mph
Average climate in Los Angeles, California
Average climate in Bronx, New York
Air pollution
Type
AQI
CO
NO2
OZONE
PB
PM10
PM25
SO2
Year
Los Angeles
Bronx
Los Angeles
Bronx
Los Angeles
Bronx
Los Angeles
Bronx
Los Angeles
Bronx
Los Angeles
Bronx
Los Angeles
Bronx
Los Angeles
Bronx
2018
137
102
0.38
0.31
9.9
15.8
26.9
24.4
0.008
N/A
24.4
N/A
16.0
7.4
0.4
0.6
2017
136
100
0.41
0.04
10.3
15.7
27.2
24.6
0.007
N/A
25.0
N/A
16.2
7.0
0.5
0.6
2016
128
98
0.37
0.30
10.0
16.4
27.7
24.6
0.007
N/A
23.8
N/A
15.4
7.2
0.4
0.8
2015
128
105
0.38
0.28
10.9
18.0
28.5
23.6
0.005
N/A
21.8
N/A
17.4
8.6
0.3
1.4
2014
139
99
0.50
0.32
12.0
18.0
27.8
23.6
0.007
N/A
26.4
N/A
19.9
8.4
0.3
1.7
2013
140
103
0.48
0.39
11.8
18.9
26.2
23.5
0.007
N/A
25.5
N/A
19.0
9.3
0.3
2.1
2012
144
104
0.48
0.44
10.9
18.8
26.3
23.9
0.008
N/A
24.8
N/A
19.9
9.7
0.4
3.1
2011
141
113
0.38
0.46
13.4
20.9
24.2
22.1
0.009
N/A
32.4
N/A
18.3
11.6
0.3
4.5
2010
127
113
0.44
0.53
12.2
20.2
23.2
23.7
0.027
N/A
33.9
N/A
17.3
10.8
0.5
4.7
2009
153
107
0.51
0.53
16.0
22.3
24.0
19.5
0.009
N/A
45.2
N/A
18.8
10.8
1.1
5.4
2008
145
114
0.37
0.53
14.0
23.3
24.8
19.9
0.010
0.013
44.7
N/A
19.5
12.1
1.0
5.9
2007
121
122
0.39
0.60
14.0
24.6
24.3
19.1
0.013
0.016
N/A
N/A
N/A
13.2
1.9
7.0
2006
131
120
0.38
0.50
15.4
25.0
23.1
18.9
0.006
0.018
N/A
N/A
N/A
12.8
1.9
7.0
2005
132
115
0.43
0.60
12.8
27.0
24.1
17.8
0.012
N/A
N/A
N/A
N/A
N/A
3.7
9.3
2004
142
109
0.64
0.62
17.6
25.6
27.5
16.7
0.016
0.030
N/A
N/A
N/A
N/A
2.5
8.8
2003
145
110
0.94
0.75
27.1
27.4
19.8
17.1
0.030
0.022
N/A
26.9
N/A
N/A
2.1
8.9
2002
154
124
1.04
0.67
31.3
27.9
21.7
17.4
0.027
0.008
N/A
25.0
N/A
N/A
2.4
8.6
2001
135
126
1.16
0.66
37.0
30.0
18.7
17.8
0.041
0.020
N/A
22.8
N/A
N/A
2.4
10.0
2000
147
115
1.13
0.68
31.1
29.4
16.7
16.0
0.035
0.022
N/A
22.2
N/A
N/A
1.4
10.2
Natural disasters
Type
Los Angeles
Bronx
Tornado activity compared to U.S. average
16.2%
58.3%
Earthquake activity compared to U.S. average
7,082.4%
31%
Natural disasters compared to U.S. average
57%
14%
Transportation
While LA has been investing in public transit, it still lags behind the Bronx, where the NYC subway system has stops in almost every neighborhood. Driving in LA is quite common but comes with heavy traffic, whereas in the Bronx, many residents and tourists rely more on walking, biking, or public transit.
Transport
Type
Los Angeles
Bronx
Amtrak stations
1
0
Amtrak stations nearby
3
3
FAA registered aircraft
669
39
FAA registered aircraft manufacturers and dealers
14
0
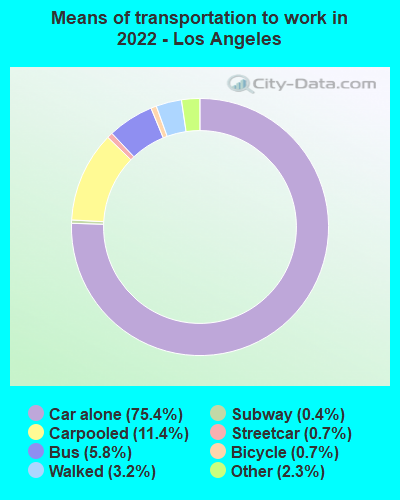
Means of transportation to work
Type
Los Angeles
Bronx
Bicycle
0.6%
0.2%
Bus
5.8%
15.6%
Carpooled
10.6%
9.3%
Car alone
76.5%
27%
Ferryboat
0.2%
0%
Motorcycle
0.2%
0%
Railroad
0.1%
2%
Streetcar
0.5%
0.2%
Subway
0.2%
34.6%
Taxicab
0.1%
1.3%
Walked
3%
7.2%
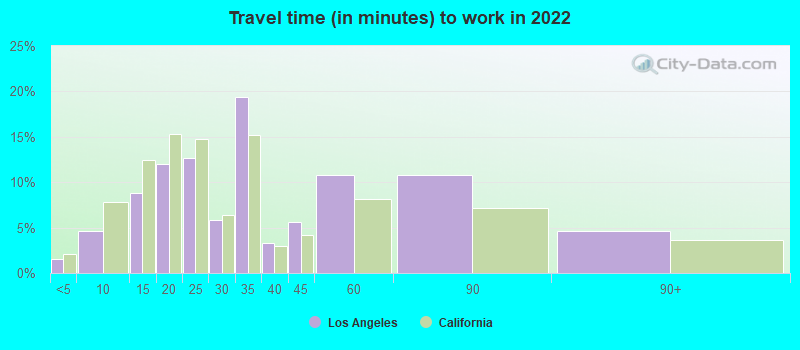
Average travel time to work
Type
Los Angeles
Bronx
Average
34.8 min
44.2 min
Real Estate
Housing prices in Los Angeles are significantly higher than the Bronx. While both cities provide a range of housing types, LA trends toward single-family homes, whereas the Bronx features many high-rises and apartments.
Neighborhoods
Both cities have diverse neighborhoods reflecting their multicultural populace. However, LA's neighborhoods are more spread out and offer different vibes, from laid-back beach towns to bustling downtown areas. The Bronx, while smaller, still boasts vibrant neighborhoods with a strong sense of community.
Houses and residents
Type
Los Angeles
Bronx
Houses
1,542,391
490,659
Average household size (people)
2.8
2.8
Houses occupied
1,410,594 (91.5%)
463,212 (94.4%)
Houses occupied by owners
521,485 (37%)
90,522 (19.5%)
Houses occupied by renters
889,109 (63%)
372,690 (80.5%)
Median rent asked for vacant for-rent units
$2,146
$1,273
Median price asked for vacant for-sale houses and condos
$1,410,311
$708,992
Estimated median house or condo value
$812,800
$465,000
Median number of rooms in apartments
3.4
3.7
Median number of rooms in houses and condos
5.8
5.1
Renting percentage
61.8%
80.7%
Housing density (houses/condos per square mile)
3,288.2
11,675
Household income disparities
47.7%
50.2%
Housing units without a mortgage
5,970 (1.6%)
12,021 (34%)
Housing units with both a second mortgage and home equity loan
28,556 (7.6%)
105 (0.3%)
Housing units with a mortgage
369,242 (98.4%)
23,339 (66%)
Housing units with a home equity loan
2,061 (0.5%)
2,053 (5.8%)
Housing units with a second mortgage
37,750 (10.1%)
2,159 (6.1%)
Housing units lacking complete kitchen facilities
3.1%
1.4%
Housing units lacking complete plumbing facilities
Self-employed workers in own not incorporated business
200,073
16,572
State government workers
54,504
14,515
Unpaid family workers
4,643
1,000
Industries and Occupations
In Los Angeles, the entertainment industry dominates, but healthcare, education, tech, and tourism also provide considerable employment. In the Bronx, healthcare, retail, and public administration are the leading sectors.
Both cities offer excellent healthcare, with world-class hospitals like UCLA Health in Los Angeles and Montefiore in the Bronx. However, expect healthcare costs to be higher in LA.
Health (county statistics)
Type
Los Angeles
Bronx
General health status score of residents in this county from 1 (poor) to 5 (excellent)
Los Angeles is spread out, with substantial suburban areas and a built-for-cars infrastructure. Conversely, the Bronx, like the rest of New York City, is densely populated and walkable, with buildings and services often clustered together. LA is striving to improve its public transit system, while the Bronx benefits from NYC's extensively developed public transportation system.
Infrastructure
Type
Los Angeles
Bronx
Hospitals
62
57
TV stations
21
30
Bank branches located here
385
118
Bank institutions located here
73
24
Main business address for public companies
69
2
Drinking water stations with no reported violations in the past
5
1
Drinking water stations with reported violations in the past
5
4
Schools
School facilities
Type
Los Angeles
Bronx
Private elementary/middle schools
119
54
Private high schools
62
20
Public elementary/middle schools
405
285
Public high schools
167
155
Colleges/Universities
59
9
Culture and Food
Both cities offer robust cultural scenes featuring diverse culinary options, world-renowned museums, and significant musical influences. LA is known for Hollywood, Mexican and Asian-inspired cuisine, while the Bronx offers a rich hip-hop culture and excellent Caribbean, Italian, and Latin American food.
Sports Teams
Sports fans will find lots to cheer for in either city. Los Angeles is home to some big-name teams, including the Lakers, Clippers (NBA), Dodgers (MLB), and Rams, Chargers (NFL). For the Bronx, it's all about the Yankees (MLB), with the rest of NYC's sports teams a short subway ride away.


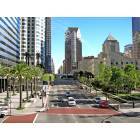


 Los Angeles, CA
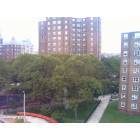
 Bronx, NY