Los Angeles, California, and Manhattan, New York, are two significant metros in the United States. Each city has different characteristics that could appeal to various individuals looking to relocate or visit. To offer a better perspective, we’ll compare them in criteria like cost of living, education, crime, health care, and more. These respective characteristics allow both cities to be highly unique in their own way yet share commonalities in urban living.
Manhattan's crime rate is generally lower than Los Angeles. The LA Metropolitan area has slightly higher incidences of both property and violent crimes. However, certain neighborhoods in both cities can be exceptions to this general rule. For tourists, both cities have particular areas that are safer than others and always recommend being mindful of surroundings, not flaunting expensive belongings, and staying in well-populated areas. Be advised to check the most current crime statistics, as changes can occur frequently.
Cost of Living
The cost of living in Manhattan is generally higher than in Los Angeles. Those looking to relocate should expect to pay more for basics like groceries, housing, and utilities. However, Los Angeles isn't far behind, especially in areas like Hollywood and Beverly Hills.
Income Tax
New York State has a progressive income tax system, and New York City adds its own tax on top of that. California also has a progressive income tax that tends to be higher than New York's especially for high earners.
Property Tax
Overall, property taxes are generally higher in New York compared to California. However, the rates can vary based on the specific city and county.
Sales Tax
New York City has a higher sales tax rate (8.875%) than Los Angeles (9.5%). However, these rates are subject to change and may not include additional local taxes.
Income
Type
Los Angeles
Manhattan
Estimated median household income
$70,372
$84,435
Estimated per capita income
$39,509
$76,589
Cost of living index (U.S. average is 100)
145.1
185.3
If you make $50,000 in Los Angeles, you will have to make $63,853 in Manhattan to maintain the same standard of living.
Geographical Conditions
Los Angeles offers access to both the beach and mountains, providing outdoor enthusiasts with a host of activities. Manhattan is an island city with rivers, but it also has access to several parks, most notably Central Park.
Geographical information
Type
Los Angeles
Manhattan
Land area
469.1 sq. miles
23 sq. miles
Population density
8,206.1 people per sq. mile
70,629 people per sq. mile
Relative area comparison
Los Angeles, CA Manhattan, NY
Education
Both cities boast some of the best schools, colleges, and universities in the nation. Manhattan houses Columbia University and New York University, whereas Los Angeles hosts the University of Southern California and UCLA. However, Manhattan schools tend to have slightly better overall rankings.
Manhattan is a global financial hub with Wall Street and several major corporations. Los Angeles, on the other hand, is renowned for its entertainment industry. The average income in Manhattan is generally higher due to the density of high-paying corporate jobs. However, Los Angeles offers a wider range of job opportunities across industries.
Biggest Employers
Manhattan's biggest employer is the financial sector, with firms like JPMorgan Chase and Citigroup. In Los Angeles, the largest employers include the University of Southern California, Northrop Grumman, and Kaiser Permanente.
In Los Angeles (Los Angeles County), 69.7% voted for Democrats and 27.8% for Republicans in 2012 Presidential Election. In Manhattan (New York County), 83.9% voted for Democrats and 14.9% for Republicans.
Elections
Type
Democrats
Republicans
Other
Year
Los Angeles
Manhattan
Los Angeles
Manhattan
Los Angeles
Manhattan
2020
71.0%
86.5%
26.9%
12.2%
2.1%
1.2%
2016
72.0%
86.7%
22.5%
9.7%
5.5%
3.6%
2012
69.7%
83.9%
27.8%
14.9%
2.4%
1.2%
2008
69.2%
86.1%
28.8%
13.5%
1.9%
0.3%
2004
63.3%
82.3%
35.7%
16.8%
1.0%
0.9%
2000
63.6%
80.0%
32.4%
14.5%
4.0%
5.5%
1996
59.3%
80.0%
31.0%
13.8%
9.7%
6.3%
Breakdown of population affiliated with a religious congregation
Type
Adherents
Congregations
Religion
Los Angeles
Manhattan
Los Angeles
Manhattan
CATHOLIC CHURCH
36.1%
20.4%
4.7%
12.6%
SOUTHERN BAPTIST CONVENTION
1.0%
0.2%
9.0%
2.9%
MUSLIM ESTIMATE
0.7%
2.7%
1.0%
2.4%
AMERICAN BAPTIST CHURCHES IN THE USA
0.5%
1.6%
3.1%
4.7%
SEVENTH DAY ADVENTIST CHURCH
0.5%
0.3%
2.4%
2.4%
EPISCOPAL CHURCH
0.4%
1.7%
1.4%
5.3%
REFORMED CHURCH IN AMERICA
0.1%
0.6%
0.2%
1.2%
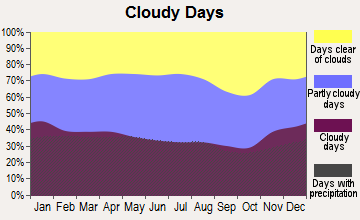
Weather
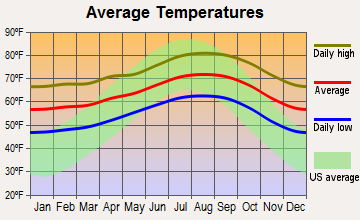
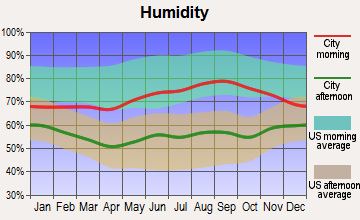
Los Angeles enjoys pleasant, warm weather year-round with about 284 sunny days per year, making outdoor activities feasible across all seasons. Conversely, Manhattan experiences cold winters, pleasant springs and autumns, and hot and humid summers. For people who like variation and season changes, Manhattan may be a better fit.
Weather and climate
Type
Los Angeles
Manhattan
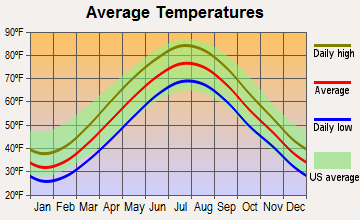
Temperature - Average
63.9°F
54.6°F
Humidity - Average morning or afternoon humidity
60.9%
67.4%
Humidity - Differences between morning and afternoon humidity
16.1%
30%
Humidity - Maximum monthly morning or afternoon humidity
65.1%
77%
Humidity - Minimum monthly morning or afternoon humidity
49%
47%
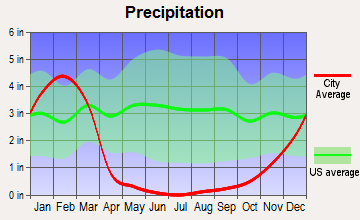
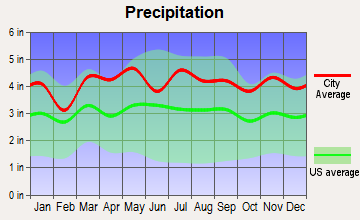
Precipitation - Yearly average
17.1 in
49.6 in
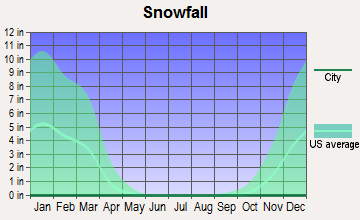
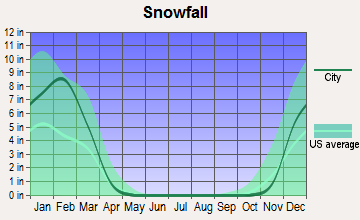
Snowfall - Yearly average
0 in
57.4 in
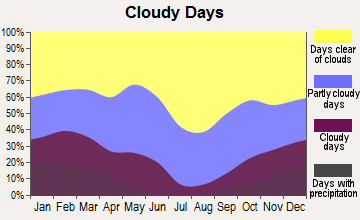
Clouds - Number of days clear of clouds
29.9%
17.8%
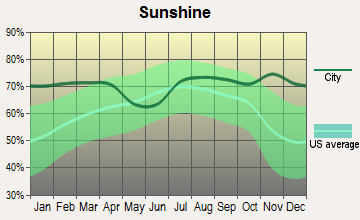
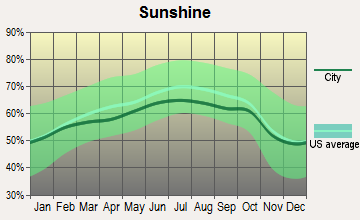
Sunshine amount - Average
78.4%
60.2%
Sunshine amount - Differences during a year
22%
20%
Sunshine amount - Maximum monthly
85%
64%
Sunshine amount - Minimum monthly
63%
44%
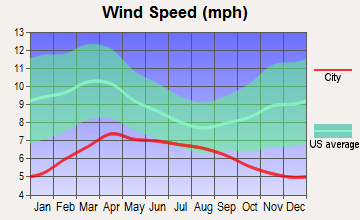
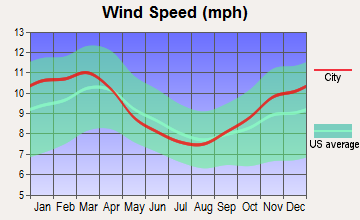
Wind speed - Average
2.1 mph
6.7 mph
Average climate in Los Angeles, California
Average climate in Manhattan, New York
Air pollution
Type
AQI
CO
NO2
OZONE
PB
PM10
PM25
SO2
Year
Los Angeles
Manhattan
Los Angeles
Manhattan
Los Angeles
Manhattan
Los Angeles
Manhattan
Los Angeles
Manhattan
Los Angeles
Manhattan
Los Angeles
Manhattan
Los Angeles
Manhattan
2018
137
94
0.38
0.29
9.9
17.3
26.9
23.9
0.008
N/A
24.4
N/A
16.0
7.9
0.4
0.5
2017
136
97
0.41
0.16
10.3
17.4
27.2
24.0
0.007
N/A
25.0
N/A
16.2
7.7
0.5
0.4
2016
128
94
0.37
0.28
10.0
18.1
27.7
24.2
0.007
N/A
23.8
N/A
15.4
7.7
0.4
0.6
2015
128
100
0.38
0.36
10.9
18.9
28.5
23.0
0.005
N/A
21.8
N/A
17.4
8.6
0.3
1.0
2014
139
95
0.50
0.40
12.0
19.1
27.8
22.3
0.007
N/A
26.4
N/A
19.9
8.3
0.3
1.1
2013
140
97
0.48
0.43
11.8
19.5
26.2
22.6
0.007
N/A
25.5
N/A
19.0
9.0
0.3
1.1
2012
144
99
0.48
0.46
10.9
18.6
26.3
23.4
0.008
N/A
24.8
N/A
19.9
9.3
0.4
1.7
2011
141
108
0.38
0.46
13.4
20.7
24.2
22.2
0.009
N/A
32.4
N/A
18.3
10.9
0.3
2.7
2010
127
113
0.44
0.45
12.2
19.3
23.2
23.3
0.027
N/A
33.9
N/A
17.3
10.4
0.5
2.7
2009
153
104
0.51
0.51
16.0
21.9
24.0
18.8
0.009
N/A
45.2
N/A
18.8
10.7
1.1
3.8
2008
145
110
0.37
0.49
14.0
23.0
24.8
19.8
0.010
0.013
44.7
N/A
19.5
12.3
1.0
4.6
2007
121
121
0.39
0.56
14.0
24.4
24.3
19.4
0.013
0.016
N/A
N/A
N/A
13.1
1.9
5.5
2006
131
116
0.38
0.64
15.4
24.6
23.1
18.9
0.006
0.018
N/A
N/A
N/A
12.9
1.9
6.5
2005
132
112
0.43
0.77
12.8
26.7
24.1
18.4
0.012
N/A
N/A
N/A
N/A
N/A
3.7
8.2
2004
142
108
0.64
0.77
17.6
26.7
27.5
17.3
0.016
0.030
N/A
N/A
N/A
N/A
2.5
8.0
2003
145
107
0.94
0.83
27.1
27.8
19.8
17.5
0.030
0.024
N/A
26.9
N/A
N/A
2.1
8.2
2002
154
122
1.04
0.78
31.3
27.9
21.7
18.7
0.027
0.008
N/A
25.9
N/A
N/A
2.4
7.3
2001
135
123
1.16
0.79
37.0
29.4
18.7
19.4
0.041
0.020
N/A
25.0
N/A
N/A
2.4
8.7
2000
147
115
1.13
0.90
31.1
30.2
16.7
15.0
0.035
0.022
N/A
22.2
N/A
N/A
1.4
8.4
Natural disasters
Type
Los Angeles
Manhattan
Tornado activity compared to U.S. average
16.2%
59.1%
Earthquake activity compared to U.S. average
7,082.4%
31.1%
Natural disasters compared to U.S. average
57%
18%
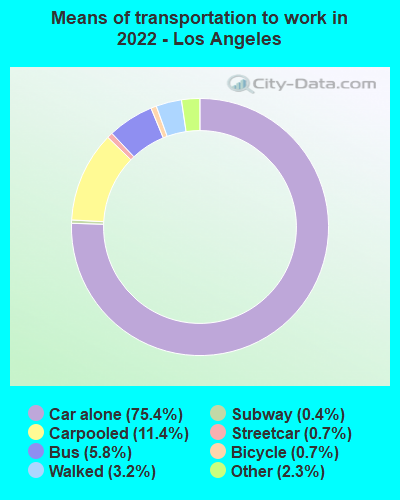
Transportation
Manhattan offers extensive public transportation options, including the subway system, buses, and taxis. Los Angeles is more car-dependent, although it does have a bus and light rail system. Commuting can be more tedious in LA due to heavier traffic patterns.
Transport
Type
Los Angeles
Manhattan
Amtrak stations
1
0
Amtrak stations nearby
3
3
FAA registered aircraft
669
2
FAA registered aircraft manufacturers and dealers
14
0
Means of transportation to work
Type
Los Angeles
Manhattan
Bicycle
0.6%
0.9%
Bus
5.8%
10.1%
Carpooled
10.6%
3.4%
Car alone
76.5%
7.6%
Ferryboat
0.2%
0.1%
Motorcycle
0.2%
0.1%
Railroad
0.1%
1.1%
Streetcar
0.5%
0.1%
Subway
0.2%
43.6%
Taxicab
0.1%
4.7%
Walked
3%
21.9%
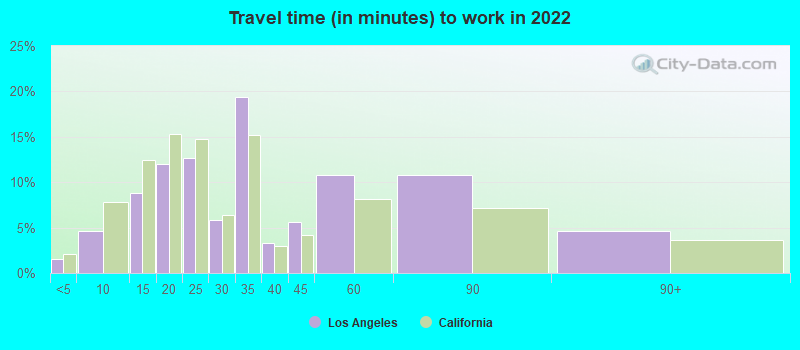
Average travel time to work
Type
Los Angeles
Manhattan
Average
34.8 min
30.3 min
Real Estate
The real estate market in Manhattan is generally pricier compared to Los Angeles. Both cities offer a variety of housing options but expect to pay a premium for desirable locations.
Neighborhoods
Manhattan comprises diverse neighborhoods like Harlem, SoHo, and the Upper East Side, each with its own unique appeal. Los Angeles has its own diverse array of neighborhoods, from the beach vibes of Santa Monica to the posh streets of Beverly Hills.
Houses and residents
Type
Los Angeles
Manhattan
Houses
1,542,391
798,144
Average household size (people)
2.8
2
Houses occupied
1,410,594 (91.5%)
738,644 (92.5%)
Houses occupied by owners
521,485 (37%)
148,695 (20.1%)
Houses occupied by renters
889,109 (63%)
589,949 (79.9%)
Median rent asked for vacant for-rent units
$2,146
$1,690
Median price asked for vacant for-sale houses and condos
$1,410,311
$3,393,315
Estimated median house or condo value
$812,800
$940,900
Median number of rooms in apartments
3.4
3.2
Median number of rooms in houses and condos
5.8
4
Renting percentage
61.8%
77.2%
Housing density (houses/condos per square mile)
3,288.2
34,757
Household income disparities
47.7%
47.8%
Housing units without a mortgage
5,970 (1.6%)
1,104 (40.3%)
Housing units with both a second mortgage and home equity loan
28,556 (7.6%)
13 (0.5%)
Housing units with a mortgage
369,242 (98.4%)
1,636 (59.7%)
Housing units with a home equity loan
2,061 (0.5%)
140 (5.1%)
Housing units with a second mortgage
37,750 (10.1%)
140 (5.1%)
Housing units lacking complete kitchen facilities
3.1%
2%
Housing units lacking complete plumbing facilities
Self-employed workers in own not incorporated business
200,073
69,517
State government workers
54,504
15,544
Unpaid family workers
4,643
1,861
Industries and Occupations
Manhattan's leading industries include finance, advertising, and publishing, with numerous opportunities in legal services and healthcare. In comparison, Los Angeles is best known for entertainment, but also has a robust manufacturing sector, and a growing tech scene, known as Silicon Beach.
Both cities feature world-class healthcare facilities, with Manhattan's NewYork-Presbyterian Hospital and Los Angeles' UCLA Medical Center being highly rated nationally.
Health (county statistics)
Type
Los Angeles
Manhattan
General health status score of residents in this county from 1 (poor) to 5 (excellent)
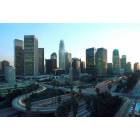
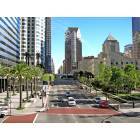
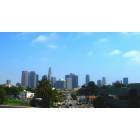
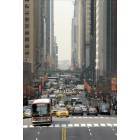
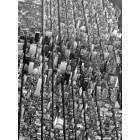
Manhattan, well known for its impressive skyscrapers, also has an extensive public transportation system. Los Angeles, meanwhile, is more spread out with fewer high-rise buildings but more individual houses and wider roads.
Infrastructure
Type
Los Angeles
Manhattan
TV stations
21
30
Culture and Food
Both LA and Manhattan are cultural melting pots. Manhattan boasts diverse cultural institutions like Broadway, the Metropolitan Museum of Art, and a broad culinary scene. Los Angeles is renowned for Hollywood, beautiful beaches, and a culinary scene that heavily features Mexican and Asian cuisine.
Sports Teams
Sports fans can thrive in both cities. Los Angeles is home to the Lakers, Clippers (NBA), Dodgers (MLB), and recently the Rams (NFL). In contrast, Manhattan hosts the Knicks (NBA), Yankees, and Mets (MLB).


 Los Angeles, CA
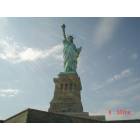
 Manhattan, NY