When comparing Manhattan, NY with Cleveland, OH, it's essential to note the significant differences each city holds. From the hustling and bustling streets of Manhattan to the more laid-back and industry-centric landscape of Cleveland, each city offers a unique experience for both residents and visitors. This comparison will detail crucial elements such as crime/safety, weather, cost of living, education, work and economy, infrastructure, and much more.
Manhattan generally has a higher crime rate than Cleveland, due to its dense population and larger draw of tourists. However, it’s important to note that the crime rate is not uniform across Manhattan; certain neighborhoods are safer than others. Meanwhile, Cleveland's crime rate is lower, and it experiences less tourist-centric crime. Both cities invest heavily in public safety, with dedicated law enforcement officers and support services.
Cost of Living
The cost of living in Manhattan is significantly higher than in Cleveland. This pertains to housing, food, transportation, and general expenses. Cleveland, with its more affordable living costs, can provide a comfortable life at a lower price point.
Income Tax
New York has a high income tax rate, with additional surcharges for residents of New York City, including Manhattan. In contrast, Ohio has a more moderate income tax rate, and Cleveland doesn't add an additional city tax.
Property Tax
Property taxes in both cities are significant, though Manhattan's rates tend to be higher due to the city's high property values. Cleveland's property tax is slightly lower in rate, but the overall cost depends on the property's value.
Sales Tax
Both Manhattan and Cleveland have relatively high sales taxes. Manhattan charges a combined city and state sales tax of 8.875%, while Cleveland's combined rate is 8%.
Income
Type
Manhattan
Cleveland
Estimated median household income
$84,435
$35,562
Estimated per capita income
$76,589
$24,093
Cost of living index (U.S. average is 100)
185.3
94.3
If you make $50,000 in Cleveland, you will have to make $98,250 in Manhattan to maintain the same standard of living.
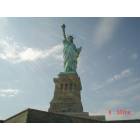
Geographical Conditions
Manhattan is an island, with the Hudson River to its west and the East River to its east. It's densely populated with a bustling urban landscape. Cleveland, on the other hand, is located on the southern shore of Lake Erie and characterized by a more suburban feel.
Geographical information
Type
Manhattan
Cleveland
Land area
23 sq. miles
77.6 sq. miles
Population density
70,629 people per sq. mile
4,743.4 people per sq. mile
Relative area comparison
Manhattan, NY Cleveland, OH
Education
Manhattan boasts an extensive range of educational opportunities, with world-renowned universities and institutions. Cleveland also has strong educational institutions, including Cleveland State University, but overall, Manhattan offers a more diverse array of options.
Manhattan's economy is diverse and robust, with sectors like finance, fashion, and media leading the way. Cleveland, on the other hand, leans towards healthcare and manufacturing. Both cities offer promising job markets, but the opportunities vary greatly in nature.
Biggest Employers
In Manhattan, the biggest employers are large corporations such as JPMorgan Chase and CitiGroup. In Cleveland, healthcare institutions, notably the Cleveland Clinic and University Hospitals, are the top employers.
In Manhattan (New York County), 83.9% voted for Democrats and 14.9% for Republicans in 2012 Presidential Election. In Cleveland (Cuyahoga County), 69.7% voted for Democrats and 29.7% for Republicans.
Elections
Type
Democrats
Republicans
Other
Year
Manhattan
Cleveland
Manhattan
Cleveland
Manhattan
Cleveland
2020
86.5%
66.5%
12.2%
32.4%
1.2%
1.1%
2016
86.7%
65.5%
9.7%
30.3%
3.6%
4.1%
2012
83.9%
69.7%
14.9%
29.7%
1.2%
0.5%
2008
86.1%
69.1%
13.5%
30.1%
0.3%
0.8%
2004
82.3%
66.6%
16.8%
32.9%
0.9%
0.5%
2000
80.0%
62.9%
14.5%
33.6%
5.5%
3.5%
1996
80.0%
60.8%
13.8%
29.1%
6.3%
10.1%
Breakdown of population affiliated with a religious congregation
Type
Adherents
Congregations
Religion
Manhattan
Cleveland
Manhattan
Cleveland
CATHOLIC CHURCH
20.4%
28.6%
12.6%
11.3%
MUSLIM ESTIMATE
2.7%
0.3%
2.4%
1.4%
EPISCOPAL CHURCH
1.7%
0.6%
5.3%
2.2%
AMERICAN BAPTIST CHURCHES IN THE USA
1.6%
1.6%
4.7%
3.2%
REFORMED CHURCH IN AMERICA
0.6%
0.0%
1.2%
0.3%
PATRIAR PARISHE RUSSIAN ORTHODO CHURCH USA
0.4%
0.0%
0.2%
0.0%
EVANGELICAL LUTHERAN CHURCH IN AMERICA
0.3%
1.1%
2.0%
3.9%
SEVENTH DAY ADVENTIST CHURCH
0.3%
0.4%
2.4%
1.6%
SOUTHERN BAPTIST CONVENTION
0.2%
0.4%
2.9%
3.0%
LUTHERAN CHURCH
0.0%
1.4%
0.6%
4.0%
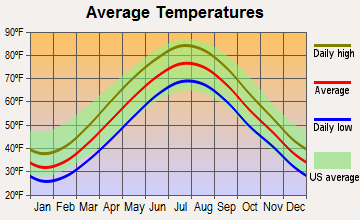
Weather
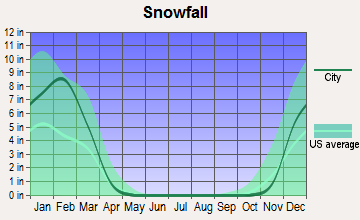
The weather in Manhattan, with humid summers and chilly winters, is typically more diverse than Cleveland. Cleveland generally has a milder climate with cooler summers and more pronounced winters due to its location near Lake Erie. Snowfall is heavier in Cleveland, making winter sports more accessible.
Weather and climate
Type
Manhattan
Cleveland
Temperature - Average
54.6°F
50.1°F
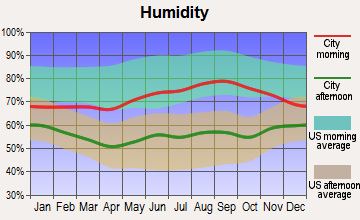
Humidity - Average morning or afternoon humidity
67.4%
75.8%
Humidity - Differences between morning and afternoon humidity
30%
27%
Humidity - Maximum monthly morning or afternoon humidity
77%
83%
Humidity - Minimum monthly morning or afternoon humidity
47%
56%
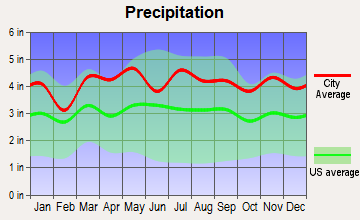
Precipitation - Yearly average
49.6 in
38.5 in
Snowfall - Yearly average
57.4 in
115.9 in
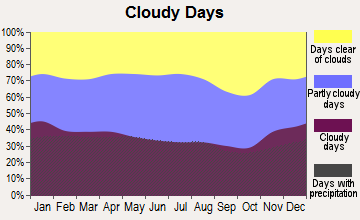
Clouds - Number of days clear of clouds
17.8%
11.2%
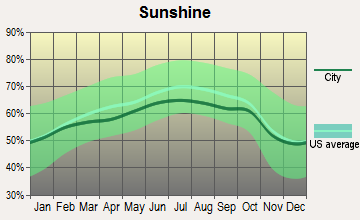
Sunshine amount - Average
60.2%
51.8%
Sunshine amount - Differences during a year
20%
44%
Sunshine amount - Maximum monthly
64%
66%
Sunshine amount - Minimum monthly
44%
22%
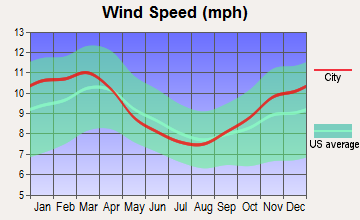
Wind speed - Average
6.7 mph
10.4 mph
Average climate in Manhattan, New York
Average climate in Cleveland, Ohio
Air pollution
Type
AQI
CO
NO2
OZONE
PB
PM10
PM25
SO2
Year
Manhattan
Cleveland
Manhattan
Cleveland
Manhattan
Cleveland
Manhattan
Cleveland
Manhattan
Manhattan
Cleveland
Manhattan
Cleveland
Manhattan
Cleveland
2018
94
85
0.29
0.26
17.3
11.3
23.9
26.9
N/A
N/A
N/A
22.7
7.9
9.3
0.5
0.6
2017
97
82
0.16
0.27
17.4
11.4
24.0
27.6
N/A
N/A
N/A
23.2
7.7
8.2
0.4
0.5
2016
94
81
0.28
0.27
18.1
11.1
24.2
27.1
N/A
N/A
N/A
23.4
7.7
9.9
0.6
1.0
2015
100
76
0.36
0.27
18.9
12.9
23.0
25.1
N/A
N/A
N/A
31.5
8.6
8.0
1.0
1.9
2014
95
83
0.40
0.25
19.1
12.3
22.3
23.7
N/A
N/A
N/A
28.4
8.3
10.6
1.1
1.7
2013
97
88
0.43
0.24
19.5
12.9
22.6
23.8
N/A
N/A
N/A
27.3
9.0
12.0
1.1
1.9
2012
99
119
0.46
0.28
18.6
13.7
23.4
26.5
N/A
N/A
N/A
32.0
9.3
15.2
1.7
2.5
2011
108
110
0.46
0.29
20.7
15.3
22.2
25.8
N/A
N/A
N/A
29.7
10.9
16.1
2.7
3.4
2010
113
113
0.45
0.35
19.3
15.8
23.3
27.0
N/A
N/A
N/A
24.2
10.4
18.7
2.7
3.6
2009
104
67
0.51
0.37
21.9
17.1
18.8
26.0
N/A
N/A
N/A
21.5
10.7
N/A
3.8
3.7
2008
110
87
0.49
0.29
23.0
15.2
19.8
32.9
0.013
N/A
N/A
27.1
12.3
N/A
4.6
4.2
2007
121
94
0.56
0.29
24.4
18.1
19.4
32.9
0.016
N/A
N/A
30.3
13.1
N/A
5.5
5.2
2006
116
75
0.64
0.25
24.6
16.2
18.9
27.7
0.018
N/A
N/A
27.3
12.9
N/A
6.5
5.0
2005
112
98
0.77
0.27
26.7
19.2
18.4
28.6
N/A
N/A
N/A
31.7
N/A
N/A
8.2
5.7
2004
108
77
0.77
0.47
26.7
19.5
17.3
20.1
0.030
N/A
N/A
29.2
N/A
N/A
8.0
3.8
2003
107
81
0.83
0.49
27.8
19.6
17.5
25.8
0.024
N/A
26.9
28.3
N/A
N/A
8.2
5.7
2002
122
95
0.78
0.40
27.9
19.8
18.7
28.6
0.008
N/A
25.9
32.5
N/A
N/A
7.3
5.1
2001
123
91
0.79
0.43
29.4
21.1
19.4
28.4
0.020
N/A
25.0
35.9
N/A
N/A
8.7
5.9
2000
115
79
0.90
0.48
30.2
20.5
15.0
25.2
0.022
N/A
22.2
35.9
N/A
N/A
8.4
5.8
Natural disasters
Type
Manhattan
Cleveland
Tornado activity compared to U.S. average
59.1%
93%
Earthquake activity compared to U.S. average
31.1%
50.2%
Natural disasters compared to U.S. average
18%
16%
Transportation
Manhattan's public transit system is extensive and reliable, with subways reaching most corners of the city. For Cleveland, public transit is less prevalent, and commuting relies heavily on cars.
Transport
Type
Manhattan
Cleveland
Amtrak stations
0
1
Amtrak stations nearby
3
1
FAA registered aircraft
2
307
FAA registered aircraft manufacturers and dealers
0
19
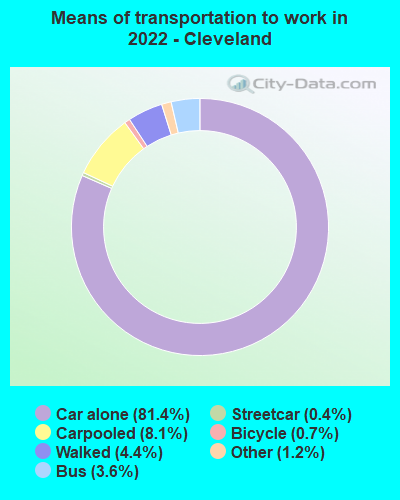
Means of transportation to work
Type
Manhattan
Cleveland
Bicycle
0.9%
0.2%
Bus
10.1%
3.5%
Carpooled
3.4%
7.7%
Car alone
7.6%
83.1%
Railroad
1.1%
0.1%
Streetcar
0.1%
0.4%
Subway
43.6%
0%
Taxicab
4.7%
0.1%
Walked
21.9%
3.9%
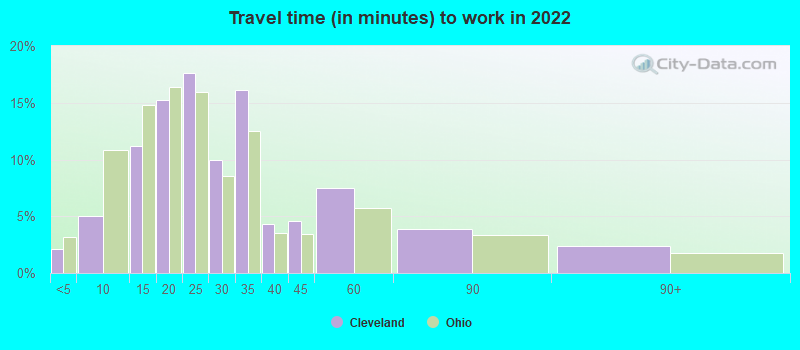
Average travel time to work
Type
Manhattan
Cleveland
Average
30.3 min
28.9 min
Real Estate
Manhattan real estate is notoriously expensive, but comes with the benefit of living in one of the world's most vibrant cities. On the other hand, Cleveland's real estate market is much more affordable and offers significant space and comfort.
Neighborhoods
Manhattan is known for its diverse neighborhoods, each having its unique character. Whether it's the artsy vibe of SoHo or the upscale feel of Upper East Side, there's a place for everyone. Cleveland also offers an array of neighborhoods, each with its charm, like the cultural hub of University Circle.
Houses and residents
Type
Manhattan
Cleveland
Houses
798,144
202,735
Average household size (people)
2
2.3
Houses occupied
738,644 (92.5%)
171,321 (84.5%)
Houses occupied by owners
148,695 (20.1%)
67,039 (39.1%)
Houses occupied by renters
589,949 (79.9%)
104,282 (60.9%)
Median rent asked for vacant for-rent units
$1,690
$1,284
Median price asked for vacant for-sale houses and condos
$3,393,315
$86,306
Estimated median house or condo value
$940,900
$83,400
Median number of rooms in apartments
3.2
4.4
Median number of rooms in houses and condos
4
6.3
Renting percentage
77.2%
55.9%
Housing density (houses/condos per square mile)
34,757
2,613.2
Household income disparities
47.8%
48.5%
Housing units without a mortgage
1,104 (40.3%)
2,325 (6.3%)
Housing units with both a second mortgage and home equity loan
13 (0.5%)
2,348 (6.4%)
Housing units with a mortgage
1,636 (59.7%)
34,401 (93.7%)
Housing units with a home equity loan
140 (5.1%)
166 (0.5%)
Housing units with a second mortgage
140 (5.1%)
3,335 (9.1%)
Housing units lacking complete kitchen facilities
2%
8.8%
Housing units lacking complete plumbing facilities
Self-employed workers in own not incorporated business
69,517
7,246
State government workers
15,544
2,212
Unpaid family workers
1,861
328
Industries and Occupations
In Manhattan, finance and media are the primary industries, and many people work in white-collar jobs. On the other hand, Cleveland is more focused on healthcare and manufacturing sectors, and the jobs are more evenly distributed between white and blue-collar occupations.
Both cities have excellent healthcare facilities. Manhattan boasts hospitals like Mount Sinai and New York-Presbyterian, while Cleveland is famous for the Cleveland Clinic, one of the best hospitals worldwide.
Health (county statistics)
Type
Manhattan
Cleveland
General health status score of residents in this county from 1 (poor) to 5 (excellent)
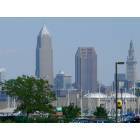
Manhattan is known for its impressive skyscrapers and well-established public transit system. Cleveland boasts well-maintained roads, bridges, and other infrastructure. Both cities prioritize maintaining and improving their infrastructure.
Infrastructure
Type
Manhattan
Cleveland
TV stations
30
16
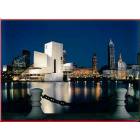
Culture and Food
Manhattan is known for its diverse cultural scene, hosting numerous internationally acclaimed museums, art galleries, theaters, and a vibrant culinary scene. Cleveland also offers a rich culture, especially in the music scene as the home of Rock and Roll Hall of Fame, and a food scene that's gaining national recognition.
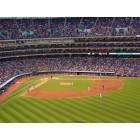
Sports Teams
Manhattan is home to legendary sports teams like the New York Yankees, Knicks, and Rangers. Cleveland also boasts a rich sports tradition with iconic teams such as the Cleveland Browns in the NFL and Cleveland Cavaliers in the NBA.
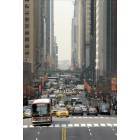


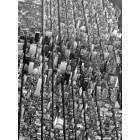


 Manhattan, NY
 Cleveland, OH