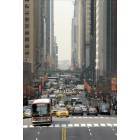
Manhattan, New York and Columbus, Ohio are two very different cities in terms of geography, weather, culture, and economic opportunities. Each city has its own unique characteristics that appeal to different groups of people. Manhattan is known for its busy, cosmopolitan lifestyle, while Columbus offers a laid-back, Midwestern charm. This comparison will delve into significant differences and similarities between the two cities, focusing not only on people contemplating relocation but also on tourists considering a visit to either city.
Safety varies significantly across different areas of both cities. While Manhattan has a higher crime rate than Columbus, it's essential to remember that Manhattan is vastly more populated. However, both locations have neighborhoods considered safe and others with higher crime rates. In terms of advocating city safety, Manhattan and Columbus both employ large and well-funded police departments, and are investing in community-oriented approaches to preventive policing.
Cost of Living
Cost of living is significantly higher in Manhattan than in Columbus. Housing, groceries, transportation, and healthcare are all notably more expensive in Manhattan. This disparity is due to a variety of factors, including Manhattan's status as a global city and its high population density.
Income Tax
New York's income tax is higher than Ohio's. For those working in Manhattan, there's an additional income tax levied by New York City.
Property Tax
New York City's property tax rates are generally lower than in Columbus. However, due to the high property values in Manhattan, homeowners often end up paying more in absolute dollars.
Sales Tax
New York City, including Manhattan, has a higher combined state and city sales tax rate than Columbus.
Income
Type
Manhattan
Columbus
Estimated median household income
$84,435
$58,202
Estimated per capita income
$76,589
$32,392
Cost of living index (U.S. average is 100)
185.3
96.1
If you make $50,000 in Columbus, you will have to make $96,410 in Manhattan to maintain the same standard of living.
Geographical Conditions
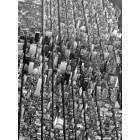
Manhattan, an island bounded by the Hudson, East, and Harlem rivers, is known for its skyline, while Columbus is characterized by flat topography typical of the Midwestern United States.
Geographical information
Type
Manhattan
Columbus
Land area
23 sq. miles
210.3 sq. miles
Population density
70,629 people per sq. mile
4,311.3 people per sq. mile
Relative area comparison
Manhattan, NY Columbus, OH
Education
New York City possesses some of the most prestigious universities in the world, such as Columbia University and New York University. In addition, Manhattan's public and private schools are considered among the best nationwide. Although Columbus is home to the renowned Ohio State University, Manhattan generally offers more educational opportunities.
Manhattan's economy is strong and diversified, boasting significant industries like finance, fashion, media, tech, and tourism. However, the cost of doing business can be prohibitive. In contrast, Columbus's economy is growing, and although it doesn't match Manhattan's economic output, it's known for sectors like education, government, insurance, banking, fashion, defense, and healthcare.
Biggest Employers
In Manhattan, the biggest employers include JPMorgan Chase, Citigroup, and New York-Presbyterian Hospital. Columbus' major employers include Ohio State University, the state of Ohio, and JP Morgan Chase.
In Manhattan (New York County), 83.9% voted for Democrats and 14.9% for Republicans in 2012 Presidential Election. In Columbus (Franklin County), 60.8% voted for Democrats and 37.9% for Republicans.
Elections
Type
Democrats
Republicans
Other
Year
Manhattan
Columbus
Manhattan
Columbus
Manhattan
Columbus
2020
86.5%
64.7%
12.2%
33.4%
1.2%
1.9%
2016
86.7%
59.8%
9.7%
33.9%
3.6%
6.2%
2012
83.9%
60.8%
14.9%
37.9%
1.2%
1.3%
2008
86.1%
59.8%
13.5%
39.0%
0.3%
1.2%
2004
82.3%
54.5%
16.8%
45.2%
0.9%
0.3%
2000
80.0%
48.9%
14.5%
47.9%
5.5%
3.2%
1996
80.0%
48.1%
13.8%
44.5%
6.3%
7.3%
Breakdown of population affiliated with a religious congregation
Type
Adherents
Congregations
Religion
Manhattan
Columbus
Manhattan
Columbus
CATHOLIC CHURCH
20.4%
13.2%
12.6%
5.6%
MUSLIM ESTIMATE
2.7%
1.3%
2.4%
1.9%
EPISCOPAL CHURCH
1.7%
0.4%
5.3%
1.3%
AMERICAN BAPTIST CHURCHES IN THE USA
1.6%
1.0%
4.7%
3.3%
REFORMED CHURCH IN AMERICA
0.6%
0.0%
1.2%
0.1%
PATRIAR PARISHE RUSSIAN ORTHODO CHURCH USA
0.4%
0.0%
0.2%
0.0%
EVANGELICAL LUTHERAN CHURCH IN AMERICA
0.3%
1.6%
2.0%
3.7%
SEVENTH DAY ADVENTIST CHURCH
0.3%
0.4%
2.4%
2.0%
SOUTHERN BAPTIST CONVENTION
0.2%
1.6%
2.9%
6.8%
VINEYARD USA
0.0%
1.3%
0.1%
1.2%
Weather
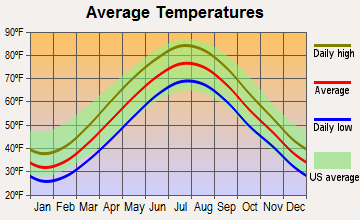
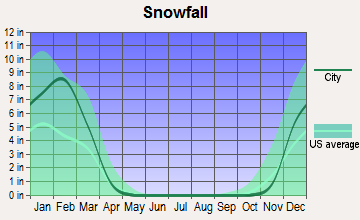
The climates of Manhattan and Columbus are slightly different. Manhattan experiences a humid subtropical climate with hot summers and cold winters while Columbus has a humid continental climate with hot, humid summers and cold, dry winters. Though both cities endure snowy winters, Manhattan usually gets less snow than Columbus due to its proximity to the Atlantic Ocean.
Weather and climate
Type
Manhattan
Columbus
Temperature - Average
54.6°F
52.8°F
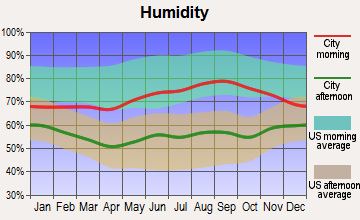
Humidity - Average morning or afternoon humidity
67.4%
74.8%
Humidity - Differences between morning and afternoon humidity
30%
34%
Humidity - Maximum monthly morning or afternoon humidity
77%
86%
Humidity - Minimum monthly morning or afternoon humidity
47%
52%
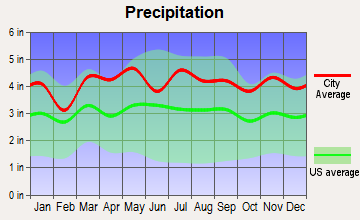
Precipitation - Yearly average
49.6 in
39.3 in
Snowfall - Yearly average
57.4 in
56.6 in
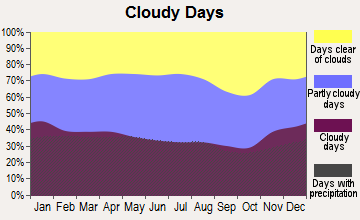
Clouds - Number of days clear of clouds
17.8%
12%
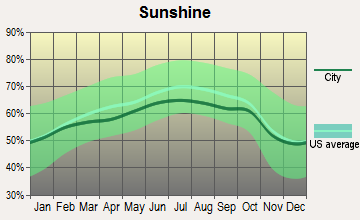
Sunshine amount - Average
60.2%
49.7%
Sunshine amount - Differences during a year
20%
27%
Sunshine amount - Maximum monthly
64%
55%
Sunshine amount - Minimum monthly
44%
28%
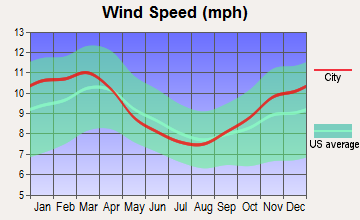
Wind speed - Average
6.7 mph
8.2 mph
Average climate in Manhattan, New York
Average climate in Columbus, Ohio
Air pollution
Type
AQI
CO
NO2
OZONE
PB
PM10
PM25
SO2
Year
Manhattan
Columbus
Manhattan
Columbus
Manhattan
Columbus
Manhattan
Columbus
Manhattan
Manhattan
Columbus
Manhattan
Columbus
Manhattan
Columbus
2018
94
69
0.29
0.11
17.3
10.0
23.9
33.8
N/A
N/A
N/A
N/A
7.9
6.0
0.5
0.0
2017
97
68
0.16
0.16
17.4
9.6
24.0
28.7
N/A
N/A
N/A
N/A
7.7
5.5
0.4
0.1
2016
94
76
0.28
0.17
18.1
10.6
24.2
28.5
N/A
N/A
N/A
N/A
7.7
5.6
0.6
0.1
2015
100
74
0.36
0.16
18.9
11.3
23.0
27.0
N/A
N/A
N/A
N/A
8.6
6.1
1.0
0.1
2014
95
82
0.40
0.20
19.1
11.0
22.3
28.5
N/A
N/A
N/A
N/A
8.3
7.4
1.1
0.5
2013
97
78
0.43
N/A
19.5
8.9
22.6
29.6
N/A
N/A
N/A
N/A
9.0
7.8
1.1
0.6
2012
99
87
0.46
N/A
18.6
N/A
23.4
32.9
N/A
N/A
N/A
N/A
9.3
8.9
1.7
N/A
2011
108
89
0.46
N/A
20.7
N/A
22.2
28.1
N/A
N/A
N/A
N/A
10.9
8.9
2.7
N/A
2010
113
90
0.45
N/A
19.3
N/A
23.3
30.5
N/A
N/A
N/A
N/A
10.4
9.1
2.7
N/A
2009
104
61
0.51
N/A
21.9
N/A
18.8
28.7
N/A
N/A
N/A
N/A
10.7
N/A
3.8
N/A
2008
110
65
0.49
N/A
23.0
N/A
19.8
31.2
0.013
N/A
N/A
N/A
12.3
N/A
4.6
1.8
2007
121
80
0.56
N/A
24.4
N/A
19.4
30.8
0.016
N/A
N/A
N/A
13.1
N/A
5.5
2.8
2006
116
75
0.64
N/A
24.6
N/A
18.9
30.0
0.018
N/A
N/A
23.7
12.9
N/A
6.5
3.3
2005
112
87
0.77
N/A
26.7
N/A
18.4
29.6
N/A
N/A
N/A
27.5
N/A
N/A
8.2
4.1
2004
108
77
0.77
N/A
26.7
N/A
17.3
27.8
0.030
N/A
N/A
24.6
N/A
N/A
8.0
4.4
2003
107
91
0.83
N/A
27.8
N/A
17.5
26.4
0.024
N/A
26.9
23.9
N/A
N/A
8.2
4.1
2002
122
93
0.78
N/A
27.9
N/A
18.7
31.3
0.008
N/A
25.9
25.7
N/A
N/A
7.3
4.1
2001
123
84
0.79
N/A
29.4
N/A
19.4
29.2
0.020
N/A
25.0
25.9
N/A
N/A
8.7
3.5
2000
115
57
0.90
N/A
30.2
N/A
15.0
N/A
0.022
N/A
22.2
23.5
N/A
N/A
8.4
3.7
Natural disasters
Type
Manhattan
Columbus
Tornado activity compared to U.S. average
59.1%
119.1%
Earthquake activity compared to U.S. average
31.1%
96.1%
Natural disasters compared to U.S. average
18%
16%
Transportation
Manhattan, with a well-established transit system, including subways, buses, and taxis, offers comprehensive intra-city connectivity. Columbus's public transportation largely consists of buses, though many residents also depend on cars for commuting.
Transport
Type
Manhattan
Columbus
Amtrak stations
0
1
Amtrak stations nearby
3
1
FAA registered aircraft
2
415
FAA registered aircraft manufacturers and dealers
0
4
Means of transportation to work
Type
Manhattan
Columbus
Bicycle
0.9%
0.6%
Bus
10.1%
1.6%
Carpooled
3.4%
7.4%
Car alone
7.6%
86.7%
Railroad
1.1%
0%
Streetcar
0.1%
0%
Subway
43.6%
0%
Taxicab
4.7%
0.1%
Walked
21.9%
2.2%
Average travel time to work
Type
Manhattan
Columbus
Average
30.3 min
26.1 min
Real Estate
Manhattan's real estate is notoriously expensive, with a median home price substantially above the national average. Conversely, Columbus's real estate market is considered more affordable with a lower median home price.
Neighborhoods
Both cities have neighborhoods rich in history and culture. Manhattan is known for its iconic neighborhoods like SoHo, Greenwich Village, and Tribeca. Columbus boasts neighborhoods like German Village, the Short North, and Victorian Village, all offering different cultural experiences.
Houses and residents
Type
Manhattan
Columbus
Houses
798,144
422,120
Average household size (people)
2
2.3
Houses occupied
738,644 (92.5%)
390,605 (92.5%)
Houses occupied by owners
148,695 (20.1%)
175,427 (44.9%)
Houses occupied by renters
589,949 (79.9%)
215,178 (55.1%)
Median rent asked for vacant for-rent units
$1,690
$1,371
Median price asked for vacant for-sale houses and condos
$3,393,315
$195,022
Estimated median house or condo value
$940,900
$219,200
Median number of rooms in apartments
3.2
4.2
Median number of rooms in houses and condos
4
6.3
Renting percentage
77.2%
53%
Housing density (houses/condos per square mile)
34,757
2,007.5
Household income disparities
47.8%
42.4%
Housing units without a mortgage
1,104 (40.3%)
4,290 (3.3%)
Housing units with both a second mortgage and home equity loan
13 (0.5%)
10,651 (8.2%)
Housing units with a mortgage
1,636 (59.7%)
125,487 (96.7%)
Housing units with a home equity loan
140 (5.1%)
775 (0.6%)
Housing units with a second mortgage
140 (5.1%)
13,558 (10.4%)
Housing units lacking complete kitchen facilities
2%
1.6%
Housing units lacking complete plumbing facilities
Self-employed workers in own not incorporated business
69,517
20,915
State government workers
15,544
31,881
Unpaid family workers
1,861
724
Industries and Occupations
Finance, real estate, and healthcare dominate Manhattan, while in Columbus, the economy is more diversified with large sectors in education, government, and healthcare. Though both cities offer varied occupational opportunities, the larger number of multinational corporations in Manhattan often provides more job variety.
Both cities have excellent healthcare facilities. While Manhattan is known for its medical research institutions, Columbus is home to some of the best hospitals in the Midwest.
Health (county statistics)
Type
Manhattan
Columbus
General health status score of residents in this county from 1 (poor) to 5 (excellent)
Manhattan, being older and denser, has a well-established infrastructure, including an extensive public transportation system, a multitude of high-rise buildings, parks, and cultural institutions. Columbus, while not as dense or tall, also boasts well-developed infrastructure and has been consistently investing in infrastructural improvement projects.
Infrastructure
Type
Manhattan
Columbus
TV stations
30
14
Culture and Food
Manhattan is among the world's cultural hubs, housing numerous museums, theaters, and dining options from global cuisines. Columbus also has a vibrant cultural scene and is known for its Midwestern hospitality and its burgeoning food and craft beer scene.
Sports Teams
Manhattan, part of the larger New York City, has multiple professional sports teams across different sports. Columbus is home to the NHL's Blue Jackets, the MLS's Crew, and the Triple-A affiliate of the Cleveland Indians.


 Manhattan, NY
 Columbus, OH