Manhattan, New York, and San Francisco, California, are two of the most iconic cities in the United States. Each presents a unique lifestyle shaped by diverse economies, cultural heritage, and geographical landscapes. Comparisons between them extend from economics and infrastructure to culture and healthcare, but the choice depends largely on personal preference and individual needs. The following comparison details key topics to provide a comprehensive understanding of living experiences in both cities.
Both Manhattan and San Francisco are generally safe; however, different neighborhoods within each city vary in safety levels. Given their larger populations and higher tourist activities, petty crimes, particularly theft and burglaries, are common. San Francisco has seen an increase in car break-ins, primarily in tourist areas. In Manhattan, assaults and robberies are the most significant crime concerns. Overall, police presence and community watches enhance safety in both cities.
Cost of Living
The cost of living in both Manhattan and San Francisco is amongst the highest in the US and well above the national average. San Francisco slightly outpaces Manhattan in overall cost, largely due to higher housing costs. Day-to-day expenses like groceries and dining out are also somewhat higher in San Francisco than in Manhattan.
Income Tax
New York City has an additional city income tax on top of the New York State income tax, ranging between 3.078% to 3.876%. California has a progressive state income tax, with a maximum marginal tax rate of 13.3%, one of the highest in the country.
Property Tax
Manhattan's effective property tax rate is 0.883% but may vary due to the tax class and assessed value of the property. San Francisco, on the other hand, has a lower property tax rate of 0.634%.
Sales Tax
Sales tax in Manhattan is 8.875%, which consists of New York State Sales and Use Tax (4%) and Metropolitan Commuter Transportation District surcharge (0.375%). San Francisco has a higher sales tax rate at 8.5%.
Income
Type
Manhattan
San Francisco
Estimated median household income
$84,435
$121,826
Estimated per capita income
$76,589
$80,383
Cost of living index (U.S. average is 100)
185.3
141.1
If you make $50,000 in San Francisco, you will have to make $65,663 in Manhattan to maintain the same standard of living.
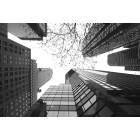
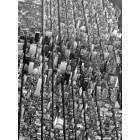
Geographical Conditions
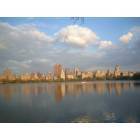
Manhattan, an island surrounded by the Hudson River, features a skyline filled with towering skyscrapers. San Francisco, located on a peninsula, is defined by its hilly topography, bay views, and iconic suspension bridges.
Geographical information
Type
Manhattan
San Francisco
Land area
23 sq. miles
46.7 sq. miles
Population density
70,629 people per sq. mile
17,458 people per sq. mile
Relative area comparison
Manhattan, NY San Francisco, CA
Education
Both cities boast world-class educational institutions at all levels. San Francisco is home to the esteemed University of California, San Francisco, and San Francisco State University. Manhattan holds Columbia University and New York University among others. These cities offer a robust public school system, as well as private and charter schools for K-12 students.
San Francisco's economy is fueled by high-tech industries,-startups, and healthcare while Manhattan is the world's leading financial center, home to Wall Street and numerous multinational corporations. Although both cities have strong economies, the cost of living and competitive job market make it challenging for some to maintain an adequate standard of living without a well-paying job.
Biggest Employers
In Manhattan, the biggest employers are JP Morgan Chase, Citigroup, and NewYork-Presbyterian University Hospital. In San Francisco, the largest employers include Salesforce, the City and County of San Francisco, and the University of California - San Francisco.
In Manhattan (New York County), 83.9% voted for Democrats and 14.9% for Republicans in 2012 Presidential Election. In San Francisco (San Francisco County), 83.5% voted for Democrats and 13.0% for Republicans.
Elections
Type
Democrats
Republicans
Other
Year
Manhattan
San Francisco
Manhattan
San Francisco
Manhattan
San Francisco
2020
86.5%
85.3%
12.2%
12.7%
1.2%
2.0%
2016
86.7%
84.6%
9.7%
9.2%
3.6%
6.2%
2012
83.9%
83.5%
14.9%
13.0%
1.2%
3.4%
2008
86.1%
84.4%
13.5%
13.7%
0.3%
2.0%
2004
82.3%
83.0%
16.8%
15.2%
0.9%
1.8%
2000
80.0%
75.7%
14.5%
16.1%
5.5%
8.1%
1996
80.0%
72.2%
13.8%
15.7%
6.3%
12.1%
Breakdown of population affiliated with a religious congregation
Type
Adherents
Congregations
Religion
Manhattan
San Francisco
Manhattan
San Francisco
CATHOLIC CHURCH
20.4%
15.0%
12.6%
9.6%
MUSLIM ESTIMATE
2.7%
0.8%
2.4%
1.2%
EPISCOPAL CHURCH
1.7%
0.8%
5.3%
3.5%
AMERICAN BAPTIST CHURCHES IN THE USA
1.6%
0.6%
4.7%
2.5%
REFORMED CHURCH IN AMERICA
0.6%
0.2%
1.2%
0.2%
PATRIAR PARISHE RUSSIAN ORTHODO CHURCH USA
0.4%
0.1%
0.2%
0.2%
SEVENTH DAY ADVENTIST CHURCH
0.3%
0.2%
2.4%
1.9%
SOUTHERN BAPTIST CONVENTION
0.2%
0.7%
2.9%
8.4%
Weather
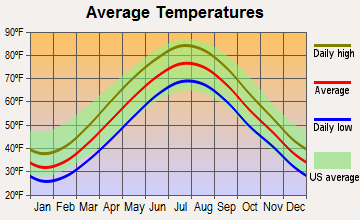
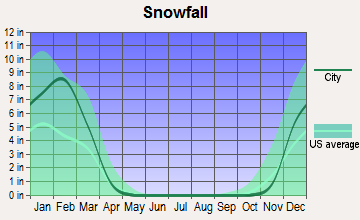
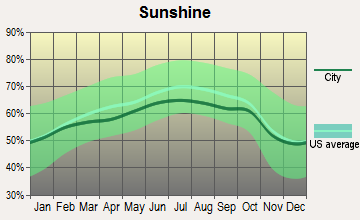
Manhattan experiences a humid subtropical climate with well-defined four seasons. Summers can be hot and humid, while winters can be cold with frequent snowfall. On the other hand, San Francisco has a Mediterranean climate, characterized by mild, wet winters and dry summers. Temperatures are relatively stable throughout the year, often cooled by the Pacific Ocean's chilly breezes.
Weather and climate
Type
Manhattan
San Francisco
Temperature - Average
54.6°F
58.3°F
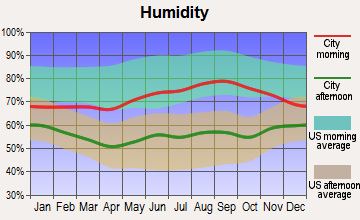
Humidity - Average morning or afternoon humidity
67.4%
84.3%
Humidity - Differences between morning and afternoon humidity
30%
29%
Humidity - Maximum monthly morning or afternoon humidity
77%
91%
Humidity - Minimum monthly morning or afternoon humidity
47%
62%
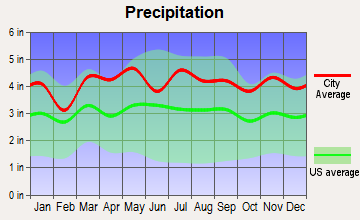
Precipitation - Yearly average
49.6 in
22.2 in
Snowfall - Yearly average
57.4 in
0 in
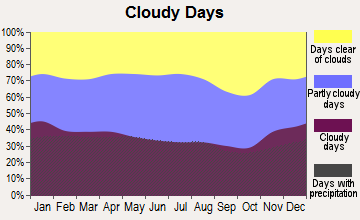
Clouds - Number of days clear of clouds
17.8%
26.8%
Sunshine amount - Average
60.2%
73%
Sunshine amount - Differences during a year
20%
22%
Sunshine amount - Maximum monthly
64%
77%
Sunshine amount - Minimum monthly
44%
55%
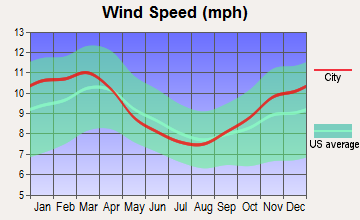
Wind speed - Average
6.7 mph
11.4 mph
Average climate in Manhattan, New York
Average climate in San Francisco, California
Air pollution
Type
AQI
CO
NO2
OZONE
PB
PM10
PM25
SO2
Year
Manhattan
San Francisco
Manhattan
San Francisco
Manhattan
San Francisco
Manhattan
San Francisco
Manhattan
San Francisco
Manhattan
Manhattan
San Francisco
Manhattan
San Francisco
2018
94
104
0.29
0.35
17.3
11.3
23.9
23.4
N/A
0.012
N/A
N/A
7.9
11.9
0.5
0.4
2017
97
96
0.16
0.40
17.4
11.4
24.0
22.5
N/A
0.008
N/A
N/A
7.7
9.9
0.4
0.6
2016
94
68
0.28
0.39
18.1
10.6
24.2
22.4
N/A
0.005
N/A
N/A
7.7
7.9
0.6
0.8
2015
100
85
0.36
0.41
18.9
12.1
23.0
22.5
N/A
0.004
N/A
N/A
8.6
7.9
1.0
0.8
2014
95
85
0.40
0.38
19.1
12.1
22.3
21.8
N/A
0.005
N/A
N/A
8.3
7.7
1.1
0.6
2013
97
88
0.43
0.40
19.5
13.9
22.6
20.4
N/A
0.004
N/A
N/A
9.0
10.2
1.1
0.5
2012
99
75
0.46
0.40
18.6
12.8
23.4
22.7
N/A
0.003
N/A
N/A
9.3
8.2
1.7
1.1
2011
108
86
0.46
0.24
20.7
14.1
22.2
21.3
N/A
0.003
N/A
N/A
10.9
9.5
2.7
1.7
2010
113
84
0.45
0.21
19.3
13.4
23.3
22.0
N/A
0.004
N/A
N/A
10.4
10.6
2.7
1.0
2009
104
95
0.51
0.30
21.9
15.1
18.8
20.4
N/A
0.005
N/A
N/A
10.7
12.8
3.8
1.1
2008
110
94
0.49
0.43
23.0
15.6
19.8
21.7
0.013
0.007
N/A
N/A
12.3
11.7
4.6
0.9
2007
121
84
0.56
0.45
24.4
15.6
19.4
20.5
0.016
0.007
N/A
N/A
13.1
8.9
5.5
1.2
2006
116
86
0.64
0.52
24.6
16.1
18.9
21.5
0.018
N/A
N/A
N/A
12.9
8.7
6.5
1.6
2005
112
89
0.77
0.39
26.7
14.8
18.4
20.5
N/A
N/A
N/A
N/A
N/A
8.8
8.2
1.3
2004
108
93
0.77
0.44
26.7
16.1
17.3
20.9
0.030
0.004
N/A
N/A
N/A
11.2
8.0
2.5
2003
107
65
0.83
0.64
27.8
18.4
17.5
19.7
0.024
N/A
26.9
N/A
N/A
N/A
8.2
1.7
2002
122
62
0.78
0.69
27.9
18.6
18.7
19.6
0.008
0.008
25.9
N/A
N/A
N/A
7.3
1.4
2001
123
64
0.79
0.72
29.4
19.2
19.4
19.0
0.020
0.008
25.0
N/A
N/A
N/A
8.7
1.4
2000
115
60
0.90
0.71
30.2
20.3
15.0
17.1
0.022
0.017
22.2
N/A
N/A
N/A
8.4
2.0
Natural disasters
Type
Manhattan
San Francisco
Tornado activity compared to U.S. average
59.1%
7.7%
Earthquake activity compared to U.S. average
31.1%
7,468.1%
Natural disasters compared to U.S. average
18%
6%
Transportation
Manhattan’s public transportation, operated by the Metropolitan Transit Authority (MTA), is extensive and reliable, with a network of subways, buses, and ferries. San Francisco’s transit system, including MUNI, BART, and ferries, also provides robust public transportation options. Both cities are bike-friendly, but San Francisco’s hills can make cycling more challenging.
Transport
Type
Manhattan
San Francisco
Amtrak stations
0
4
Amtrak stations nearby
3
3
FAA registered aircraft
2
453
FAA registered aircraft manufacturers and dealers
0
9
Means of transportation to work
Type
Manhattan
San Francisco
Bicycle
0.9%
2.7%
Bus
10.1%
11.4%
Carpooled
3.4%
9.1%
Car alone
7.6%
53.9%
Ferryboat
0.1%
0.4%
Motorcycle
0.1%
0.9%
Railroad
1.1%
0.7%
Streetcar
0.1%
7.9%
Subway
43.6%
1.6%
Taxicab
4.7%
0.4%
Walked
21.9%
8.3%
Average travel time to work
Type
Manhattan
San Francisco
Average
30.3 min
38 min
Real Estate
San Francisco ranks as one of the most expensive housing markets in the country, with Manhattan not far behind. Both have seen a boom in luxury apartments and condos, while affordable housing is scarce. Due to space shortages, high-rises and multi-unit dwellings dominate both markets.
Neighborhoods
Manhattan is divided into many vibrant neighborhoods, each having its distinct character, like Chinatown, Little Italy, or Harlem. In contrast, San Francisco features a variety of neighborhoods defined by unique multicultural influences, such as the Haight-Ashbury, the Mission District, and Chinatown.
Houses and residents
Type
Manhattan
San Francisco
Houses
798,144
412,269
Average household size (people)
2
2.3
Houses occupied
738,644 (92.5%)
350,796 (85.1%)
Houses occupied by owners
148,695 (20.1%)
140,809 (40.1%)
Houses occupied by renters
589,949 (79.9%)
209,987 (59.9%)
Median rent asked for vacant for-rent units
$1,690
$3,809
Median price asked for vacant for-sale houses and condos
$3,393,315
$1,670,841
Estimated median house or condo value
$940,900
Over $1,000,000
Median number of rooms in apartments
3.2
3.2
Median number of rooms in houses and condos
4
5.6
Renting percentage
77.2%
64.2%
Housing density (houses/condos per square mile)
34,757
8,829.1
Household income disparities
47.8%
41.7%
Housing units without a mortgage
1,104 (40.3%)
1,778 (1.9%)
Housing units with both a second mortgage and home equity loan
13 (0.5%)
7,687 (8.3%)
Housing units with a mortgage
1,636 (59.7%)
91,236 (98.1%)
Housing units with a home equity loan
140 (5.1%)
471 (0.5%)
Housing units with a second mortgage
140 (5.1%)
9,395 (10.1%)
Housing units lacking complete kitchen facilities
2%
4.7%
Housing units lacking complete plumbing facilities
Self-employed workers in own not incorporated business
69,517
30,288
State government workers
15,544
22,691
Unpaid family workers
1,861
399
Industries and Occupations
San Francisco is a major hub for the technology industry, boasting headquarters for many major tech companies. Healthcare and tourism also play significant roles in the city's economy. Manhattan, in contrast, is more diversified, with major industries including finance, healthcare, retail, and media.
San Francisco and Manhattan both offer excellent healthcare services, with world-renowned hospitals such as UCSF Medical Center and NewYork-Presbyterian Hospital. Both cities also provide extensive public health programs and resources.
Health (county statistics)
Type
Manhattan
San Francisco
General health status score of residents in this county from 1 (poor) to 5 (excellent)
Both cities have mature and extensive infrastructure. Manhattan boasts an impressive skyline filled with classic and modern architecture, featuring an extensive subway system and iconic landmarks. In contrast, San Francisco's Golden Gate Bridge and cable cars symbolize a city merging old-world charm with contemporary requirements.
Infrastructure
Type
Manhattan
San Francisco
TV stations
30
18
Culture and Food
Both cities are melting pots of diverse cultures, reflected in their food scenes. Manhattan is famous for its bagels, hot dogs, and pizza, while San Francisco is known for its sourdough bread, seafood, and cuisine influenced by Asia and Latin America.
Sports Teams
Sports enthusiasts in Manhattan can cheer for many teams, including the Yankees (MLB), Knicks (NBA), Rangers (NHL), and the Giants (NFL). In San Francisco, fans support the 49ers (NFL), the Giants (MLB), and the Golden State Warriors (NBA).
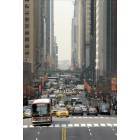


 Manhattan, NY
 San Francisco, CA