Memphis, TN vs Cincinnati, OH - Advanced U.S. city comparison tool

Memphis, TN vs Cincinnati, OH

Memphis, Tennessee and Cincinnati, Ohio are two distinct cities with a wealth of diverse experiences for both residents and tourists. Each has its own historical and cultural aspects, economic prospects, and lifestyle opportunities. Comparatively, Cincinnati provides a more balanced, family-friendly atmosphere with a strong emphasis on education, while Memphis is characterized by a culturally enriching environment with a strong connection to music history.
 
 
Distance between Memphis, TN and Cincinnati, OH : 409.5 miles

Memphis's population is larger by 103%. Its population has decreased by 21,973 people (3.4%) since 2000. The population of Cincinnati has decreased by 22,350 people (6.7%) during that time.

Population
Type Memphis Cincinnati
Population 628,127 308,935
Female / male percentage 52.8% / 47.2%
52.8%
47.2%
52.6% / 47.4%
52.6%
47.4%
Racial makeup - percentage
Ethnicity MemphisCincinnati
Black 63.4% 36.7%
White Non-Hispanic 23.5% 48.8%
Hispanic 8.5% 5.6%
Two or more 2.4% 5.8%
Asian 1.6% 2.7%
Racial makeup - absolute values
Ethnicity MemphisCincinnati
Black 398,220 113,444
White Non-Hispanic 147,318 150,647
Hispanic 53,666 17,223
Two or more 15,236 17,858
Asian 9,745 8,343
Pacific Islander 513 53
American Indian 509 19

Crime and Safety

Memphis has a higher crime rate than Cincinnati. It's important to note that Memphis does face challenges concerning crime and safety but is actively working towards improvements. On the other hand, Cincinnati also has neighborhoods where crime rates are higher, but overall, the crime rate is lower. Both cities have law enforcement initiatives in place to improve safety for their residents.

Crime by year per 100,000 residents
Type City-data.com crime indexRobberies per 100,000Murders per 100,000Rapes per 100,000Assaults per 100,000Burglaries per 100,000Theft per 100,000Auto theft per 100,000Arson per 100,000
Year MemphisCincinnatiMemphisCincinnatiMemphisCincinnatiMemphisCincinnatiMemphisCincinnatiMemphisCincinnatiMemphisCincinnatiMemphisCincinnatiMemphisCincinnati
2020 897.5 490.1 327.4 246.1 44.4 30.2 63.1 70.6 1,917.1 547.4 895.8 762.0 3,982.6 2,427.1 682.4 494.2 54.8 0.0
2019 824.5 514.4 374.2 287.5 29.8 22.1 75.6 95.9 1,427.6 447.0 1,205.2 914.2 4,308.7 2,955.1 623.0 445.7 51.7 0.0
2018 862.2 526.6 469.2 297.7 28.8 19.2 80.3 104.0 1,380.2 429.2 1,305.1 988.9 4,436.5 3,137.3 683.5 438.5 44.2 0.3
2017 884.2 593.8 529.7 400.2 28.5 23.4 94.7 105.0 1,357.8 427.9 1,464.4 1,155.4 4,235.7 3,415.4 613.7 498.1 55.9 0.3
2016 806.8 579.6 485.7 427.9 30.5 19.7 84.9 85.3 1,225.4 404.8 1,395.0 1,316.2 3,751.6 3,431.8 493.4 413.9 59.0 162.3
2015 772.5 602.5 476.5 424.2 21.0 22.4 81.9 85.4 1,164.6 402.0 1,562.8 1,482.2 3,661.8 3,667.6 416.0 389.6 45.9 147.4
2014 795.1 602.4 501.6 456.2 21.2 20.2 79.2 83.3 1,141.7 353.7 1,750.3 1,626.6 3,790.5 3,606.0 454.3 370.9 53.4 118.6
2013 767.7 639.9 476.5 543.7 19.0 23.6 69.6 73.5 1,090.6 323.1 1,800.8 1,849.6 3,852.4 3,554.9 409.8 431.0 55.6 83.0
2012 802.9 640.7 514.7 582.7 20.4 15.9 65.1 67.2 1,136.4 314.3 1,915.5 1,857.5 3,953.5 3,942.2 452.2 372.7 61.9 130.3
2011 775.5 703.5 472.3 597.3 17.9 20.5 62.2 63.9 1,031.4 353.3 2,032.4 2,251.6 3,937.2 4,232.1 526.4 431.4 48.9 110.4
2010 782.4 768.8 500.4 712.9 13.8 22.9 66.9 79.5 1,026.8 402.1 2,025.1 2,194.0 3,886.9 4,198.1 608.1 545.2 50.7 67.0
2009 865.2 700.1 620.1 681.1 19.8 16.5 58.0 72.2 1,110.8 424.2 2,090.6 1,886.0 4,361.0 3,765.3 628.8 468.6 49.9 67.2
2008 949.7 737.4 712.5 727.3 20.5 22.5 54.5 83.0 1,137.9 434.1 2,362.8 1,905.5 4,846.7 3,720.0 806.3 484.1 28.3 67.6
2007 964.2 694.4 727.8 590.3 19.6 18.7 67.2 95.7 1,137.5 377.0 2,184.5 1,868.6 4,958.6 3,723.7 927.0 604.1 22.0 69.5
2006 1,000.7 809.2 780.4 757.4 21.9 29.1 63.7 95.8 1,125.2 339.7 2,417.2 1,949.8 4,962.0 4,395.9 989.1 836.6 36.1 87.3
2005 806.4 604.8 657.7 738.2 20.3 25.1 59.1 104.7 1,124.0 321.4 2,335.7 1,730.6 4,812.6 4,484.4 1,223.3 941.5 33.1 76.4
2004 738.6 591.6 578.2 757.5 16.4 20.1 68.7 100.0 883.5 275.8 2,244.0 1,755.6 4,942.3 4,510.0 1,127.3 902.8 35.7 78.3
2003 775.2 599.3 657.5 673.5 19.3 22.2 68.7 98.4 831.7 333.3 2,585.9 1,828.9 4,603.3 4,581.0 1,305.2 1,065.4 43.9 74.9

City-data.com crime index counts serious crimes and violent crime more heavily. It adjusts for the number of visitors and daily workers commuting into cities. (higher means more crime, U.S. average = 301.1)


Crime per year
Type City-data.com crime indexRobberiesMurdersRapesAssaultsBurglariesTheftAuto theftArson
Year MemphisCincinnatiMemphisCincinnatiMemphisCincinnatiMemphisCincinnatiMemphisCincinnatiMemphisCincinnatiMemphisCincinnatiMemphisCincinnatiMemphisCincinnati
2019 824.5 514.4 2,434 872 194 67 492 291 9,285 1,356 7,839 2,773 28,024 8,964 4,052 1,352 336 0
2018 862.2 526.6 3,060 899 188 58 524 314 9,002 1,296 8,512 2,986 28,936 9,473 4,458 1,324 288 1
2017 884.2 593.8 3,458 1,197 186 70 618 314 8,863 1,280 9,559 3,456 27,649 10,216 4,006 1,490 365 1
2016 806.8 579.6 3,188 1,279 200 59 557 255 8,044 1,210 9,157 3,934 24,627 10,257 3,239 1,237 387 485
2015 772.5 602.5 3,135 1,266 138 67 539 255 7,662 1,200 10,282 4,424 24,092 10,947 2,737 1,163 302 440
2014 795.1 602.4 3,285 1,358 139 60 519 248 7,477 1,053 11,463 4,842 24,825 10,734 2,975 1,104 350 353
2013 767.7 639.9 3,134 1,612 125 70 458 218 7,173 958 11,844 5,484 25,337 10,540 2,695 1,278 366 246
2012 802.9 640.7 3,384 1,726 134 47 428 199 7,471 931 12,593 5,502 25,992 11,677 2,973 1,104 407 386
2011 775.5 703.5 3,083 1,775 117 61 406 190 6,732 1,050 13,266 6,691 25,699 12,576 3,436 1,282 319 328
2010 782.4 768.8 3,237 2,117 89 68 433 236 6,642 1,194 13,100 6,515 25,144 12,466 3,934 1,619 328 199
2009 865.2 700.1 4,139 2,272 132 55 387 241 7,414 1,415 13,953 6,291 29,106 12,560 4,197 1,563 333 224
2008 949.7 737.4 4,788 2,419 138 75 366 276 7,647 1,444 15,879 6,338 32,572 12,373 5,419 1,610 190 225
2007 964.2 694.4 4,871 1,962 131 62 450 318 7,613 1,253 14,620 6,211 33,186 12,377 6,204 2,008 147 231
2006 1,000.7 809.2 5,313 2,341 149 90 434 296 7,661 1,050 16,457 6,027 33,783 13,588 6,734 2,586 246 270
2005 806.4 604.8 4,466 2,320 138 79 401 329 7,632 1,010 15,859 5,439 32,677 14,094 8,306 2,959 225 240
2004 738.6 591.6 3,773 2,409 107 64 448 318 5,765 877 14,643 5,583 32,250 14,342 7,356 2,871 233 249
2003 775.2 599.3 4,299 2,184 126 72 449 319 5,438 1,081 16,908 5,931 30,099 14,856 8,534 3,455 287 243

City-data.com crime index counts serious crimes and violent crime more heavily. It adjusts for the number of visitors and daily workers commuting into cities. (higher means more crime, U.S. average = 301.1)

Sex Offenders

According to our data, there are 2,629 registered sex offenders living in Memphis and 1,094 registered sex offenders living in .
The ratio of residents to sex offenders in Memphis is 248 to 1; the ratio in Cincinnati is 273 to 1.
The number of registered sex offenders compared to the number of residents in Memphis is near to than in Cincinnati.

Cost of Living

The cost of living in Memphis is lower compared to Cincinnati. This includes housing costs which are significantly lower in Memphis as well as the general consumer price index. Additionally, Memphis has a lower sales tax than Cincinnati, providing a more affordable living experience overall.

Income Tax

Tennessee, including Memphis, does not impose a statewide income tax, while Cincinnati residents do have city and state income taxes, with rates depending on their income levels.

Property Tax

Property taxes differ significantly, with Memphis having a much higher rate than Cincinnati. However, lower property costs in Memphis may offset this higher rate.

Sales Tax

The sales tax in Memphis is higher than that in Cincinnati. Cincinnati residents pay a city sales tax of 7%, while Memphis residents pay a total sales tax of 9.25%.
Income
Type Memphis Cincinnati
Estimated median household income $44,317 $42,733
Estimated per capita income $28,571 $34,519
Cost of living index (U.S. average is 100) 85.5 89

If you make $50,000 in Memphis, you will have to make $52,047 in Cincinnati to maintain the same standard of living.

Geographical Conditions

Memphis is characterized by its location on the Mississippi River, flat terrain, and rich, fertile soil ideal for agriculture. Cincinnati, nestled alongside the Ohio River, is known for its seven picturesque hills offering scenic views.
Geographical information
Type Memphis Cincinnati
Land area 279.3 sq. miles 78 sq. miles
Population density 2,248.8 people per sq. mile 3,962.4 people per sq. mile
Elevation 254 feet 683 feet
Relative area comparison
Memphis, TN Cincinnati, OH
First ancestry reported - percentage
Ancestry MemphisCincinnati
English 2.4% 2.8%
Irish 1.8% 3.5%
German 1.2% 10.7%
Italian 0.7% 1.9%
Scotch-Irish 0.5% 0.4%
Scottish 0.5% 0.5%
French 0.2% 0.3%
Norwegian 0.2% 0.2%
Polish 0.2% 0.7%
Dutch 0.1% 0.2%
Greek 0.1% 0.2%
Russian 0.1% 0.3%
Population origin - absolute values
Ancestry MemphisCincinnati
English 11,171 4,792
Irish 8,107 5,912
German 5,405 18,327
Italian 3,410 3,207
Scotch-Irish 2,266 662
Scottish 2,122 881
French 993 518
Polish 981 1,216
Norwegian 818 398
Arab 691 116
Welsh 569 275
Dutch 460 394
Russian 453 496
Swedish 391 203
Greek 297 388
French Canadian 264 177
Czech 174 50
Portuguese 122 50
Lithuanian 109 185
Ukrainian 84 252
Foreign born residents - absolute values
Type Count
Region MemphisCincinnati
All 39,553 21,221
Africa 4,450 6,210
Asia 8,483 5,750
Europe 2,040 2,691
Latin America 23,361 5,150
North America 368 405
Oceania 59 79
Foreign born residents - percentage
Type Percentage
Region MemphisCincinnati
All 6.3% 6.9%
Africa 0.7% 2.0%
Asia 1.3% 1.9%
Europe 0.3% 0.9%
Latin America 3.7% 1.7%
North America 0.1% 0.1%

Education

Cincinnati offers a stronger education system; its public schools consistently outperform Memphis’s in national rankings. Moreover, Cincinnati is home to several universities, including the University of Cincinnati and Xavier University. Memphis does have its share of educational opportunities with the University of Memphis and other colleges, although it struggles with lower public school ratings.
School enrollment
Type Memphis Cincinnati
Nursery, preschool 7,762 (5.3%) 4,551 (5.5%)
Kindergarten 10,594 (7.2%) 3,674 (4.4%)
Grade 1 to 4 30,949 (21%) 13,631 (16.4%)
Grade 5 to 8 34,112 (23.1%) 15,610 (18.8%)
Grade 9 to 12 32,817 (22.2%) 14,048 (16.9%)
College undergrad 23,180 (15.7%) 24,193 (29.1%)
Graduate or professional 8,114 (5.5%) 7,310 (8.8%)
Students in private schools - absolute values
Type Count
Grade MemphisCincinnati
Grades 1 to 8 (elementary and middle school) 7,665 6,320
Grades 9 to 12 (high school) 3,744 2,331
Undergraduate colleges 6,567 3,201
Students in private schools - percentage
Type Percentage
Grade MemphisCincinnati
Grades 1 to 8 (elementary and middle school) 11.8% 21.6%
Grades 9 to 12 (high school) 11.4% 16.6%
Undergraduate colleges 28.3% 13.2%
Educational attainment
Type Memphis Cincinnati
Less than high school 12.8% 10.2%
High school or equiv. 30% 23.7%
Less than 1 year of college 5% 5.5%
1 or more years of college 17.4% 12.1%
Associate degree 6.5% 7.3%
Bachelor's degree 17.6% 23.6%
Master's degree 7.2% 12.2%
Profess. school degree 2% 2.9%
Doctorate degree 1.5% 2.4%
Education level (25-year-olds and older)
Type Memphis Cincinnati
Bachelor's degree or higher 28.3% 41.1%
Graduate or professional degree 10.7% 17.5%
High school or higher 87.2% 89.8%

Work and Economy

Both cities have diverse economies. Memphis's economy is driven largely by the transportation and shipping industry, due to its geographical location along the Mississippi River, as well as healthcare. On the other hand, Cincinnati's economy is diverse, with strengths in finance, insurance, retail trade, and manufacturing.

Biggest Employers

In Memphis, organizations such as FedEx, St. Jude Children’s Research Hospital, and Autozone are major employers. In Cincinnati, Kroger, Procter & Gamble, and the University of Cincinnati are some of the city's biggest employers.
Employment and residency - absolute values
Kind MemphisCincinnati
Work and live in this city 231,355 89,226
Work and live in this county 254,954 123,199
Workers who work outside the city they live in 418,745 242,059
Workers who work outside the county they live in 18,159 22,199
Working at home 28,812 29,782
Not working at home 244,301 115,616
Daytime population change due to commuting 102,743 102,720
Employment and residency - percentage
Kind MemphisCincinnati
Work and live in this city 84.1% 60.4%
Work and live in this county 93.4% 84.7%
Workers who work outside the city they live in 15.9% 39.6%
Workers who work outside the county they live in 6.6% 15.3%
Working at home 10.5% 20.5%
Not working at home 89.5% 79.5%
Daytime population change due to commuting 15.8% 31.0%
Geographical mobility: all
Type all
Mobility MemphisCincinnati
Same house 1 year ago 86.8% 78.4%
Moved from abroad 0.4% 0.6%
Moved within same county 9.2% 13.0%
Moved from different state 2.3% 3.7%
Moved within same state 1.4% 4.4%
Geographical mobility: Asian
Type Asian
Mobility MemphisCincinnati
Same house 1 year ago 80.3% 73.9%
Moved from abroad 3.3% 6.7%
Moved within same county 14.6% 6.5%
Moved from different state 4.4% 6.9%
Moved within same state 1.1% 6.0%
Geographical mobility: Black
Type Black
Mobility MemphisCincinnati
Same house 1 year ago 89.2% 83.2%
Moved from abroad 0.1% 0.8%
Moved within same county 8.7% 12.7%
Moved from different state 1.0% 1.3%
Moved within same state 1.1% 2.0%
Geographical mobility: White
Type White
Mobility MemphisCincinnati
Same house 1 year ago 85.6% 77.5%
Moved from abroad 0.5% 0.3%
Moved within same county 7.7% 12.4%
Moved from different state 3.8% 4.1%
Moved within same state 2.4% 5.8%

In Memphis (Shelby County), 62.9% voted for Democrats and 36.7% for Republicans in 2012 Presidential Election. In Cincinnati (Hamilton County), 52.7% voted for Democrats and 46.4% for Republicans.

Elections
Type DemocratsRepublicansOther
Year MemphisCincinnatiMemphisCincinnatiMemphisCincinnati
2020 64.8% 57.2% 34.2% 41.3% 1.1% 1.5%
2016 62.3% 52.8% 34.7% 42.5% 3.1% 4.8%
2012 62.9% 52.7% 36.7% 46.4% 0.4% 0.9%
2008 63.8% 53.1% 36.2% 46.1% 0.0% 0.7%
2004 57.7% 47.3% 42.0% 52.7% 0.3% 0.0%
2000 56.8% 42.8% 42.3% 54.1% 0.9% 3.1%
1996 78.9% 43.1% 19.6% 50.1% 1.5% 6.8%
Breakdown of population affiliated with a religious congregation
Type AdherentsCongregations
Religion MemphisCincinnatiMemphisCincinnati
SOUTHERN BAPTIST CONVENTION 14.8% 1.2% 15.1% 6.5%
CATHOLIC CHURCH 6.5% 25.6% 2.7% 12.5%
EVANGELICAL PRESBYTERIAN CHURCH 1.5% 0.0% 0.7% 0.2%
EPISCOPAL CHURCH 0.8% 1.1% 1.8% 3.0%
MUSLIM ESTIMATE 0.5% 0.2% 0.8% 0.6%
LUTHERAN CHURCH 0.4% 0.3% 1.0% 1.5%
PRESBYTERIAN CHURCH IN AMERICA 0.4% 0.0% 0.6% 0.6%
SEVENTH DAY ADVENTIST CHURCH 0.4% 0.2% 0.9% 0.9%
AMERICAN BAPTIST CHURCHES IN THE USA 0.3% 1.3% 0.6% 2.6%
EVANGELICAL LUTHERAN CHURCH IN AMERICA 0.1% 0.6% 0.4% 1.8%
VINEYARD USA 0.0% 1.8% 0.1% 1.1%

Weather

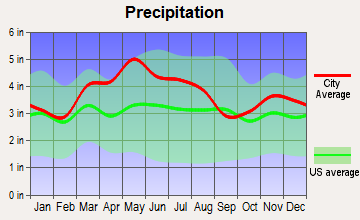
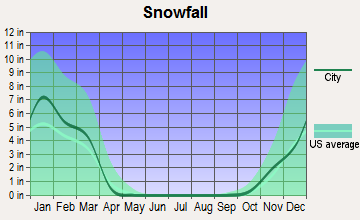
Memphis experiences a humid subtropical climate with mild winters and hot and humid summers while Cincinnati has a humid continental climate with hot, humid summers and cold winters. Memphis weather may feel hotter and muggier, while Cincinnati offers a more four-seasons climate including cold winters with snow, which can be a pro or con depending on personal preference.
Weather and climate
Type Memphis Cincinnati
Temperature - Average 61.9°F 52.9°F
Humidity - Average morning or afternoon humidity 74% 75.8%
Humidity - Differences between morning and afternoon humidity 33% 34%
Humidity - Maximum monthly morning or afternoon humidity 85% 87%
Humidity - Minimum monthly morning or afternoon humidity 52% 53%
Precipitation - Yearly average 54.3 in 45 in
Snowfall - Yearly average 8.6 in 47.6 in
Clouds - Number of days clear of clouds 19.7% 13.5%
Sunshine amount - Average 68.7% 57.8%
Sunshine amount - Differences during a year 24% 33.1%
Sunshine amount - Maximum monthly 74% 67%
Sunshine amount - Minimum monthly 50% 33.9%
Wind speed - Average 8.8 mph 9 mph

Average climate in Memphis, Tennessee

Chicago, Illinois average temperatures Chicago, Illinois average precipitation Chicago, Illinois humidity Chicago, Illinois wind speed Chicago, Illinois snowfall Chicago, Illinois sunshine Chicago, Illinois clear and cloudy days
 

Average climate in Cincinnati, Ohio

Chicago, Illinois average temperatures Chicago, Illinois average precipitation Chicago, Illinois humidity Chicago, Illinois wind speed Chicago, Illinois snowfall Chicago, Illinois sunshine Chicago, Illinois clear and cloudy days
 

Air pollution
Type AQICONO2OZONEPM10PM25SO2
Year MemphisCincinnatiMemphisCincinnatiMemphisCincinnatiMemphisCincinnatiMemphisCincinnatiMemphisCincinnatiMemphisCincinnati
2018 81 87 0.24 0.20 10.4 9.6 27.1 27.8 19.0 18.3 8.1 10.5 0.4 0.8
2017 74 81 0.24 0.23 10.2 8.5 28.1 29.2 17.5 18.8 7.9 9.2 0.3 1.1
2016 76 88 0.24 0.24 10.2 9.4 28.8 28.4 19.6 21.2 8.5 8.4 0.9 1.1
2015 77 91 0.26 0.26 11.1 11.0 26.9 26.4 N/A 21.5 9.2 9.5 1.0 1.5
2014 75 89 0.27 0.24 10.1 11.4 26.5 27.3 N/A 19.5 9.9 12.0 1.3 2.0
2013 74 92 0.31 0.24 8.3 11.5 26.6 27.0 N/A 22.9 10.2 11.9 1.0 2.6
2012 94 97 0.32 0.26 9.3 4.8 29.7 27.6 N/A 23.4 10.7 13.6 0.6 3.4
2011 93 102 0.34 0.26 10.0 12.9 29.0 28.1 N/A 22.1 11.1 13.1 0.5 4.0
2010 95 113 0.43 N/A 10.3 14.7 27.9 29.7 N/A 26.6 12.9 18.7 N/A 3.7
2009 86 77 0.35 N/A 8.7 14.4 24.9 25.6 N/A 22.6 11.8 8.2 N/A 2.2
2008 94 85 0.36 N/A 10.3 16.0 26.3 26.5 N/A N/A 13.2 9.4 N/A 3.0
2007 106 100 0.47 N/A 11.2 17.1 26.7 30.2 N/A N/A 14.8 12.7 5.6 4.0
2006 108 83 0.43 N/A 13.0 18.0 26.8 29.3 N/A 21.9 14.7 N/A 6.3 4.2
2005 110 110 0.46 0.49 10.1 20.6 26.9 30.9 N/A N/A 17.9 N/A 4.9 5.6
2004 98 91 0.51 0.36 N/A 18.7 24.9 27.7 N/A N/A 14.5 N/A 5.9 5.5
2003 110 86 0.57 0.33 20.1 21.9 25.3 27.6 N/A N/A 15.0 N/A 5.8 4.9
2002 110 98 0.58 0.32 20.4 21.4 25.1 29.4 15.6 20.0 N/A N/A 4.5 4.5
2001 111 102 0.66 0.41 24.7 21.4 26.0 29.4 22.7 22.9 N/A N/A 6.1 5.0
2000 103 104 0.63 0.40 25.2 22.1 26.2 28.0 24.9 N/A N/A N/A 6.4 6.3
Natural disasters
Type Memphis Cincinnati
Tornado activity compared to U.S. average 198.6% 166.3%
Earthquake activity compared to U.S. average 474% 148.2%
Natural disasters compared to U.S. average 18% 15%

Transportation

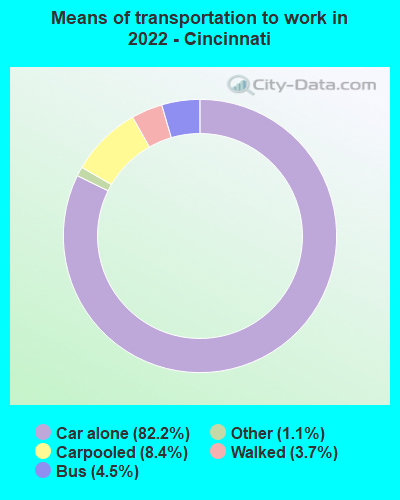
Both cities offer public transit systems and have accessible road networks for commuting. Cincinnati's Metro offers bus transit throughout the city, and it also has a bike-share program. Memphis also offers bus transit as well as trolleys. Both have accessible international airports.
Transport
Type Memphis Cincinnati
Amtrak stations 1 1
Amtrak stations nearby 1 2
FAA registered aircraft 1 454
FAA registered aircraft manufacturers and dealers 52 16
Means of transportation to work
Type Memphis Cincinnati
Bicycle 0% 0.3%
Bus 0.4% 3.2%
Carpooled 7.5% 7.2%
Car alone 88.8% 84.7%
Taxicab 0.1% 0.3%
Walked 1.2% 3.4%
Means of transportation to work
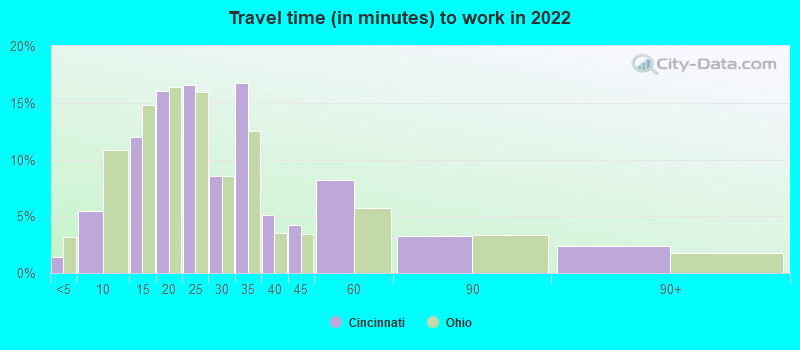
Average travel time to work
Type Memphis Cincinnati
Average 27 min 26.9 min
Other means 22.5 min 21.8 min
Public transportation 43.5 min 38 min
Travel time to work
Time leaving to work
Travel time to work
Time leaving to work
Private vehicle occupancy
Type Memphis Cincinnati
Average 1.1 1.1
Drove alone 89.9% 89.6%
In 2 person carpool 7.9% 8.6%
In 3 person carpool 1.6% 1%
In 4 person carpool 0.4% 0.6%
In 5-6 person carpool 0.2% 0.2%

How many people usually rode to work in the car, truck or van.

Real Estate

Generally, real estate prices are lower in Memphis compared to Cincinnati. Memphis provides good opportunities for investors looking for rental properties due to its lower property costs and stable rental market. On the other hand, Cincinnati’s property market is hotter with higher price points but also shows potentially good rental yields.

Neighborhoods

Both cities have a variety of neighborhoods that cater to different lifestyles. In Cincinnati, Hyde Park and Mt. Adams are popular due to their historical charm, restaurants and nightlife. On the other hand, downtown Memphis, with its musical heritage, and Collierville, a suburban favourite, offer unique living experiences.
Houses and residents
Type Memphis Cincinnati
Houses 288,491 160,420
Average household size (people) 2.5 2.1
Median year apartment built 1972 1961
Length of stay in the house since moving in 16.2 years 13.7 years
Houses occupied 256,968 (89.1%) 144,929 (90.3%)
Houses occupied by owners 119,622 (46.6%) 55,411 (38.2%)
Houses occupied by renters 137,346 (53.4%) 89,518 (61.8%)
Median rent asked for vacant for-rent units $760.83 $823.02
Median monthly housing costs $967 $918
Median price asked for vacant for-sale houses and condos $201,932 $55,446
Estimated median house or condo value $142,800 $190,300
Median numbers of rooms 5.5 4.6
Median number of rooms in apartments 4.8 3.7
Median number of rooms in houses and condos 6.6 6.5
Median house price - detached houses $205,904 $271,565
Median house price - in 2-unit structures Over $1,000,000 $236,559
Median house price - in 3-to-4-unit structures $145,165 $378,023
Median house price - in 5 or more unit structures $201,411 $288,600
Median house price - mobile homes $93,577 $76,176
Median house price - Townhouses or other attached units $170,154 $269,604
Median house price - All housing units $204,886 $273,493
Median house age 52 70
Renting percentage 48.1% 61.1%
Housing density (houses/condos per square mile) 1,032.8 2,057.5
House value disparities 44.1% 42.9%
Household income disparities 48.2% 51.8%
Median household income for houses/condes with a mortgage $72,611 $87,346
Median household income for apartments without a mortgage $53,615 $63,683
Housing units without a mortgage 1,461 (2%) 1,063 (2.8%)
Housing units with both a second mortgage and home equity loan 3,970 (5.4%) 2,466 (6.5%)
Housing units with a mortgage 71,386 (98%) 36,710 (97.2%)
Housing units with a home equity loan 322 (0.4%) 116 (0.3%)
Housing units with a second mortgage 5,907 (8.1%) 3,803 (10.1%)
House/condo owner moved in on average (years ago) 16 11
House/condo renter moved in on average (years ago) 1 1
Housing units lacking complete kitchen facilities 5.7% 2.4%
Housing units lacking complete plumbing facilities 4.6% 1.5%
Housing units in structures
Housing units in structures MemphisCincinnati
One, detached 61.0% 36.6%
One, attached 5.8% 4.9%
Two 2.1% 7.5%
3 or 4 7.4% 12.0%
5 to 9 9.1% 8.8%
10 to 19 5.6% 10.0%
20 to 49 1.8% 6.7%
50 or more 6.2% 13.2%
Mobile homes 0.8% 0.3%
Boats, RVs, vans, etc. 0.1% 0.0%
Median real estate property taxes paid for housing units
Type Memphis Cincinnati
With mortgages $1,901 (1.2%) $3,000 (1.4%)
With no mortgages $1,323 (1.3%) $2,265 (1.5%)
Marital status
Type Memphis Cincinnati
Divorced 10.4% 10.7%
Never married 46.6% 52.6%
Now married 33.6% 29.8%
Separated 3.7% 2.3%
Widowed 5.7% 4.6%
Class of workers - percentage
Class of Workers MemphisCincinnati
Employee of private company 71.6% 68.4%
Private not-for-profit wage and salary workers 7.7% 12.4%
Local government workers 6.7% 6.0%
Self-employed workers in own not incorporated business 5.8% 4.6%
Federal government workers 3.0% 2.0%
State government workers 2.7% 3.1%
Self-employed in own incorporated business 2.2% 3.6%
Unpaid family workers 0.2% 0.0%
Class of workers - absolute values
Class of Workers MemphisCincinnati
Employee of private company 199,884 101,261
Federal government workers 8,490 2,894
Local government workers 18,783 8,900
Private not-for-profit wage and salary workers 21,462 18,300
Self-employed in own incorporated business 6,255 5,354
Self-employed workers in own not incorporated business 16,111 6,809
State government workers 7,650 4,546
Unpaid family workers 668 42

Industries and Occupations

Memphis is a hub of transportation and logistics, housing FedEx’s global air hub. Medical services and music tourism also support their economy. Cincinnati is home to numerous Fortune 500 companies like Proctor & Gamble, Kroger, and Macy’s. It’s a hotspot for careers in healthcare, finance, and manufacturing.
Most common male industries
Industry MemphisCincinnati
Transportation and warehousing 17.9% 9.4%
Manufacturing 12.4% 14.3%
Construction 10.1% 6.4%
Retail trade 9.8% 9.0%
Health care and social assistance 7.9% 7.5%
Administrative and support and waste management services 7.4% 5.4%
Accommodation and food services 6.2% 7.4%
Other services, except public administration 4.7% 3.9%
Professional, scientific, and technical services 4.4% 11.7%
Educational services 4.2% 7.0%
Wholesale trade 3.6% 2.1%
Public administration 3.1% 2.8%
Finance and insurance 2.6% 6.1%
Real estate and rental and leasing 1.7% 2.6%
Arts, entertainment, and recreation 1.6% 2.5%
Information 1.0% 1.1%
Utilities 0.7% 0.7%
Agriculture, forestry, fishing and hunting 0.5% 0.1%
Management of companies and enterprises 0.2% 0.2%
Most common female industries
Industry MemphisCincinnati
Health care and social assistance 20.7% 22.7%
Retail trade 11.4% 11.0%
Transportation and warehousing 10.4% 4.5%
Educational services 9.6% 10.1%
Accommodation and food services 9.2% 9.7%
Manufacturing 6.3% 7.8%
Administrative and support and waste management services 6.0% 4.6%
Other services, except public administration 5.8% 5.3%
Public administration 5.3% 2.1%
Professional, scientific, and technical services 4.7% 9.2%
Finance and insurance 3.2% 6.1%
Real estate and rental and leasing 2.3% 2.3%
Arts, entertainment, and recreation 1.2% 1.3%
Wholesale trade 1.2% 1.4%
Information 1.1% 1.0%
Construction 0.8% 0.8%
Utilities 0.3% 0.1%
Agriculture, forestry, fishing and hunting 0.2% 0.0%
Mining, quarrying, and oil and gas extraction 0.1% 0.0%
Most common male occupations
Occupation MemphisCincinnati
Material moving occupations 14.9% 6.6%
Sales and related occupations 8.5% 9.3%
Construction and extraction occupations 8.4% 4.6%
Management occupations 8.4% 14.1%
Office and administrative support occupations 8.1% 6.3%
Production occupations 6.7% 5.3%
Transportation occupations 6.3% 4.2%
Building and grounds cleaning and maintenance occupations 5.3% 1.7%
Installation, maintenance, and repair occupations 4.3% 2.4%
Food preparation and serving related occupations 3.7% 5.7%
Business and financial operations occupations 3.3% 10.2%
Computer and mathematical occupations 3.3% 6.1%
Firefighting and prevention, and other protective service workers including supervisors 2.2% 1.3%
Health diagnosing and treating practitioners and other technical occupations 2.2% 2.8%
Personal care and service occupations 2.1% 1.3%
Educational instruction, and library occupations 1.9% 5.4%
Architecture and engineering occupations 1.4% 4.9%
Health technologists and technicians 1.4% 0.2%
Arts, design, entertainment, sports, and media occupations 1.4% 1.6%
Law enforcement workers including supervisors 1.3% 0.8%
Most common female occupations
Occupation MemphisCincinnati
Office and administrative support occupations 17.8% 15.1%
Sales and related occupations 9.8% 9.5%
Management occupations 8.4% 10.5%
Educational instruction, and library occupations 7.9% 7.4%
Material moving occupations 7.5% 4.2%
Food preparation and serving related occupations 6.2% 7.8%
Health diagnosing and treating practitioners and other technical occupations 6.1% 4.9%
Business and financial operations occupations 5.2% 5.7%
Healthcare support occupations 5.0% 6.2%
Production occupations 4.6% 3.8%
Health technologists and technicians 3.5% 3.5%
Personal care and service occupations 3.5% 3.2%
Building and grounds cleaning and maintenance occupations 3.2% 3.1%
Community and social service occupations 2.7% 2.6%
Transportation occupations 1.6% 1.4%
Firefighting and prevention, and other protective service workers including supervisors 1.2% 0.8%
Life, physical, and social science occupations 1.1% 2.3%
Legal occupations 1.0% 1.2%
Arts, design, entertainment, sports, and media occupations 0.9% 2.4%
Computer and mathematical occupations 0.7% 2.2%
Food environment data per 10,000 residents
Food environment statistics MemphisCincinnati
Number of convenience stores (no gas) 4.3 2.7
Number of convenience stores (with gas) 0.5 1.5
Number of full-service restaurants 6.1 7.5
Number of grocery stores 2.1 1.8
Number of supercenters and club stores 0.1 0.1
Food environment - absolute values
Food environment statistics MemphisCincinnati
Number of convenience stores (no gas) 386 227
Number of convenience stores (with gas) 49 127
Number of full-service restaurants 556 639
Number of grocery stores 186 155
Number of supercenters and club stores 13 10
Obesity and diabetes
Food environment statistics rate MemphisCincinnati
Adult diabetes rate 11.3% 9.8%
Adult obesity rate 32.8% 26.6%
Low-income preschool obesity rate 9.2% 11.7%

Health Care

Both cities have strong healthcare sectors. Memphis is home to St. Jude Children's Research Hospital, one of the leading pediatric treatment and research facilities in the world. Cincinnati also has strong healthcare facilities, with the Cincinnati Children’s Hospital regularly ranked among the best in the nation.
Health (county statistics)
Type Memphis Cincinnati
General health status score of residents in this county from 1 (poor) to 5 (excellent) 3.2 3.4
Average weight of females (lbs) 171 lbs 166.5 lbs
Average weight of males (lbs) 202.5 lbs 202 lbs
Residents visited a dentist within the past year 60.4% 67.6%
Residents exercised in the past month 64.6% 71.1%
Adult residents drank alcohol in the past 30 days 42.2% 51.4%
Residents smoked 100+ cigarettes in their lives 41.4% 44.4%

Fatal vehicle accidents per 100,000 residents
Type Total count per 100,000Drunk per 100,000Fatal count per 100,000Pedestrian count per 100,000Person count per 100,000Vehicle count per 100,000
Year MemphisCincinnatiMemphisCincinnatiMemphisCincinnatiMemphisCincinnatiMemphisCincinnatiMemphisCincinnati
2021 34.2 13.3 0.0 0.0 38.1 15.2 10.8 4.2 81.2 29.8 61.8 22.7
2020 32.9 11.9 6.8 5.5 35.3 11.9 11.6 3.9 75.2 32.2 54.5 23.5
2019 19.0 6.6 2.5 3.0 20.0 6.9 5.8 1.6 44.4 15.4 31.2 10.2
2018 16.9 9.9 1.1 5.0 18.0 10.6 5.7 3.3 39.6 21.5 27.2 15.5
2017 14.9 7.3 2.1 2.3 15.4 8.6 6.1 2.3 29.2 15.6 23.3 12.6
2016 17.8 10.3 3.2 3.7 18.2 10.3 4.7 2.7 42.0 18.7 30.2 16.7
2015 14.5 8.3 3.5 2.3 15.6 8.7 5.0 1.7 33.9 15.7 24.0 11.3
2014 13.1 7.7 1.1 3.0 13.5 8.4 3.7 2.7 31.4 18.1 21.6 11.7
2013 13.2 5.4 1.7 4.0 13.9 6.4 4.1 1.0 29.1 14.8 21.3 8.4
2012 10.7 8.4 2.0 3.4 11.9 8.8 2.0 2.7 27.3 18.9 17.1 12.8
2011 11.0 5.7 1.1 2.4 11.3 6.1 2.9 0.7 28.1 17.2 18.3 10.1
2010 11.0 4.4 2.6 2.0 11.4 4.4 2.2 0.7 27.1 9.4 16.4 7.1
2009 12.4 5.4 1.6 1.2 13.9 5.4 2.8 1.2 34.3 13.8 21.0 8.7
2008 13.6 7.5 2.1 3.9 14.9 8.1 2.7 2.1 33.3 18.0 22.3 11.1
2007 14.1 9.0 2.2 4.5 15.2 9.6 1.6 1.5 39.7 19.5 24.1 12.3
2006 14.4 8.7 1.6 4.2 15.8 9.3 3.2 1.5 40.6 20.8 23.0 13.5
2005 14.4 9.7 1.2 4.8 15.7 10.0 2.9 2.1 39.1 23.2 24.5 16.9
2004 11.7 9.6 1.6 3.6 13.1 11.2 3.5 2.4 34.9 23.2 20.1 14.2
2003 11.7 10.9 0.4 4.8 13.2 12.1 4.0 2.1 32.9 28.0 18.7 16.9
2002 11.8 11.5 4.7 6.0 13.7 12.1 3.1 0.9 32.0 27.2 18.3 16.0
2001 10.6 6.9 1.0 3.0 12.1 7.5 3.8 3.0 34.1 19.9 18.1 10.6
2000 12.0 7.2 4.8 3.0 13.1 7.2 3.1 2.4 33.2 17.5 19.4 10.6
1999 14.4 6.0 3.3 1.5 16.5 6.0 3.5 1.2 38.8 16.9 21.8 8.5
1998 16.9 5.7 5.9 1.8 17.9 6.0 4.1 1.8 43.6 14.0 24.3 7.4
1997 18.3 7.6 5.6 2.6 19.9 8.5 5.6 2.4 56.7 18.8 30.7 11.8
1996 18.2 5.8 4.9 1.7 20.1 5.8 3.9 1.5 54.7 11.6 31.5 7.0
1995 16.9 8.3 4.2 1.4 18.4 8.6 4.7 2.6 49.2 23.3 29.2 11.8
1994 19.7 8.0 6.0 2.3 21.9 8.8 4.8 1.7 57.7 21.3 29.5 11.6
1993 14.2 7.0 3.5 1.4 15.2 7.3 3.4 2.2 39.2 19.9 22.4 10.6
1992 15.6 8.3 6.1 0.8 17.7 8.9 3.2 3.1 43.7 20.0 25.1 11.4
1991 15.2 6.3 5.3 0.3 15.6 7.2 7.3 2.8 40.8 16.8 22.1 7.7
1990 15.7 5.5 4.7 0.8 17.0 5.8 0.0 0.0 42.8 14.5 23.7 8.5
1989 12.5 7.9 5.4 2.5 14.2 9.0 0.0 0.0 34.4 16.9 19.7 10.9
1988 14.6 9.5 3.9 2.2 16.5 9.5 0.0 0.0 42.1 22.8 23.6 13.6
1987 13.5 8.1 4.2 2.7 14.7 8.4 0.0 0.0 32.8 20.0 20.9 11.1
1986 16.0 8.6 7.5 3.5 17.0 9.4 0.0 0.0 39.1 18.3 24.8 10.2
1985 15.3 8.8 5.9 4.5 16.1 9.9 0.0 0.0 35.3 29.6 22.0 13.3
1984 12.2 7.2 6.0 2.1 12.5 7.2 0.0 0.0 30.5 17.8 18.0 11.7
1983 14.8 7.7 8.2 1.6 16.2 7.7 0.0 0.0 36.8 22.2 21.9 10.8
1982 11.9 9.7 7.7 3.9 13.1 10.2 0.0 0.0 29.3 23.4 17.8 12.9
1981 11.2 13.0 5.4 5.7 12.1 13.8 0.0 0.0 25.1 30.5 16.0 19.3
1980 16.6 14.8 9.1 5.7 18.1 15.0 0.0 0.0 41.9 29.8 25.2 18.4
1979 16.0 17.1 7.1 6.6 16.9 18.9 0.0 0.0 40.8 36.5 25.3 22.4
1978 14.5 9.0 5.6 3.5 15.7 9.5 0.0 0.0 31.5 22.3 18.4 14.8
1977 17.5 12.3 6.9 3.2 19.4 12.6 0.0 0.0 46.0 31.3 25.8 17.5
1976 13.0 13.1 4.7 1.0 15.1 13.6 0.0 0.0 32.8 34.4 18.0 19.1
1975 13.1 12.9 4.7 1.0 15.1 13.4 0.0 0.0 32.9 33.9 18.1 18.8

Fatal vehicle accidents
Type Total countDrunkFatal countPedestrian countPerson countVehicle count
Year MemphisCincinnatiMemphisCincinnatiMemphisCincinnatiMemphisCincinnatiMemphisCincinnatiMemphisCincinnati
1975 83 54 30 4 96 56 0 0 209 142 115 79
1976 83 54 30 4 96 56 0 0 209 142 115 79
1977 112 50 44 13 124 51 0 0 294 127 165 71
1978 93 36 36 14 101 38 0 0 202 89 118 59
1979 103 67 46 26 109 74 0 0 263 143 163 88
1980 107 57 59 22 117 58 0 0 271 115 163 71
1981 72 50 35 22 78 53 0 0 161 117 103 74
1982 76 37 49 15 84 39 0 0 187 89 114 49
1983 94 29 52 6 103 29 0 0 234 84 139 41
1984 77 27 38 8 79 27 0 0 193 67 114 44
1985 96 33 37 17 101 37 0 0 222 111 138 50
1986 100 32 47 13 106 35 0 0 244 68 155 38
1987 84 30 26 10 91 31 0 0 204 74 130 41
1988 90 35 24 8 102 35 0 0 260 84 146 50
1989 77 29 33 9 87 33 0 0 211 62 121 40
1990 97 20 29 3 105 21 0 0 265 53 147 31
1991 94 23 33 1 97 26 45 10 253 61 137 28
1992 97 30 38 3 110 32 20 11 271 72 156 41
1993 88 25 22 5 94 26 21 8 243 71 139 38
1994 122 28 37 8 136 31 30 6 358 75 183 41
1995 105 29 26 5 114 30 29 9 305 81 181 41
1996 112 20 30 6 124 20 24 5 337 40 194 24
1997 112 26 34 9 122 29 34 8 347 64 188 40
1998 103 19 36 6 109 20 25 6 266 47 148 25
1999 87 20 20 5 100 20 21 4 235 56 132 28
2000 78 24 31 10 85 24 20 8 216 58 126 35
2001 73 23 7 10 83 25 26 10 234 66 124 35
2002 81 38 32 20 94 40 21 3 219 90 125 53
2003 80 36 3 16 90 40 27 7 225 93 128 56
2004 80 32 11 12 89 37 24 8 238 77 137 47
2005 98 32 8 16 107 33 20 7 266 77 167 56
2006 98 29 11 14 108 31 22 5 277 69 157 45
2007 96 30 15 15 103 32 11 5 270 65 164 41
2008 92 25 14 13 101 27 18 7 225 60 151 37
2009 84 18 11 4 94 18 19 4 232 46 142 29
2010 71 13 17 6 74 13 14 2 175 28 106 21
2011 72 17 7 7 74 18 19 2 183 51 119 30
2012 70 25 13 10 78 26 13 8 179 56 112 38
2013 86 16 11 12 91 19 27 3 190 44 139 25
2014 86 23 7 9 89 25 24 8 206 54 142 35
2015 95 25 23 7 102 26 33 5 222 47 157 34
2016 116 31 21 11 119 31 31 8 274 56 197 50
2017 97 22 14 7 100 26 40 7 190 47 152 38
2018 110 30 7 15 117 32 37 10 258 65 177 47
2019 124 20 16 9 130 21 38 5 289 47 203 31
2020 208 37 43 17 223 37 73 12 475 100 344 73
2021 215 41 0 0 239 47 68 13 510 92 388 70
Police full-time law enforcement employees
Year MemphisCincinnati
2021 2,446 0
2020 2,563 1,124
2019 2,635 1,157
2018 2,605 1,167
2017 2,501 1,274
2016 2,385 1,292
2015 2,389 0
2014 2,572 0
2013 2,694 1,083
2012 2,826 1,113
2011 2,855 1,151
2010 2,775 1,214
2009 2,724 1,340
2008 2,523 1,310
2007 2,529 1,363
2006 2,440 1,335
2005 2,657 1,331
2004 2,891 0
2003 2,668 1,338
Police full-time law enforcement employees (per 1,000 residents)
Year MemphisCincinnati
2021 3.8 0.0
2020 3.9 3.7
2019 4.1 3.8
2018 4.0 3.9
2017 3.8 4.3
2016 3.6 4.3
2015 3.6 0.0
2014 3.9 0.0
2013 4.1 3.7
2012 4.3 3.8
2011 4.4 3.9
2010 4.3 4.1
2009 4.1 4.0
2008 3.8 3.9
2007 3.8 4.1
2006 3.6 4.3
2005 3.9 4.2
2004 4.4 0.0
2003 4.1 4.1
Local government: full-time employees
Job MemphisCincinnati
Financial administration 110 182
Firefighters 1,640 909
Fire - other 117 44
Gas supply 627 0
Health 51 458
Judicial and legal 110 78
Local libraries 277 0
Natural resources 14 0
Other and unallocable 310 436
Other government administration 143 80
Parks and recreation 208 287
Police - other 372 257
Police protection - officers 2,283 1,048
Sewerage 402 416
Solid waste management 478 152
Streets and highways 213 345
Totals for government 9,980 5,537
Transit 490 0
Water supply 339 779
Water transport and terminals 6 0
Local government: part-time employees
Job MemphisCincinnati
Financial administration 23 0
Firefighters 9 0
Fire - other 11 18
Gas supply 34 0
Health 24 17
Judicial and legal 39 0
Local libraries 54 0
Other and unallocable 66 13
Other government administration 129 8
Parks and recreation 851 486
Police - other 415 16
Sewerage 12 7
Solid waste management 107 13
Streets and highways 37 2
Totals for government 1,883 618
Transit 3 0
Water supply 31 37
Place of birth - Foreign born
Residents MemphisCincinnati
All residents 6.7% 6.9%
American Indian / Alaska Native residents 37.7% 57.6%
Asian residents 65.3% 68.7%
Black or African American residents 1.5% 4.1%
Native Hawaiian / Pacific Islander residents 20.4% 10.9%
Other race residents 44.5% 42.2%
Two or more races residents 21.3% 6.6%
White residents 3.4% 2.9%
White alone, not Hispanic / Latino residents 2.7% 2.7%
Place of birth - Native, outside of US
Residents MemphisCincinnati
All residents 0.6% 0.8%
Asian residents 2.5% 0.9%
Black or African American residents 0.4% 0.3%
Native Hawaiian / Pacific Islander residents 14.6% 0.0%
Other race residents 0.9% 6.3%
Two or more races residents 1.7% 6.0%
White residents 0.7% 0.5%
White alone, not Hispanic / Latino residents 0.8% 0.7%
Place of birth - Born in state of residence
Residents MemphisCincinnati
All residents 65.2% 68.1%
American Indian / Alaska Native residents 40.1% 35.6%
Asian residents 15.7% 18.3%
Black or African American residents 74.8% 76.8%
Native Hawaiian / Pacific Islander residents 24.9% 48.2%
Other race residents 43.1% 40.2%
Two or more races residents 49.0% 67.8%
White residents 52.6% 65.5%
White alone, not Hispanic / Latino residents 54.4% 67.1%
Place of birth - Born in other state
Residents MemphisCincinnati
All residents 27.6% 24.3%
American Indian / Alaska Native residents 22.2% 6.8%
Asian residents 16.5% 12.0%
Black or African American residents 23.3% 18.8%
Native Hawaiian / Pacific Islander residents 40.0% 40.9%
Other race residents 11.5% 11.2%
Two or more races residents 27.9% 19.6%
White residents 43.3% 31.1%
White alone, not Hispanic / Latino residents 42.0% 29.5%
English speakers (speaking English at home)
Type Memphis Cincinnati
Born in the United States residents 95.8% 96.2%
Foreign born residents 15.4% 20.2%
Native, born elsewhere residents 69.1% 64.6%
Total residents 90.5% 91.3%
Mechanisms of homicide
Mechanism MemphisCincinnati
Homicides from 2000 to 2006 1,090 543
Cut / Pierce 103 41
Firearm 816 395
Suffocation 26 22
Mechanisms of homicide per 1,000,000 residents
Mechanism MemphisCincinnati
Homicides from 2000 to 2006 171.8 91.5
Cut / Pierce 16.2 6.9
Firearm 128.6 66.6
Suffocation 4.1 3.7
Mechanisms of suicide per 1,000,000 residents
Mechanism MemphisCincinnati
Suicides from 2000 to 2006 99.3 104.0
Firearm 65.2 49.4
Poisoning 13.7 27.1
Suffocation 13.7 18.9

Infrastructure

Both Memphis and Cincinnati have experienced urban revitalization over the years. Cincinnati's downtown area has seen significant redevelopment, and the infrastructure includes a mixture of historical landmarks and modern buildings. Memphis also boasts historical sites with new developments being made for economic growth.
Infrastructure
Type Memphis Cincinnati
Hospitals 35 46
TV stations 14 16
Arenas or stadiums 2 6
Bank branches located here 160 289
Bank institutions located here 33 35
Main business address for public companies 17 30
Drinking water stations with no reported violations in the past 0 2
Drinking water stations with reported violations in the past 4 4

Schools

School facilities
Type Memphis Cincinnati
Private elementary/middle schools 30 65
Private high schools 24 23
Public elementary/middle schools 168 122
Public high schools 59 46
Colleges/Universities 31 33
HMDA - Conventional home purchase loans - Applications denied
Year MemphisCincinnati
1999 2,195 1,027
2000 2,406 1,294
2001 1,775 1,046
2002 1,444 978
2003 2,116 1,051
2004 3,266 1,275
2005 4,730 1,694
2006 5,833 1,584
2007 3,559 991
2008 1,174 436
2009 345 279

Culture and Food

Culturally, both cities offer rich experiences. Memphis is known for its music history, particularly blues, while Cincinnati has a strong arts scene with numerous museums and galleries. Memphis food is all about barbecue and soul food, while Cincinnati is famed for its unique chili and German-inspired cuisine.

Sports Teams

Both cities are home to professional sports teams. Memphis has the Grizzlies (NBA) and FC Memphis (USL). Cincinnati has the Bengals (NFL), Reds (MLB) and FC Cincinnati (MLS). Sports fans, locals or tourists, will find plenty to enjoy in either city.