Overall, Memphis, Tennessee and Little Rock, Arkansas have their unique charm. While Memphis is more associated with music - the birthplace of blues and the home of Elvis Presley, Little Rock is the capital city of Arkansas with rich cultural heritage and has a robust tech-focused economy. Each city offers a different living quality, social attractions, and economy, making them appealing to different groups of individuals. The following are detailed comparisons between the two cities across various dimensions.
Distance between
Memphis, TN and
Little Rock, AR : 136.3 miles
Memphis's population is larger by 211%. Its population has decreased by 21,973 people (3.4%) since 2000. The population of Little Rock has grown by 18,865 people (10.3%) during that time.
Both cities experience higher crime rates than the national average, with Memphis having a more severe situation. According to 2020 data, Memphis's crime rate is considerably higher than Little Rock's, making it a concern for both locals and tourists. Local initiatives are ongoing to improve safety in both cities. It is advisable to research neighborhoods thoroughly before choosing where to live or visit in either city.
City-data.com crime index counts serious crimes and violent crime more heavily. It adjusts for the number of visitors and daily workers commuting into cities. (higher means more crime, U.S. average = 301.1)
City-data.com crime index counts serious crimes and violent crime more heavily. It adjusts for the number of visitors and daily workers commuting into cities. (higher means more crime, U.S. average = 301.1)
Sex Offenders
According to our data, there are 2,633 registered sex offenders living in Memphis and 490 registered sex offenders living in . The ratio of residents to sex offenders in Memphis is 248 to 1; the ratio in Little Rock is 405 to 1. The number of registered sex offenders compared to the number of residents is larger in Memphis than in Little Rock.
Cost of Living
The cost of living in both cities is below the national average. However, Memphis is generally more affordable than Little Rock in terms of housing, utilities, and overall living costs. This might make Memphis more appealing to those looking to relocate or visit on a budget.
Income Tax
Tennessee does not have state income tax, which can be a significant advantage for those looking to move to Memphis. On the contrary, Arkansas has a progressive income tax system, with rates ranging from 2% to 6.6% based on income levels.
Property Tax
Tennessee's average property tax rates are lower than in Arkansas. Within the respective states, Memphis and Little Rock follow the trend, with Memphis offering a lower property tax rate than Little Rock.
Sales Tax
Regarding sales tax, Tennessee's base state sales tax rate of 7% combined with Memphis's 2.25% makes it higher than in Little Rock, where the state rate is 6.5% and the city's rate is 1.5%.
Income
Type
Memphis
Little Rock
Estimated median household income
$44,317
$53,565
Estimated per capita income
$28,571
$39,600
Cost of living index (U.S. average is 100)
85.5
85.1
If you make $50,000 in Little Rock, you will have to make $50,235 in Memphis to maintain the same standard of living.
Geographical Conditions
Memphis is in the southwestern part of Tennessee, along the Mississippi River, creating opportunities for river activities. Little Rock is situated near the geographical center of Arkansas, with the Arkansas River running through it. Both have parks and outdoor activities thanks to these features.
In terms of education, both cities have notable universities. The University of Memphis and Rhodes College in Memphis contrast with the University of Arkansas at Little Rock in Little Rock. However, overall, Little Rock ranks higher for education due to a better-funded public school system and higher graduation rates.
Both Memphis and Little Rock have diverse economies. Memphis is known for sectors such as transportation, warehousing, and healthcare. FedEx, an international courier delivery services company, is headquartered in Memphis. Little Rock's economy, being the state capital, leans more toward government, healthcare, and tech companies.
Biggest Employers
For Memphis, FedEx, International Paper, and AutoZone, oil companies are among the city's largest employers. In Little Rock, the state of Arkansas, the University of Arkansas for Medical Sciences (UAMS), and Baptist Health are among the largest employers.
In Memphis (Shelby County), 62.9% voted for Democrats and 36.7% for Republicans in 2012 Presidential Election. In Little Rock (Pulaski County), 54.7% voted for Democrats and 43.3% for Republicans.
Elections
Type
Democrats
Republicans
Other
Year
Memphis
Little Rock
Memphis
Little Rock
Memphis
Little Rock
2020
64.8%
60.5%
34.2%
37.8%
1.1%
1.7%
2016
62.3%
56.1%
34.7%
38.3%
3.1%
5.6%
2012
62.9%
54.7%
36.7%
43.3%
0.4%
2.0%
2008
63.8%
55.3%
36.2%
43.7%
0.0%
0.9%
2004
57.7%
55.2%
42.0%
44.4%
0.3%
0.4%
2000
56.8%
53.8%
42.3%
44.0%
0.9%
2.2%
1996
78.9%
58.8%
19.6%
35.1%
1.5%
6.2%
Breakdown of population affiliated with a religious congregation
Type
Adherents
Congregations
Religion
Memphis
Little Rock
Memphis
Little Rock
SOUTHERN BAPTIST CONVENTION
14.8%
17.8%
15.1%
21.0%
CATHOLIC CHURCH
6.5%
6.3%
2.7%
2.7%
EVANGELICAL PRESBYTERIAN CHURCH
1.5%
0.0%
0.7%
0.0%
EPISCOPAL CHURCH
0.8%
1.1%
1.8%
1.6%
MUSLIM ESTIMATE
0.5%
0.2%
0.8%
0.4%
LUTHERAN CHURCH
0.4%
0.5%
1.0%
1.3%
PRESBYTERIAN CHURCH IN AMERICA
0.4%
0.1%
0.6%
0.4%
SEVENTH DAY ADVENTIST CHURCH
0.4%
0.4%
0.9%
0.9%
AMERICAN BAPTIST ASSOCIATION
0.0%
1.7%
0.1%
4.0%
Weather
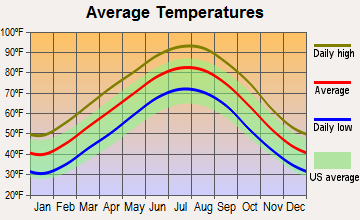
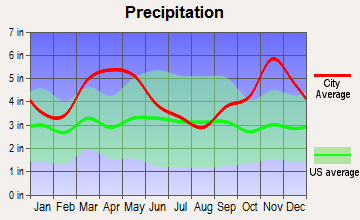
Memphis and Little Rock share a humid subtropical climate. You'll experience hot, humid summers and mild-to-cool winters in both cities. Memphis tends to be slightly warmer. Both cities get some amount of rainfall throughout the year, with spring being slightly more wet. Severe weather such as tornadoes can occur in both cities, but proper warning systems are in place.
Weather and climate
Type
Memphis
Little Rock
Temperature - Average
61.9°F
62.3°F
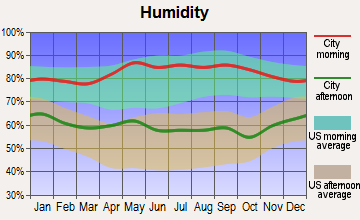
Humidity - Average morning or afternoon humidity
74%
76.2%
Humidity - Differences between morning and afternoon humidity
33%
35%
Humidity - Maximum monthly morning or afternoon humidity
85%
88%
Humidity - Minimum monthly morning or afternoon humidity
52%
53%
Precipitation - Yearly average
54.3 in
51.4 in
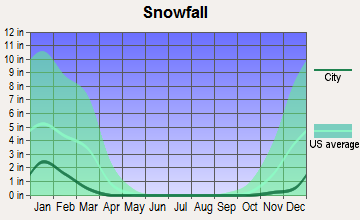
Snowfall - Yearly average
8.6 in
9.4 in
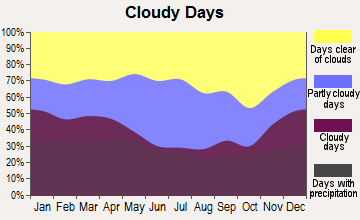
Clouds - Number of days clear of clouds
19.7%
19.8%
Sunshine amount - Average
68.7%
74%
Sunshine amount - Differences during a year
24%
30%
Sunshine amount - Maximum monthly
74%
82%
Sunshine amount - Minimum monthly
50%
52%
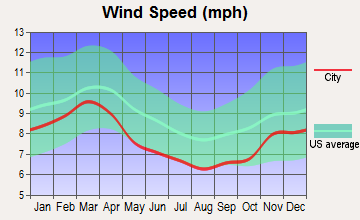
Wind speed - Average
8.8 mph
7.6 mph
Average climate in Memphis, Tennessee
Average climate in Little Rock, Arkansas
Air pollution
Type
AQI
CO
NO2
OZONE
PM10
PM25
SO2
Year
Memphis
Little Rock
Memphis
Little Rock
Memphis
Little Rock
Memphis
Little Rock
Memphis
Memphis
Little Rock
Memphis
Little Rock
2018
81
67
0.24
0.29
10.4
7.3
27.1
24.7
19.0
N/A
8.1
9.2
0.4
0.6
2017
74
70
0.24
0.41
10.2
7.6
28.1
25.5
17.5
N/A
7.9
9.5
0.3
0.6
2016
76
64
0.24
0.30
10.2
7.9
28.8
25.4
19.6
N/A
8.5
8.7
0.9
0.6
2015
77
64
0.26
0.31
11.1
8.6
26.9
22.8
N/A
N/A
9.2
9.0
1.0
1.1
2014
75
69
0.27
0.35
10.1
8.9
26.5
22.6
N/A
N/A
9.9
9.4
1.3
1.2
2013
74
70
0.31
0.39
8.3
9.8
26.6
24.7
N/A
N/A
10.2
9.5
1.0
1.3
2012
94
81
0.32
0.47
9.3
10.6
29.7
25.8
N/A
N/A
10.7
9.9
0.6
1.3
2011
93
81
0.34
0.45
10.0
10.0
29.0
25.5
N/A
N/A
11.1
11.3
0.5
1.4
2010
95
72
0.43
0.45
10.3
10.0
27.9
24.8
N/A
N/A
12.9
N/A
N/A
1.3
2009
86
62
0.35
0.42
8.7
9.1
24.9
22.0
N/A
N/A
11.8
N/A
N/A
1.7
2008
94
59
0.36
0.44
10.3
9.0
26.3
22.6
N/A
N/A
13.2
N/A
N/A
1.8
2007
106
75
0.47
0.59
11.2
10.8
26.7
22.1
N/A
N/A
14.8
N/A
5.6
3.2
2006
108
75
0.43
0.56
13.0
11.9
26.8
25.3
N/A
N/A
14.7
N/A
6.3
3.2
2005
110
87
0.46
0.39
10.1
12.1
26.9
24.1
N/A
N/A
17.9
N/A
4.9
1.5
2004
98
68
0.51
0.38
N/A
14.1
24.9
20.5
N/A
N/A
14.5
N/A
5.9
2.0
2003
110
78
0.57
0.47
20.1
14.3
25.3
22.0
N/A
N/A
15.0
N/A
5.8
2.3
2002
110
81
0.58
0.59
20.4
15.5
25.1
22.9
15.6
N/A
N/A
N/A
4.5
2.7
2001
111
82
0.66
N/A
24.7
10.4
26.0
25.9
22.7
N/A
N/A
N/A
6.1
N/A
2000
103
78
0.63
N/A
25.2
10.2
26.2
26.0
24.9
N/A
N/A
N/A
6.4
N/A
Natural disasters
Type
Memphis
Little Rock
Tornado activity compared to U.S. average
198.6%
253.3%
Earthquake activity compared to U.S. average
474%
579.4%
Natural disasters compared to U.S. average
18%
26%
Transportation
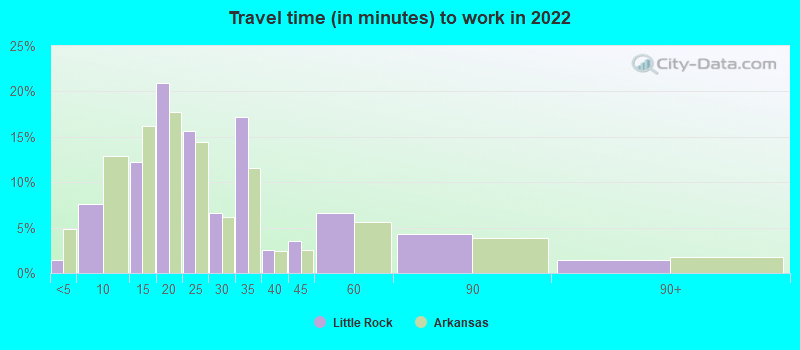
Both cities have public transportation systems, but Memphis has a more extensive network with a light rail system and bus services. Commute times in both cities are below the national average, with Little Rock having a slight edge on shorter commute times.
Transport
Type
Memphis
Little Rock
Amtrak stations
1
1
Amtrak stations nearby
1
1
FAA registered aircraft
1
259
FAA registered aircraft manufacturers and dealers
52
35
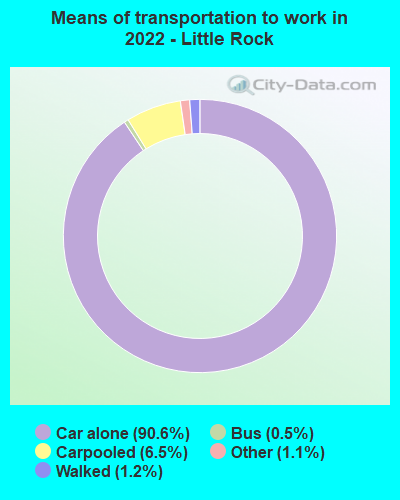
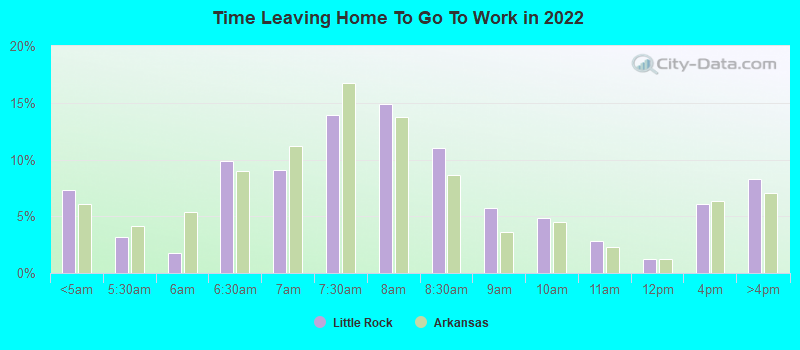
Means of transportation to work
Type
Memphis
Little Rock
Bicycle
0%
0.1%
Bus
0.4%
0.4%
Carpooled
7.5%
9.7%
Car alone
88.8%
88.1%
Motorcycle
0.1%
0.1%
Taxicab
0.1%
0.3%
Walked
1.2%
0.9%
Average travel time to work
Type
Memphis
Little Rock
Average
27 min
26 min
Other means
22.5 min
20 min
Public transportation
43.5 min
36.2 min
Private vehicle occupancy
Type
Memphis
Little Rock
Average
1.1
1.2
Drove alone
89.9%
87.6%
In 2 person carpool
7.9%
8.3%
In 3 person carpool
1.6%
1.3%
In 4 person carpool
0.4%
0.9%
In 5-6 person carpool
0.2%
1.5%
In 7+ person carpool
0.1%
0.3%
How many people usually rode to work in the car, truck or van.
Real Estate
Housing is cheaper than the national average in both cities, with Memphis having slightly less expensive prices than Little Rock. For those interested in buying property, Memphis might provide better opportunities, while Little Rock is a growing market with potential for investment.
Neighborhoods
Memphis neighborhoods like Midtown, East Memphis, and Downtown are popular for their unique charm, history, and walkability. Little Rock has districts like Hillcrest and The Heights known for their family-friendly environments, local boutiques, and restaurants.
Houses and residents
Type
Memphis
Little Rock
Houses
288,491
99,876
Average household size (people)
2.5
2.3
Median year apartment built
1972
1981
Median year house/condo built
1967
1977
Length of stay in the house since moving in
16.2 years
12.9 years
Houses occupied
256,968 (89.1%)
89,422 (89.5%)
Houses occupied by owners
119,622 (46.6%)
49,236 (55.1%)
Houses occupied by renters
137,346 (53.4%)
40,186 (44.9%)
Median rent asked for vacant for-rent units
$760.83
$706.04
Median monthly housing costs
$967
$990
Median price asked for vacant for-sale houses and condos
$201,932
$243,385
Estimated median house or condo value
$142,800
$191,700
Median numbers of rooms
5.5
5.3
Median number of rooms in apartments
4.8
3.9
Median number of rooms in houses and condos
6.6
6.3
Median house price - detached houses
$205,904
$274,395
Median house price - in 2-unit structures
Over $1,000,000
$152,806
Median house price - in 3-to-4-unit structures
$145,165
$175,185
Median house price - in 5 or more unit structures
$201,411
$451,067
Median house price - mobile homes
$93,577
$35,528
Median house price - Townhouses or other attached units
$170,154
$160,142
Median house price - All housing units
$204,886
$271,664
Median house age
52
43
Renting percentage
48.1%
43.8%
Housing density (houses/condos per square mile)
1,032.8
859.5
House value disparities
44.1%
43.1%
Household income disparities
48.2%
49.3%
Median household income for houses/condes with a mortgage
$72,611
$98,030
Median household income for apartments without a mortgage
$53,615
$64,425
Housing units without a mortgage
1,461 (2%)
623 (1.9%)
Housing units with both a second mortgage and home equity loan
3,970 (5.4%)
1,588 (4.8%)
Housing units with a mortgage
71,386 (98%)
32,138 (98.1%)
Housing units with a home equity loan
322 (0.4%)
75 (0.2%)
Housing units with a second mortgage
5,907 (8.1%)
2,366 (7.2%)
House/condo owner moved in on average (years ago)
16
11
House/condo renter moved in on average (years ago)
1
1
Housing units lacking complete kitchen facilities
5.7%
2.1%
Housing units lacking complete plumbing facilities
4.6%
0.8%
Housing units in structures
Housing units in structures
Memphis
Little Rock
One, detached
61.0%
61.4%
One, attached
5.8%
2.2%
Two
2.1%
1.9%
3 or 4
7.4%
4.1%
5 to 9
9.1%
8.6%
10 to 19
5.6%
4.9%
20 to 49
1.8%
3.8%
50 or more
6.2%
11.2%
Mobile homes
0.8%
2.0%
Boats, RVs, vans, etc.
0.1%
0.0%
Median real estate property taxes paid for housing units
Self-employed workers in own not incorporated business
16,111
4,725
State government workers
7,650
9,860
Unpaid family workers
668
160
Industries and Occupations
In Memphis, industries such as Healthcare and Social Assistance, Retail Trade, and Transportation and Warehousing dominated, while in Little Rock, industries like Healthcare, Public Administration, and Educational Services prevail. Little Rock being the state capital, there are greater opportunities in administrative jobs.
Regarding health care, Memphis is home to several well-regarded hospitals, including Baptist Memorial Hospital and Methodist Hospitals of Memphis. Little Rock boasts of the University of Arkansas for Medical Sciences (UAMS), which is a renowned medical teaching facility.
Health (county statistics)
Type
Memphis
Little Rock
General health status score of residents in this county from 1 (poor) to 5 (excellent)
Infrastructure-wise, both cities have tried to modernize their city structures. Memphis is known for its well-developed transportation facilities considering its reputation as an important logistic hub. Little Rock, too, has commendable infrastructure, with its downtown area undergoing dramatic change.
Infrastructure
Type
Memphis
Little Rock
Hospitals
35
15
TV stations
14
17
Arenas or stadiums
2
2
Bank branches located here
160
139
Bank institutions located here
33
29
Main business address for public companies
17
4
Drinking water stations with reported violations in the past
HMDA - Conventional home purchase loans - Applications denied
Year
Memphis
Little Rock
1999
2,195
842
2000
2,406
792
2001
1,775
634
2002
1,444
365
2003
2,116
510
2004
3,266
581
2005
4,730
837
2006
5,833
881
2007
3,559
503
2008
1,174
230
2009
345
114
Culture and Food
Both cities have distinct cultural scenes. Memphis is renowned for its connection to music - blues, gospel, and rock 'n' roll. It has Beale Street, Graceland, and Sun Studio. Little Rock has a rich history as the state capital and features the Clinton Presidential Center. Both boast delicious southern cuisine, with Memphis particularly known for its barbecue.
Sports Teams
Sports enthusiasts may lean towards Memphis because it's home to NBA's Memphis Grizzlies. Little Rock doesn't host any major league sports teams. Both cities have minor league and college-level sports teams that keep the local sports scene lively.


 Memphis, TN
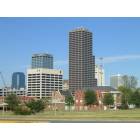
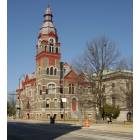
 Little Rock, AR