Both Memphis, TN, and Overland Park, KS, offer unique lifestyles with their distinctive attributes. Memphis is known for its rich cultural heritage and vibrant music scene, while Overland Park boasts a lower cost of living and safer neighborhoods. Here, we explore a comparison between the two cities across various aspects considering both those relocating and tourists visiting for a limited time.
Distance between
Memphis, TN and
Overland Park, KS : 370.3 miles
Memphis's population is larger by 219%. Its population has decreased by 21,973 people (3.4%) since 2000. The population of Overland Park has grown by 48,026 people (32.2%) during that time.
In terms of crime and safety, Overland Park is considerably safer than Memphis. Overland Park consistently ranks among the safest cities in Kansas and even in the U.S, boasting a low crime rate. Conversely, Memphis struggles with higher crime rates in comparison, particularly in certain neighborhoods. However, it's crucial to note that safety can vastly change from one neighborhood to another within the same city.
City-data.com crime index counts serious crimes and violent crime more heavily. It adjusts for the number of visitors and daily workers commuting into cities. (higher means more crime, U.S. average = 301.1)
City-data.com crime index counts serious crimes and violent crime more heavily. It adjusts for the number of visitors and daily workers commuting into cities. (higher means more crime, U.S. average = 301.1)
Sex Offenders
According to our data, there are 2,629 registered sex offenders living in Memphis and 132 registered sex offenders living in . The ratio of residents to sex offenders in Memphis is 248 to 1; the ratio in Overland Park is 1,431 to 1. The number of registered sex offenders compared to the number of residents is much larger in Memphis than that in Overland Park.
Cost of Living
Generally, the cost of living in Overland Park is lower than in Memphis. Despite this, both cities are quite affordable compared to the national average. However, factors such as housing, healthcare, and groceries are cheaper in Overland Park than Memphis, making it a more cost-effective option.
Income Tax
Kansas has a graduated income tax system, while Tennessee has no state income tax, which could be a significant factor for those considering moving to either city.
Property Tax
In terms of property tax, Overland Park has a lower rate than Memphis, which could be an incentive for prospective home buyers.
Sales Tax
The combined sales tax rate for Overland Park is 9.10%, while the rate for Memphis is 9.75%, making the sales tax marginally higher in Memphis.
Income
Type
Memphis
Overland Park
Estimated median household income
$44,317
$89,280
Estimated per capita income
$28,571
$50,828
Cost of living index (U.S. average is 100)
85.5
88.1
If you make $50,000 in Memphis, you will have to make $51,520 in Overland Park to maintain the same standard of living.
Geographical Conditions
Memphis is located along the Mississippi River and has a relatively flat topography, whereas Overland Park is characterized by its rolling hills and close proximity to the Kansas and Missouri Rivers.
Overland Park offers excellent education opportunities, with high-ranking public schools and colleges that excel in various fields. While Memphis too hosts respectable educational institutions, Overland Park's consistently high academic performance gives it an edge in education.
Memphis has a robust regional economy with sectors like transportation, warehousing, and health services playing a significant role. Overland Park, part of the Kansas City metropolitan area, has a strong economy with a focus on telecommunications, healthcare, and finance. Both cities offer ample employment opportunities, but the industries may cater to different career paths.
Biggest Employers
In Memphis, some of the largest employers include FedEx, AutoZone, and St. Jude Children's Research Hospital. Overland Park boasts major employers such as Sprint, Black & Veatch, and Shawnee Mission School District.
In Memphis (Shelby County), 62.9% voted for Democrats and 36.7% for Republicans in 2012 Presidential Election. In Overland Park (Johnson County), 40.3% voted for Democrats and 57.8% for Republicans.
Elections
Type
Democrats
Republicans
Other
Year
Memphis
Overland Park
Memphis
Overland Park
Memphis
Overland Park
2020
64.8%
53.1%
34.2%
44.8%
1.1%
2.1%
2016
62.3%
44.1%
34.7%
46.7%
3.1%
9.1%
2012
62.9%
40.3%
36.7%
57.8%
0.4%
1.9%
2008
63.8%
44.8%
36.2%
53.8%
0.0%
1.3%
2004
57.7%
37.9%
42.0%
61.2%
0.3%
0.9%
2000
56.8%
36.4%
42.3%
59.8%
0.9%
3.7%
1996
78.9%
35.7%
19.6%
57.8%
1.5%
6.5%
Breakdown of population affiliated with a religious congregation
Type
Adherents
Congregations
Religion
Memphis
Overland Park
Memphis
Overland Park
SOUTHERN BAPTIST CONVENTION
14.8%
4.5%
15.1%
7.4%
CATHOLIC CHURCH
6.5%
18.8%
2.7%
5.1%
EVANGELICAL PRESBYTERIAN CHURCH
1.5%
0.1%
0.7%
0.3%
EPISCOPAL CHURCH
0.8%
0.7%
1.8%
1.4%
MUSLIM ESTIMATE
0.5%
0.5%
0.8%
0.9%
LUTHERAN CHURCH
0.4%
1.8%
1.0%
2.6%
PRESBYTERIAN CHURCH IN AMERICA
0.4%
0.2%
0.6%
1.1%
SEVENTH DAY ADVENTIST CHURCH
0.4%
0.3%
0.9%
1.7%
AMERICAN BAPTIST CHURCHES IN THE USA
0.3%
0.9%
0.6%
3.7%
EVANGELICAL LUTHERAN CHURCH IN AMERICA
0.1%
1.4%
0.4%
3.4%
Weather
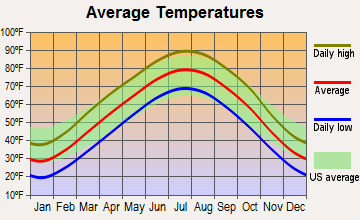
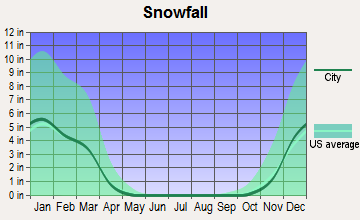
The weather in these two cities is also contrasting. Memphis, located in the Southeast, experiences a typical humid subtropical climate with hot, humid summers and mild, shorter winters. Overland Park, lying in the Midwest, has a humid continental climate that brings hot, humid summers but colder and lengthier winters, with more snowfall than Memphis.
Weather and climate
Type
Memphis
Overland Park
Temperature - Average
61.9°F
55.5°F
Humidity - Average morning or afternoon humidity
74%
76.3%
Humidity - Differences between morning and afternoon humidity
33%
30.4%
Humidity - Maximum monthly morning or afternoon humidity
85%
86.2%
Humidity - Minimum monthly morning or afternoon humidity
52%
55.7%
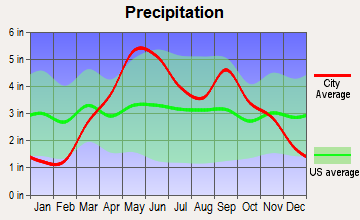
Precipitation - Yearly average
54.3 in
39.6 in
Snowfall - Yearly average
8.6 in
38.1 in
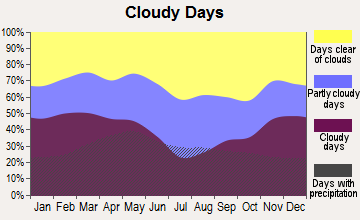
Clouds - Number of days clear of clouds
19.7%
20.1%
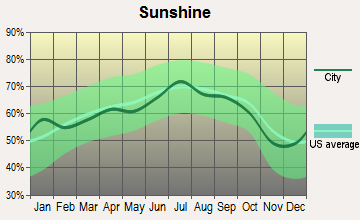
Sunshine amount - Average
68.7%
67%
Sunshine amount - Differences during a year
24%
25.7%
Sunshine amount - Maximum monthly
74%
73.8%
Sunshine amount - Minimum monthly
50%
48.2%
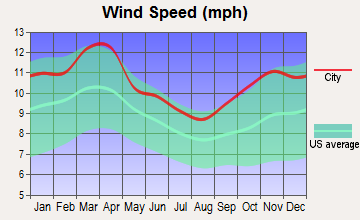
Wind speed - Average
8.8 mph
11 mph
Average climate in Memphis, Tennessee
Average climate in Overland Park, Kansas
Air pollution
Type
AQI
CO
NO2
OZONE
PM10
PM25
SO2
Year
Memphis
Overland Park
Memphis
Overland Park
Memphis
Overland Park
Memphis
Overland Park
Memphis
Overland Park
Memphis
Overland Park
Memphis
Overland Park
2018
81
85
0.24
0.24
10.4
10.6
27.1
28.5
19.0
22.0
8.1
7.6
0.4
0.7
2017
74
87
0.24
0.23
10.2
10.7
28.1
29.0
17.5
22.5
7.9
7.4
0.3
1.0
2016
76
80
0.24
0.26
10.2
11.5
28.8
27.6
19.6
22.2
8.5
7.5
0.9
1.2
2015
77
89
0.26
0.29
11.1
12.2
26.9
27.9
N/A
33.6
9.2
9.3
1.0
3.0
2014
75
88
0.27
0.27
10.1
12.3
26.5
28.4
N/A
28.5
9.9
10.4
1.3
3.3
2013
74
83
0.31
0.42
8.3
12.5
26.6
30.1
N/A
30.8
10.2
10.5
1.0
3.8
2012
94
97
0.32
0.52
9.3
13.2
29.7
32.4
N/A
N/A
10.7
10.9
0.6
4.7
2011
93
97
0.34
0.45
10.0
14.0
29.0
30.2
N/A
N/A
11.1
11.3
0.5
4.2
2010
95
89
0.43
0.40
10.3
14.1
27.9
28.9
N/A
N/A
12.9
11.3
N/A
5.3
2009
86
87
0.35
0.29
8.7
13.5
24.9
27.9
N/A
N/A
11.8
9.8
N/A
5.4
2008
94
86
0.36
0.40
10.3
17.1
26.3
26.9
N/A
N/A
13.2
11.3
N/A
4.9
2007
106
92
0.47
0.42
11.2
15.9
26.7
27.8
N/A
N/A
14.8
13.1
5.6
4.2
2006
108
93
0.43
0.38
13.0
16.7
26.8
30.0
N/A
N/A
14.7
12.4
6.3
4.8
2005
110
105
0.46
0.54
10.1
17.9
26.9
29.4
N/A
N/A
17.9
N/A
4.9
4.4
2004
98
81
0.51
0.47
N/A
16.3
24.9
27.1
N/A
N/A
14.5
N/A
5.9
4.1
2003
110
95
0.57
0.43
20.1
16.8
25.3
28.2
N/A
N/A
15.0
N/A
5.8
4.0
2002
110
91
0.58
0.52
20.4
15.7
25.1
26.7
15.6
N/A
N/A
N/A
4.5
2.7
2001
111
85
0.66
0.53
24.7
16.0
26.0
26.5
22.7
N/A
N/A
N/A
6.1
1.4
2000
103
97
0.63
0.80
25.2
14.9
26.2
27.9
24.9
N/A
N/A
N/A
6.4
2.1
Natural disasters
Type
Memphis
Overland Park
Tornado activity compared to U.S. average
198.6%
201.8%
Earthquake activity compared to U.S. average
474%
619%
Natural disasters compared to U.S. average
18%
10%
Transportation
Both cities are spread out and mostly cater to a car-centric lifestyle. However, Memphis does provide a public transit system, Memphis Area Transit Authority (MATA), that has buses and trolleys. Overland Park, though having some public transportation, is heavily reliant on cars for commuting.
Transport
Type
Memphis
Overland Park
Amtrak stations
1
0
Amtrak stations nearby
1
3
FAA registered aircraft
1
201
FAA registered aircraft manufacturers and dealers
52
9
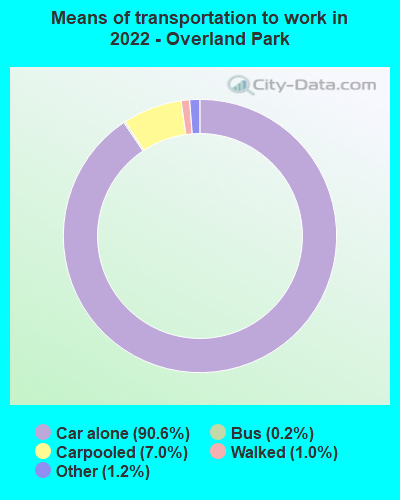
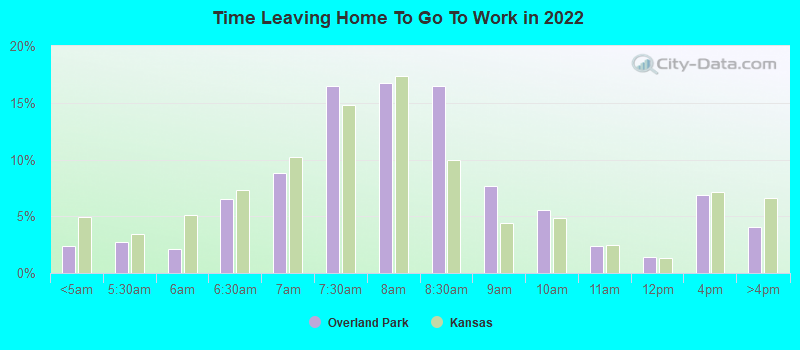
Means of transportation to work
Type
Memphis
Overland Park
Bicycle
0%
0.2%
Bus
0.4%
0.5%
Carpooled
7.5%
5.6%
Car alone
88.8%
90.5%
Walked
1.2%
1.9%
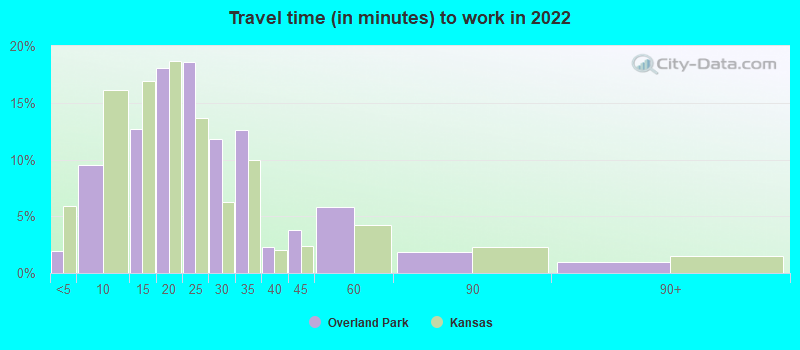
Average travel time to work
Type
Memphis
Overland Park
Average
27 min
23.5 min
Other means
22.5 min
20.4 min
Public transportation
43.5 min
33.8 min
Private vehicle occupancy
Type
Memphis
Overland Park
Average
1.1
1.1
Drove alone
89.9%
93.1%
In 2 person carpool
7.9%
5.3%
In 3 person carpool
1.6%
1%
In 4 person carpool
0.4%
0.2%
In 5-6 person carpool
0.2%
0.1%
In 7+ person carpool
0.1%
0.2%
How many people usually rode to work in the car, truck or van.
Real Estate
The real-estate market in Overland Park is slightly more expensive than Memphis. However, the suburban city offers a lower property tax rate than Memphis. Both cities offer a mix of single-family homes, condos, and apartments but Overland Park tends to have newer housing stock.
Neighborhoods
Overland Park offers many safe and family-friendly neighborhoods with a suburban feel. Memphis, while it has some safe neighborhoods, also has areas with higher crime rates. It's known for its downtown area, rich with history and a lively entertainment scene.
Houses and residents
Type
Memphis
Overland Park
Houses
288,491
85,708
Average household size (people)
2.5
2.4
Median year apartment built
1972
1994
Median year house/condo built
1967
1986
Length of stay in the house since moving in
16.2 years
11.8 years
Houses occupied
256,968 (89.1%)
82,593 (96.4%)
Houses occupied by owners
119,622 (46.6%)
50,359 (61%)
Houses occupied by renters
137,346 (53.4%)
32,234 (39%)
Median rent asked for vacant for-rent units
$760.83
$2,193
Median monthly housing costs
$967
$1,378
Median price asked for vacant for-sale houses and condos
$201,932
$298,188
Estimated median house or condo value
$142,800
$352,000
Median numbers of rooms
5.5
6.2
Median number of rooms in apartments
4.8
3.7
Median number of rooms in houses and condos
6.6
7.9
Median house price - detached houses
$205,904
$369,400
Median house price - in 2-unit structures
Over $1,000,000
$192,477
Median house price - in 3-to-4-unit structures
$145,165
$187,166
Median house price - in 5 or more unit structures
$201,411
$237,623
Median house price - mobile homes
$93,577
$162,267
Median house price - Townhouses or other attached units
$170,154
$246,600
Median house price - All housing units
$204,886
$355,351
Median house age
52
32
Renting percentage
48.1%
34.8%
Housing density (houses/condos per square mile)
1,032.8
1,510.3
House value disparities
44.1%
28.5%
Household income disparities
48.2%
40.2%
Median household income for houses/condes with a mortgage
$72,611
$137,694
Median household income for apartments without a mortgage
$53,615
$88,940
Housing units without a mortgage
1,461 (2%)
641 (1.9%)
Housing units with both a second mortgage and home equity loan
3,970 (5.4%)
3,500 (10.3%)
Housing units with a mortgage
71,386 (98%)
33,381 (98.1%)
Housing units with a home equity loan
322 (0.4%)
134 (0.4%)
Housing units with a second mortgage
5,907 (8.1%)
3,937 (11.6%)
House/condo owner moved in on average (years ago)
16
9
House/condo renter moved in on average (years ago)
1
1
Housing units lacking complete kitchen facilities
5.7%
1.1%
Housing units lacking complete plumbing facilities
4.6%
0.1%
Housing units in structures
Housing units in structures
Memphis
Overland Park
One, detached
61.0%
56.8%
One, attached
5.8%
7.6%
Two
2.1%
1.4%
3 or 4
7.4%
8.1%
5 to 9
9.1%
10.7%
10 to 19
5.6%
5.7%
20 to 49
1.8%
2.6%
50 or more
6.2%
6.5%
Mobile homes
0.8%
0.5%
Boats, RVs, vans, etc.
0.1%
0.0%
Median real estate property taxes paid for housing units
Self-employed workers in own not incorporated business
16,111
6,111
State government workers
7,650
4,203
Unpaid family workers
668
0
Industries and Occupations
Key industries in Memphis include healthcare, education, and logistics, with FedEx being one of the city's largest employers. Overland Park, on the other hand, has a strong presence of finance, insurance, and telecommunications industries, with companies like Sprint and United Healthcare contributing significantly to employment.
Both cities have access to quality healthcare. Memphis is home to St. Jude Children's Research Hospital, a world-renowned institution. Overland Park, for its part, provides excellent healthcare facilities and is known for its health sector's growth.
Health (county statistics)
Type
Memphis
Overland Park
General health status score of residents in this county from 1 (poor) to 5 (excellent)
Overland Park has newer and more updated residential and commercial infrastructure, as it is a rapidly expanding suburban city. Memphis, while older, is characterized by its historical charm. However, it's seeing ongoing urban revitalization projects that are modernizing the cityscape.
HMDA - Conventional home purchase loans - Applications denied
Year
Memphis
Overland Park
1999
2,195
257
2000
2,406
142
2001
1,775
106
2002
1,444
122
2003
2,116
292
2004
3,266
394
2005
4,730
425
2006
5,833
380
2007
3,559
265
2008
1,174
140
2009
345
78
Culture and Food
Memphis is famous for its rich cultural heritage, particularly in music and the arts. It's the birthplace of the blues and has the world-renowned Beale Street, and is famous for its barbecue cuisine. Overland Park, while having a less vibrant arts scene, is known for its quiet suburban lifestyle and diverse dining scene.
Sports Teams
Memphis is home to the Memphis Grizzlies NBA team and a passionate collegiate sports scene. Overland Park, on the other hand, does not have its own professional sports team but is in proximity to Kansas City, where teams like the Kansas City Chiefs (NFL) and Royals (MLB) are based.


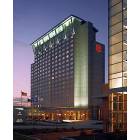


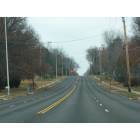
 Memphis, TN
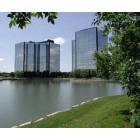
 Overland Park, KS