Mesa, AZ, and North Coast, CA, are two unique locations in the United States, offering distinct living experiences. While Mesa is known for its vibrant culture, lower cost of living, and desert climate, North Coast offers a diverse ecosystem, thriving industries, and high living standards. This comparison will examine multiple factors, including crime rates, weather conditions, cost of living, education quality, economic opportunities, infrastructure facilities, job proportions, major employers, property landscapes, neighborhoods, transportation networks, various tax rates, culinary heritage, sports options, geographical features, and healthcare infrastructure in both regions.
Mesa, AZ, stats show that crime rates are comparatively higher than the national average, although the risk varies by neighborhood. On the other hand, crime rates in North Coast, CA, are typically lower, providing a safer environment for both residents and visitors alike. Safety concerns can have a significant impact on both relocation and tourism decisions.
Cost of Living
Living in Mesa, AZ, is substantially cheaper than living in North Coast, CA. Housing, groceries, healthcare, and transportation costs are all significantly lower in Mesa, making it more affordable for both residents and tourists. However, the higher cost of living in North Coast could be attributed to its affluent lifestyle and high-quality services.
Income Tax
Arizona has lower income tax rates compared to California. Hence, a moderate-income professional might find more financial benefit in Mesa than North Coast.
Property Tax
Property tax rates in Arizona are relatively lower than most other states. On the contrary, California's rates are generally higher, which can raise the cost of property ownership in North Coast.
Sales Tax
Sales tax in Mesa, AZ, is higher than the national average, potentially increasing the cost of living. In comparison, North Coast, CA, has varying sales tax rates, but they tend to be on the higher side.
Income
Type
Mesa
North Coast
Estimated median household income
$69,266
$102,807
Estimated per capita income
$35,439
$50,809
Cost of living index (U.S. average is 100)
101
96.1
If you make $50,000 in North Coast, you will have to make $52,549 in Mesa to maintain the same standard of living.
Geographical Conditions
Mesa is notable for its desert landscape, offering unique outdoor activities. North Coast, known for its scenic coastline, hilly terrain, vineyards and redwood forests, provides abundant recreational opportunities.
Geographical information
Type
Mesa
North Coast
Land area
125 sq. miles
59.4 sq. miles
Population density
4,076.2 people per sq. mile
6,335.5 people per sq. mile
Relative area comparison
Mesa, AZ North Coast, CA
Education
Mesa offers decent education facilities, with institutions like Mesa Community College and Arizona State University Polytechnic campus located within its boundaries. Meanwhile, North Coast, CA, is home to several renowned high-ranking universities and public schools, providing high-quality education that often draws families to relocate.
While Mesa's economy is largely driven by healthcare, education, and tourism, North Coast, CA, boasts a diverse economy with significant contributions from agriculture, tourism, healthcare, and technology sectors. Job opportunities and economic stability are crucial for anyone considering relocation.
Biggest Employers
In Mesa, the Banner Health System, Mesa Public Schools, and the City of Mesa are the biggest employers. North Coast's major employers belong mainly to the healthcare, education, tourism, and technology sectors, offering varied employment opportunities.
In Mesa (Maricopa County), 43.6% voted for Democrats and 54.3% for Republicans in 2012 Presidential Election. In North Coast (Orange County), 45.8% voted for Democrats and 52.0% for Republicans.
Elections
Type
Democrats
Republicans
Other
Year
Mesa
North Coast
Mesa
North Coast
Mesa
North Coast
2020
50.2%
53.6%
48.0%
44.6%
1.8%
1.8%
2016
44.9%
50.9%
47.7%
42.4%
7.5%
6.7%
2012
43.6%
45.8%
54.3%
52.0%
2.1%
2.3%
2008
44.0%
47.8%
54.5%
50.3%
1.5%
1.9%
2004
42.4%
39.3%
57.0%
60.2%
0.6%
0.5%
2000
43.0%
40.4%
53.4%
55.9%
3.6%
3.7%
1996
44.5%
37.9%
47.2%
51.7%
8.2%
10.5%
Breakdown of population affiliated with a religious congregation
Type
Adherents
Congregations
Religion
Mesa
North Coast
Mesa
North Coast
CATHOLIC CHURCH
13.6%
26.5%
4.3%
4.4%
SOUTHERN BAPTIST CONVENTION
1.9%
2.3%
6.5%
8.8%
EVANGELICAL LUTHERAN CHURCH IN AMERICA
0.8%
0.4%
2.0%
2.3%
LUTHERAN CHURCH
0.5%
0.6%
1.5%
2.0%
SEVENTH DAY ADVENTIST CHURCH
0.4%
0.4%
2.0%
1.3%
EPISCOPAL CHURCH
0.3%
0.4%
1.3%
1.4%
VINEYARD USA
0.3%
0.2%
0.6%
0.7%
MUSLIM ESTIMATE
0.2%
0.8%
1.0%
1.3%
REFORMED CHURCH IN AMERICA
0.0%
0.3%
0.2%
0.2%
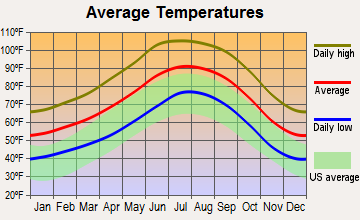
Weather
The weather is markedly different in these two regions. Mesa experiences a hot desert climate with mild winters and extremely hot summers, which can be harsh for some people. Conversely, North Coast, CA, enjoys a Mediterranean climate, featuring mild, wet winters, and warm, dry summers, which can be more pleasant.
Weather and climate
Type
Mesa
North Coast
Temperature - Average
71.7°F
64.4°F
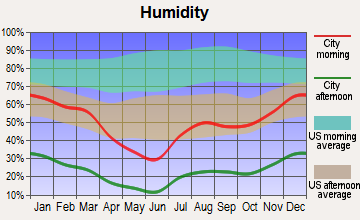
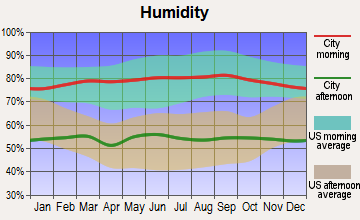
Humidity - Average morning or afternoon humidity
37.5%
70.2%
Humidity - Differences between morning and afternoon humidity
48%
26.7%
Humidity - Maximum monthly morning or afternoon humidity
60%
78.7%
Humidity - Minimum monthly morning or afternoon humidity
12%
52%
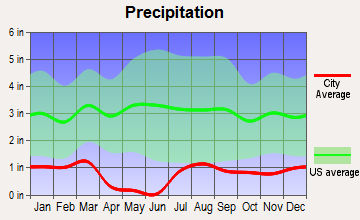
Precipitation - Yearly average
9.5 in
13 in
Snowfall - Yearly average
0 in
0 in
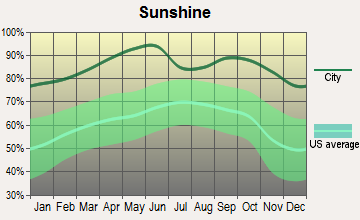
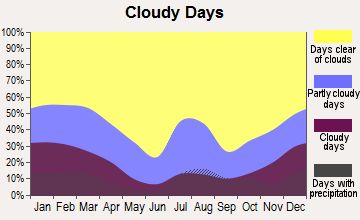
Clouds - Number of days clear of clouds
35.2%
26.5%
Sunshine amount - Average
92.8%
78.4%
Sunshine amount - Differences during a year
16%
21.9%
Sunshine amount - Maximum monthly
95%
84.9%
Sunshine amount - Minimum monthly
79%
62.9%
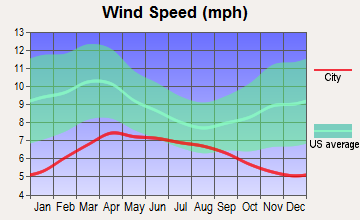
Wind speed - Average
6.6 mph
6 mph
Average climate in Mesa, Arizona
Average climate in North Coast, California
Air pollution
Type
AQI
CO
NO2
OZONE
PB
PM10
PM25
SO2
Year
Mesa
North Coast
Mesa
North Coast
Mesa
North Coast
Mesa
North Coast
North Coast
Mesa
North Coast
Mesa
North Coast
Mesa
North Coast
2018
200
119
0.28
0.35
15.1
14.4
34.8
26.1
N/A
N/A
28.1
27.5
7.5
12.6
0.6
0.7
2017
128
116
0.28
0.34
15.8
13.8
35.1
28.8
N/A
N/A
24.5
26.7
8.2
13.8
1.4
0.5
2016
121
102
0.31
0.33
15.7
12.2
34.6
29.3
N/A
N/A
21.5
24.1
6.8
12.5
0.4
0.2
2015
104
106
0.34
0.32
17.6
13.2
33.4
29.8
N/A
N/A
17.7
25.0
6.8
14.5
0.9
0.2
2014
135
110
0.33
0.29
19.6
12.9
34.0
28.6
N/A
N/A
30.8
26.7
8.4
15.5
1.1
0.4
2013
141
107
0.31
0.34
19.9
13.9
34.8
27.8
0.003
N/A
29.3
29.5
5.8
14.2
0.9
0.3
2012
159
103
0.38
0.30
21.2
12.7
33.7
26.8
0.004
N/A
37.9
28.2
8.1
14.3
1.3
0.1
2011
205
109
0.31
0.31
18.5
14.7
34.1
27.0
0.006
N/A
40.4
27.7
9.5
15.9
0.9
0.7
2010
100
102
0.31
0.33
16.4
14.3
32.9
26.2
0.011
N/A
29.5
23.6
8.3
14.0
1.2
0.6
2009
109
118
0.33
0.35
16.6
15.5
32.3
27.6
0.009
N/A
37.8
24.3
N/A
14.5
1.0
1.1
2008
106
124
0.29
0.39
17.5
16.5
34.2
28.2
0.010
N/A
39.9
29.5
N/A
21.6
1.1
1.1
2007
134
100
0.43
0.36
19.3
16.3
31.0
27.0
0.012
N/A
50.6
N/A
N/A
N/A
1.9
0.8
2006
138
114
0.44
0.40
22.1
17.2
30.9
26.4
0.007
N/A
57.5
N/A
N/A
N/A
1.8
1.3
2005
109
95
0.49
0.39
22.6
17.7
30.0
27.9
0.012
N/A
49.1
N/A
N/A
N/A
1.7
1.3
2004
97
119
0.51
0.50
22.4
19.2
30.4
30.5
0.014
N/A
33.4
N/A
N/A
N/A
1.4
1.6
2003
99
122
0.56
0.64
24.0
21.9
31.7
28.9
0.030
N/A
42.6
N/A
N/A
N/A
1.4
1.1
2002
110
106
0.69
0.65
24.9
22.0
28.0
25.5
0.018
N/A
41.8
N/A
N/A
N/A
1.6
1.8
2001
105
116
0.65
0.73
23.8
22.0
27.2
25.4
0.033
N/A
37.8
N/A
N/A
N/A
1.5
1.5
2000
117
125
0.76
0.80
29.8
24.4
27.1
24.0
0.027
N/A
45.6
N/A
N/A
N/A
1.7
1.9
Natural disasters
Type
Mesa
North Coast
Tornado activity compared to U.S. average
18.1%
18.6%
Earthquake activity compared to U.S. average
2,348.6%
6,843.6%
Natural disasters compared to U.S. average
16%
32%
Transportation
Mesa has a robust roadway and light rail system, but public transit is not its strongest aspect. North Coast features well-laid roadways, public buses, and ferries offering more commuting options.
Transport
Type
Mesa
North Coast
Amtrak stations nearby
2
3
FAA registered aircraft
828
0
FAA registered aircraft manufacturers and dealers
20
0
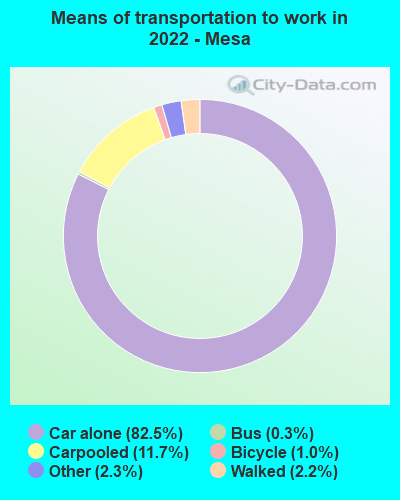
Means of transportation to work
Type
Mesa
North Coast
Bicycle
0.6%
0.7%
Bus
0.3%
1.2%
Carpooled
14.4%
10.7%
Car alone
79.9%
81.4%
Motorcycle
0.5%
0.2%
Walked
2.5%
1.4%
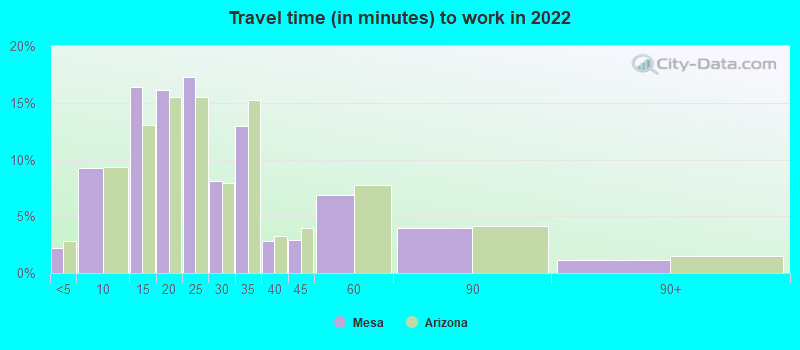
Average travel time to work
Type
Mesa
North Coast
Average
25 min
28.8 min
Real Estate
Real estate in Mesa is significantly less expensive than in North Coast, making home ownership more accessible for many. North Coast, despite its higher real estate prices, offers a range of luxury accommodations that attract affluent buyers and investors.
Neighborhoods
Mesa offers a mix of urban and suburban neighborhoods catering to diverse lifestyles. North Coast, on the other hand, boasts serene coastal neighborhoods, wine country settlements, and upscale living areas attracting both professionals and retirees.
Houses and residents
Type
Mesa
North Coast
Houses
221,995
137,450
Average household size (people)
2.6
2.7
Houses occupied
199,112 (89.7%)
133,254 (96.9%)
Houses occupied by owners
126,146 (63.4%)
84,546 (63.4%)
Houses occupied by renters
72,966 (36.6%)
48,708 (36.6%)
Median rent asked for vacant for-rent units
$1,890
$2,340
Median price asked for vacant for-sale houses and condos
$262,297
$1,099,558
Estimated median house or condo value
$350,100
$883,291
Median number of rooms in apartments
4
3.9
Median number of rooms in houses and condos
5.9
6.1
Renting percentage
36.8%
37.7%
Housing density (houses/condos per square mile)
1,776.1
2,312.7
Household income disparities
42.1%
41.2%
Housing units without a mortgage
1,338 (1.6%)
13,396 (19.5%)
Housing units with both a second mortgage and home equity loan
5,628 (6.9%)
282 (0.4%)
Housing units with a mortgage
80,572 (98.4%)
55,188 (80.5%)
Housing units with a home equity loan
48 (0.1%)
6,297 (9.2%)
Housing units with a second mortgage
7,236 (8.8%)
7,643 (11.1%)
Housing units lacking complete kitchen facilities
0.9%
1%
Housing units lacking complete plumbing facilities
Self-employed workers in own not incorporated business
10,562
15,532
State government workers
6,039
5,751
Unpaid family workers
830
744
Industries and Occupations
The largest industries in Mesa are healthcare, education, and retail, providing vast employment opportunities. Conversely, the largest industries in North Coast encompass agriculture, specifically wine production, healthcare, tourism, and technology. The varied occupational options in these regions can appeal to a broad spectrum of professionals.
Mesa has several healthcare centers and hospitals, with Banner Health System being a notable provider. North Coast, CA, boasts an extensive array of medical facilities offering high-quality healthcare services.
Health (county statistics)
Type
Mesa
North Coast
General health status score of residents in this county from 1 (poor) to 5 (excellent)
Mesa boasts developed infrastructure with many new buildings and commercial hubs. North Coast, meanwhile, is well-known for its excellent wine industry-related infrastructure and thriving arts and cultural scene. Tourist-friendly facilities including airport connectivity, hotels, and resorts are prominent in both regions.
Infrastructure
Type
Mesa
North Coast
TV stations
18
2
Culture and Food
Mesa reflects a rich cultural heritage including Native American and Spanish influences, highlighted in its food scene. North Coast, CA, is renowned for its farm-to-table culinary culture, along with its world-class wine industry.
Sports Teams
Mesa hosts spring training for MLB teams, attracts golf enthusiasts, and is near cities with professional sports teams. North Coast isn’t home to major professional teams, but the region's proximity to cities like San Francisco broadens sports options.
 Mesa, AZ
 North Coast, CA