Metropolitan Government, TN vs Augusta-Richmond County, GA
Both Metropolitan Government, TN and Augusta-Richmond County, GA provide unique combinations of cultural, economic, and lifestyle opportunities. Your preference between the two dynamics will depend on your taste in climate, occupational opportunities, schooling, taxation, and preferred lifestyle. Let's delve into each area for both cities and compare them side by side.
In the area of crime and safety, both Metropolitan Government, TN, known for most as Nashville, and Augusta-Richmond, GA have varying levels of crime. According to FBI records, Nashville's crime rates are somewhat higher than the national average. Efforts are continuously underway to improve safety however, including increased neighborhood watch programs and police presence. Augusta-Richmond also has crime rates higher than the national average, but the majority of crimes are property-related with efforts in place to minimize these issues.
Cost of Living
The cost of living varies notably between the two cities. Nashville's cost of living is higher due to increasing housing costs primarily, while Augusta-Richmond offers a lower cost of living making it an appealing place for those on a tight budget or looking for economical options.
Income Tax
Tennessee does not impose a state income tax, making Nashville attractive for high-income earners. Georgia, however, does levy a state income tax with rates ranging from 1% to 5.75%.
Property Tax
Property taxes also vary, with Nashville typically having higher rates than Augusta-Richmond, largely due to the higher cost of real estate in Nashville.
Sales Tax
Sales tax is higher in Nashville with a combined state and local tax of 9.25%, compared to Augusta-Richmond's combined rate of 8%.
Income
Type
Metropolitan Government
Augusta-Richmond County
Estimated median household income
$65,348
$47,921
Estimated per capita income
$43,994
$27,864
Cost of living index (U.S. average is 100)
97.9
89.2
If you make $50,000 in Augusta-Richmond County, you will have to make $54,877 in Metropolitan Government to maintain the same standard of living.
Geographical Conditions
Geographically, Nashville is situated in the Upper South region of the U.S., known for its rolling hills and rivers, whereas Augusta-Richmond sits on the Savannah River, with access to numerous outdoor recreational activities.
Geographical information
Type
Metropolitan Government
Augusta-Richmond County
Land area
502.3 sq. miles
302.1 sq. miles
Population density
1,236.2 people per sq. mile
665.9 people per sq. mile
Education
Both cities have a wide selection of educational opportunities ranging from public schools to esteemed private institutions. Nashville is recognized for its numerous top-rated universities like Vanderbilt University while Augusta-Richmond is renowned for the Medical College of Georgia.
Nashville's economy thrives on industries like health care, music production, and education, offering many job opportunities. Augusta-Richmond, on the other hand, has a diverse economy with health care, military, and manufacturing forming a significant portion of employment.
Biggest Employers
In Nashville, some of the biggest employers include Vanderbilt University & Medical Center, Nissan North America, and HCA Healthcare. Augusta-Richmond, likewise, has Augusta University and its associated health system, the Savannah River Site, and Fort Gordon among its largest employers.
In Metropolitan Government (Davidson County), 58.5% voted for Democrats and 39.9% for Republicans in 2012 Presidential Election. In Augusta-Richmond County (Richmond County), 66.5% voted for Democrats and 32.7% for Republicans.
Elections
Type
Democrats
Republicans
Other
Year
Metropolitan Government
Augusta-Richmond County
Metropolitan Government
Augusta-Richmond County
Metropolitan Government
Augusta-Richmond County
2020
65.0%
67.9%
32.6%
30.8%
2.3%
1.3%
2016
60.1%
64.4%
34.1%
32.3%
5.7%
3.4%
2012
58.5%
66.5%
39.9%
32.7%
1.6%
0.7%
2008
60.0%
65.7%
39.0%
33.9%
1.0%
0.4%
2004
54.9%
56.7%
44.6%
43.0%
0.4%
0.4%
2000
57.9%
54.6%
40.4%
44.3%
1.7%
1.1%
1996
79.3%
54.1%
18.1%
41.6%
2.6%
4.3%
Breakdown of population affiliated with a religious congregation
Type
Adherents
Congregations
Religion
Metropolitan Government
Augusta-Richmond County
Metropolitan Government
Augusta-Richmond County
SOUTHERN BAPTIST CONVENTION
14.1%
15.8%
19.6%
16.9%
CATHOLIC CHURCH
4.9%
7.9%
2.3%
1.6%
EPISCOPAL CHURCH
1.5%
1.6%
1.8%
2.8%
SEVENTH DAY ADVENTIST CHURCH
1.1%
0.2%
1.7%
0.4%
COPTIC ORTHODOX CHURCH
1.0%
0.0%
0.5%
0.0%
MUSLIM ESTIMATE
0.8%
1.0%
1.4%
1.2%
PRESBYTERIAN CHURCH IN AMERICA
0.8%
1.2%
0.9%
1.2%
CUMBERLAND PRESBYTERIAN CHURCH
0.4%
0.0%
1.3%
0.0%
EVANGELICAL LUTHERAN CHURCH IN AMERICA
0.2%
0.9%
0.8%
0.8%
AMERICAN BAPTIST CHURCHES IN THE USA
0.1%
0.6%
0.3%
1.2%
Weather
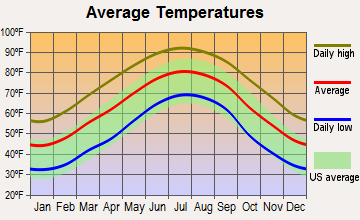
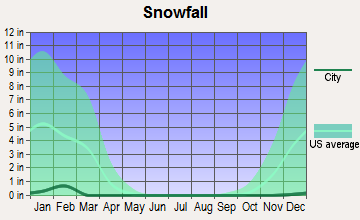
For weather, Nashville experiences a mix of fours seasons with hot summers, mild winters, and moderate rain throughout the year. In contrast, Augusta-Richmond experiences warmer temperatures overall with hot, humid summers and short, mild winters. Both cities can be prone to severe weather such as tornadoes, but it is less common in Augusta-Richmond.
Weather and climate
Type
Metropolitan Government
Augusta-Richmond County
Temperature - Average
58.4°F
63°F
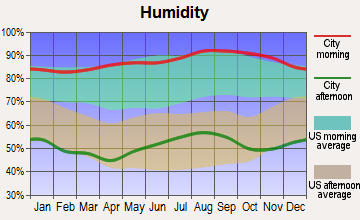
Humidity - Average morning or afternoon humidity
75.9%
74.3%
Humidity - Differences between morning and afternoon humidity
38%
44%
Humidity - Maximum monthly morning or afternoon humidity
89%
90%
Humidity - Minimum monthly morning or afternoon humidity
51%
46%
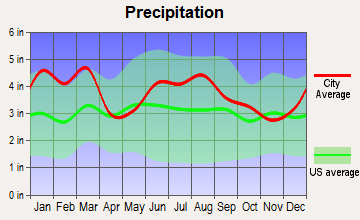
Precipitation - Yearly average
49 in
45 in
Snowfall - Yearly average
17.8 in
2 in
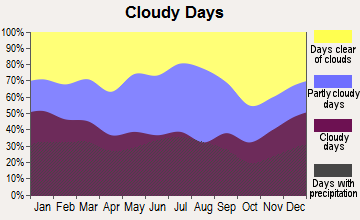
Clouds - Number of days clear of clouds
17.1%
18.7%
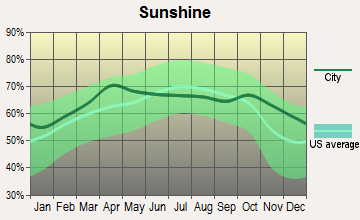
Sunshine amount - Average
59.7%
69%
Sunshine amount - Differences during a year
23%
14.6%
Sunshine amount - Maximum monthly
65%
69.3%
Sunshine amount - Minimum monthly
42%
54.7%
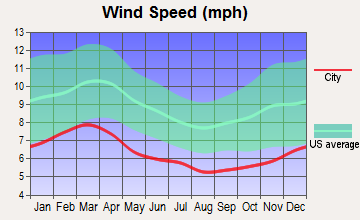
Wind speed - Average
7.7 mph
6 mph
Average climate in Metropolitan Government, Tennessee
Average climate in Augusta-Richmond County, Georgia
Air pollution
Type
AQI
CO
NO2
OZONE
PB
PM10
PM25
SO2
Year
Metropolitan Government
Augusta-Richmond County
Metropolitan Government
Metropolitan Government
Metropolitan Government
Augusta-Richmond County
Metropolitan Government
Augusta-Richmond County
Metropolitan Government
Augusta-Richmond County
Metropolitan Government
Augusta-Richmond County
Metropolitan Government
Augusta-Richmond County
2018
71
77
0.40
N/A
13.8
N/A
24.1
25.4
N/A
N/A
15.2
13.1
9.2
9.9
0.2
0.9
2017
70
76
0.38
N/A
14.4
N/A
26.8
25.9
N/A
N/A
15.3
N/A
8.7
8.7
0.1
1.0
2016
90
81
0.42
N/A
16.1
N/A
26.4
26.5
N/A
N/A
N/A
N/A
10.1
8.9
0.0
1.8
2015
68
70
0.43
N/A
15.5
N/A
23.6
25.0
N/A
N/A
N/A
N/A
10.8
8.4
0.1
1.6
2014
66
76
N/A
N/A
N/A
N/A
26.3
26.2
N/A
N/A
N/A
N/A
9.8
10.0
1.4
1.8
2013
62
76
N/A
N/A
N/A
N/A
N/A
25.7
N/A
N/A
N/A
N/A
9.7
8.8
N/A
1.7
2012
81
89
N/A
N/A
N/A
N/A
28.3
27.4
N/A
N/A
N/A
N/A
11.0
10.4
2.3
N/A
2011
81
93
N/A
N/A
N/A
N/A
25.9
30.2
N/A
N/A
N/A
N/A
11.0
11.8
1.7
N/A
2010
80
85
N/A
N/A
N/A
N/A
24.3
27.8
N/A
N/A
N/A
N/A
12.2
10.9
2.2
N/A
2009
72
79
N/A
N/A
N/A
N/A
22.5
26.2
N/A
N/A
N/A
N/A
11.5
10.3
2.4
N/A
2008
81
97
N/A
N/A
N/A
N/A
25.7
27.7
N/A
0.004
N/A
N/A
13.4
12.4
2.5
N/A
2007
99
102
N/A
N/A
N/A
N/A
27.4
28.3
N/A
0.005
N/A
N/A
15.5
14.8
2.7
N/A
2006
93
106
0.69
N/A
N/A
N/A
24.9
27.9
N/A
0.004
N/A
N/A
14.9
14.6
2.9
N/A
2005
104
110
0.56
N/A
N/A
N/A
23.5
26.4
N/A
0.006
N/A
N/A
16.9
14.6
3.1
N/A
2004
83
109
0.61
N/A
N/A
N/A
22.0
25.4
0.006
0.006
N/A
N/A
N/A
14.7
2.6
N/A
2003
93
84
0.67
N/A
N/A
N/A
18.5
23.6
0.005
0.003
N/A
N/A
15.8
N/A
3.8
N/A
2002
92
90
0.68
N/A
N/A
N/A
20.2
26.2
N/A
0.000
N/A
N/A
15.3
N/A
4.3
N/A
2001
95
98
0.90
N/A
N/A
N/A
19.5
27.1
N/A
0.002
N/A
N/A
15.6
N/A
4.5
2.4
2000
97
109
0.75
N/A
N/A
N/A
19.8
29.0
N/A
0.002
N/A
N/A
N/A
N/A
4.1
N/A
Natural disasters
Type
Metropolitan Government
Augusta-Richmond County
Tornado activity compared to U.S. average
169%
101.7%
Earthquake activity compared to U.S. average
296.3%
85.8%
Natural disasters compared to U.S. average
17%
7%
Transportation
Nashville offers multiple modes of public transit including buses and trains, whereas Augusta-Richmond's public transit is primarily bus-based with growing efforts to expand biking infrastructure.
Transport
Type
Metropolitan Government
Augusta-Richmond County
Amtrak stations nearby
1
0
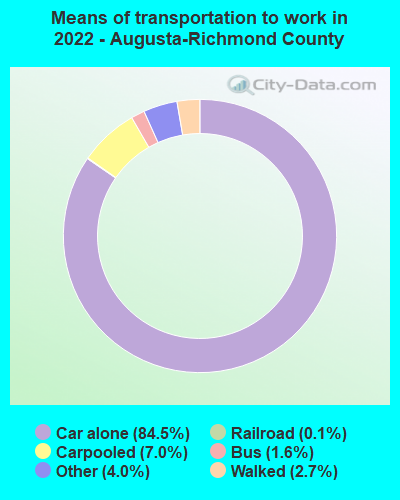
Means of transportation to work
Type
Metropolitan Government
Augusta-Richmond County
Bicycle
0.1%
0.1%
Bus
1.6%
0.9%
Carpooled
13.3%
8.2%
Car alone
78.6%
86.6%
Taxicab
0.1%
0.3%
Walked
2.3%
1.8%
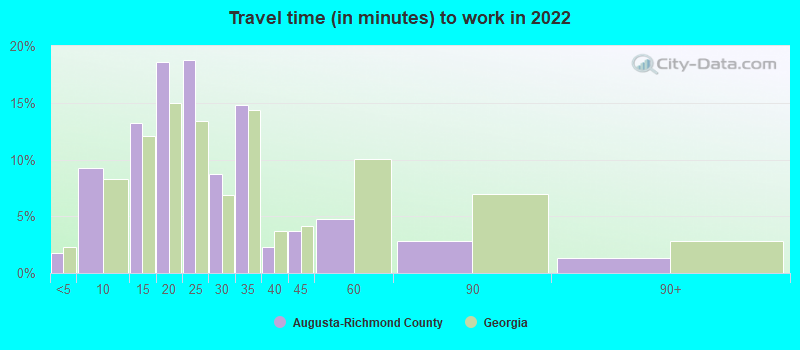
Average travel time to work
Type
Metropolitan Government
Augusta-Richmond County
Average
23.7 min
24.8 min
Real Estate
The real estate market in both cities is healthy but in different ways. Nashville has seen a boom in real estate over the recent years driving up prices while Augusta-Richmond maintains a more stable, affordable housing market, offering options for various budget ranges.
Neighborhoods
Both cities offer a range of neighborhoods from suburban to urban. Nashville is known for neighborhoods like East Nashville with its vibrant music scene, while Augusta-Richmond neighborhoods like Summerville are appreciated for their historic charm.
Houses and residents
Type
Metropolitan Government
Augusta-Richmond County
Houses
252,977
90,645
Average household size (people)
2.3
2.5
Houses occupied
237,405 (93.8%)
72,760 (80.3%)
Houses occupied by owners
131,384 (55.3%)
37,458 (51.5%)
Houses occupied by renters
106,021 (44.7%)
35,302 (48.5%)
Median rent asked for vacant for-rent units
$1,207
$1,033
Median price asked for vacant for-sale houses and condos
$226,967
$171,838
Estimated median house or condo value
$350,700
$131,900
Median number of rooms in apartments
4.2
4.5
Median number of rooms in houses and condos
6.4
6.5
Housing density (houses/condos per square mile)
503.7
300
Household income disparities
45.5%
47.5%
Housing units without a mortgage
32,597 (28.1%)
576 (2.5%)
Housing units with both a second mortgage and home equity loan
342 (0.3%)
824 (3.5%)
Housing units with a mortgage
83,416 (71.9%)
22,818 (97.5%)
Housing units with a home equity loan
8,009 (6.9%)
127 (0.5%)
Housing units with a second mortgage
9,691 (8.4%)
1,097 (4.7%)
Housing units lacking complete kitchen facilities
0.7%
4.7%
Housing units lacking complete plumbing facilities
Self-employed workers in own not incorporated business
20,090
2,768
State government workers
13,081
7,865
Unpaid family workers
668
96
Industries and Occupations
Nashville is globally known for its music industry, but health care, tourism, and education are also essential sectors. Augusta-Richmond is known for its healthcare sector, but the military (Fort Gordon) and the annual Masters Golf Tournament also play leading roles in local employment.
Nashville hosts globally renowned healthcare facilities, including the Vanderbilt University Medical Center. Augusta-Richmond is also notable in the healthcare field with the Augusta University Health system and the state's only public medical school.
Health (county statistics)
Type
Metropolitan Government
Augusta-Richmond County
General health status score of residents in this county from 1 (poor) to 5 (excellent)
Nashville offers extensive infrastructure with healthcare facilities, universities, and music studios citywide. Augusta-Richmond also possesses strong infrastructure, especially in the healthcare sector with the Augusta University Health System.
Infrastructure
Type
Metropolitan Government
Augusta-Richmond County
TV stations
19
10
Culture and Food
Culturally, Nashville is famous for its country music scene and "Music City" reputation, with rich, southern cuisine. Augusta-Richmond is known for its Southern hospitality, golf culture, and dishes like Peach Cobbler and Pimento Cheese.
Sports Teams
Nashville hosts the Tennessee Titans (NFL) and Nashville Predators (NHL), whereas Augusta-Richmond is synonymous with golf, hosting the Masters Tournament annually.


 Metropolitan Government, TN and
  Augusta-Richmond County, GA : 328.3 miles
 Metropolitan Government, TN and
  Augusta-Richmond County, GA : 328.3 miles