Metropolitan Government (commonly known as Metro) in Nashville, Tennessee, and Birmingham, Alabama are two major cities in the southern United States. They host different characteristics and living conditions, making them unique and appealing to various people. This comparison, ranging from crime rates to sports teams, could ideally assist families and individuals planning to relocate or tourists contemplating a visit.
In terms of safety, both Metro and Birmingham have higher crime rates compared to the national average. Metropolitan Government has a lower property crime rate, which is of interest for prospective homeowners but robberies and assault rates are higher compared to Birmingham. Meanwhile, Birmingham records a higher overall crime rate which might be a factor for consideration for both residents and tourists.
Cost of Living
Birmingham has a generally lower cost of living compared to Metro that could be attractive to potential residents. This is partly due to lower average house prices, although there are areas in both cities where premium prices apply. Tourists might find Birmingham more affordable in terms of accommodation and dining.
Income Tax
Tennessee, where Metro is located, does not have a statewide income tax, a significant lure for many potential residents. In contrast, Alabama does impose a state income tax rate that ranges from 2-5%.
Property Tax
Property taxes are lower in Metro compared to Birmingham, meaning that homeowners might get a better deal in Metro despite the higher house prices.
Sales Tax
Sales tax in Metro is currently at 9.25%, while Birmingham has a sales tax rate of 10%, which is on the higher side nationally.
Income
Type
Metropolitan Government
Birmingham
Estimated median household income
$65,348
$36,614
Estimated per capita income
$43,994
$27,211
Cost of living index (U.S. average is 100)
97.9
87.1
If you make $50,000 in Birmingham, you will have to make $56,200 in Metropolitan Government to maintain the same standard of living.
Geographical Conditions
Metro is based in a valley surrounded by rolling hills, offering ample outdoor opportunities. Birmingham is known as the 'Pittsburgh of the South' due to its history in iron and steel, plus it has a network of green spaces and parks throughout the city.
Geographical information
Type
Metropolitan Government
Birmingham
Land area
502.3 sq. miles
149.9 sq. miles
Population density
1,236.2 people per sq. mile
1,317.9 people per sq. mile
Relative area comparison
Metropolitan Government, TN Birmingham, AL
Education
Both Metro and Birmingham have a mix of public and private schools, and several higher education institutions. However, Metro offers a larger number of higher education institutions including the renowned Vanderbilt University. This might be appealing for those with an interest in academia or families with older children.
Metro’s economy is powered by a diverse range of sectors with healthcare, education, music, and tourism providing many jobs. In contrast, Birmingham's economy is more oriented towards healthcare, banking, and manufacturing. Potential residents should consider their industry in making a choice on where to live.
Biggest Employers
In Metro, the biggest employers are Vanderbilt University Medical Center and the Metropolitan Nashville Public Schools. Birmingham's job market is dominated by employers like the University of Alabama at Birmingham and Regions Financial Corporation.
In Metropolitan Government (Davidson County), 58.5% voted for Democrats and 39.9% for Republicans in 2012 Presidential Election. In Birmingham (Jefferson County), 52.7% voted for Democrats and 46.7% for Republicans.
Elections
Type
Democrats
Republicans
Other
Year
Metropolitan Government
Birmingham
Metropolitan Government
Birmingham
Metropolitan Government
Birmingham
2020
65.0%
55.8%
32.6%
42.6%
2.3%
1.6%
2016
60.1%
51.6%
34.1%
44.3%
5.7%
4.1%
2012
58.5%
52.7%
39.9%
46.7%
1.6%
0.5%
2008
60.0%
52.6%
39.0%
47.4%
1.0%
0.0%
2004
54.9%
45.3%
44.6%
54.3%
0.4%
0.3%
2000
57.9%
47.6%
40.4%
50.8%
1.7%
1.6%
1996
79.3%
46.1%
18.1%
50.2%
2.6%
3.7%
Breakdown of population affiliated with a religious congregation
Type
Adherents
Congregations
Religion
Metropolitan Government
Birmingham
Metropolitan Government
Birmingham
SOUTHERN BAPTIST CONVENTION
14.1%
28.2%
19.6%
22.7%
CATHOLIC CHURCH
4.9%
8.4%
2.3%
2.7%
EPISCOPAL CHURCH
1.5%
2.1%
1.8%
1.4%
SEVENTH DAY ADVENTIST CHURCH
1.1%
0.6%
1.7%
1.2%
COPTIC ORTHODOX CHURCH
1.0%
0.0%
0.5%
0.1%
MUSLIM ESTIMATE
0.8%
0.5%
1.4%
0.6%
PRESBYTERIAN CHURCH IN AMERICA
0.8%
1.4%
0.9%
1.1%
CUMBERLAND PRESBYTERIAN CHURCH
0.4%
0.1%
1.3%
0.6%
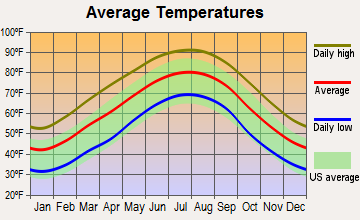
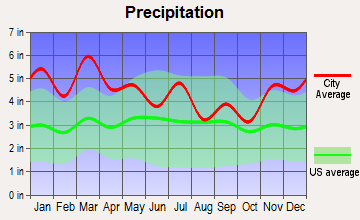
Weather
The weather in both cities is mostly similar with warm summers and mild winters typical of the southern United States. However, Metro experiences more rainfall compared to Birmingham throughout the year. This could impact outdoor activities for both locals and tourists.
Weather and climate
Type
Metropolitan Government
Birmingham
Temperature - Average
58.4°F
62.1°F
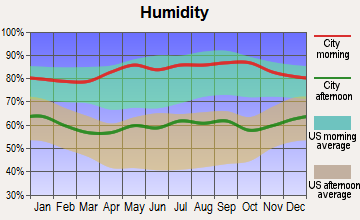
Humidity - Average morning or afternoon humidity
75.9%
75.5%
Humidity - Differences between morning and afternoon humidity
38%
38%
Humidity - Maximum monthly morning or afternoon humidity
89%
88%
Humidity - Minimum monthly morning or afternoon humidity
51%
50%
Precipitation - Yearly average
49 in
53.2 in
Snowfall - Yearly average
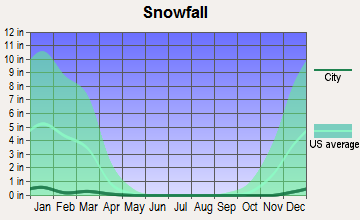
17.8 in
3.4 in
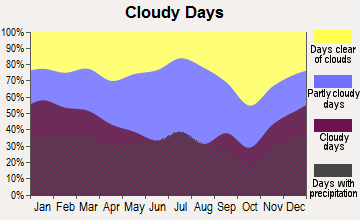
Clouds - Number of days clear of clouds
17.1%
16.4%
Sunshine amount - Average
59.7%
63.4%
Sunshine amount - Differences during a year
23%
21%
Sunshine amount - Maximum monthly
65%
67%
Sunshine amount - Minimum monthly
42%
46%
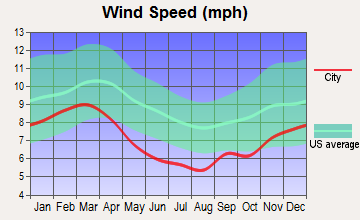
Wind speed - Average
7.7 mph
6.7 mph
Average climate in Metropolitan Government, Tennessee
Average climate in Birmingham, Alabama
Air pollution
Type
AQI
CO
NO2
OZONE
PB
PM10
PM25
SO2
Year
Metropolitan Government
Birmingham
Metropolitan Government
Birmingham
Metropolitan Government
Birmingham
Metropolitan Government
Birmingham
Metropolitan Government
Metropolitan Government
Birmingham
Metropolitan Government
Birmingham
Metropolitan Government
Birmingham
2018
71
83
0.40
0.29
13.8
9.6
24.1
26.2
N/A
N/A
15.2
18.9
9.2
10.5
0.2
2.3
2017
70
91
0.38
0.35
14.4
10.0
26.8
24.2
N/A
N/A
15.3
18.9
8.7
11.0
0.1
2.7
2016
90
87
0.42
0.34
16.1
12.1
26.4
27.6
N/A
N/A
N/A
19.7
10.1
10.4
0.0
1.1
2015
68
84
0.43
0.33
15.5
10.9
23.6
24.5
N/A
N/A
N/A
19.3
10.8
10.6
0.1
1.1
2014
66
84
N/A
0.29
N/A
11.7
26.3
24.1
N/A
N/A
N/A
21.3
9.8
11.4
1.4
1.1
2013
62
82
N/A
0.22
N/A
N/A
N/A
21.4
N/A
N/A
N/A
19.2
9.7
10.9
N/A
1.2
2012
81
92
N/A
0.28
N/A
N/A
28.3
24.4
N/A
N/A
N/A
21.8
11.0
11.5
2.3
1.6
2011
81
104
N/A
0.33
N/A
N/A
25.9
24.9
N/A
N/A
N/A
24.3
11.0
13.0
1.7
1.9
2010
80
101
N/A
0.24
N/A
N/A
24.3
24.1
N/A
N/A
N/A
25.6
12.2
12.9
2.2
N/A
2009
72
94
N/A
0.51
N/A
N/A
22.5
21.5
N/A
N/A
N/A
25.1
11.5
12.5
2.4
N/A
2008
81
105
N/A
0.72
N/A
N/A
25.7
23.9
N/A
N/A
N/A
32.2
13.4
15.2
2.5
N/A
2007
99
124
N/A
0.82
N/A
N/A
27.4
24.6
N/A
N/A
N/A
41.6
15.5
17.5
2.7
N/A
2006
93
131
0.69
1.16
N/A
N/A
24.9
24.0
N/A
N/A
N/A
33.2
14.9
18.0
2.9
N/A
2005
104
131
0.56
0.95
N/A
N/A
23.5
21.8
N/A
N/A
N/A
38.0
16.9
18.4
3.1
N/A
2004
83
116
0.61
0.68
N/A
N/A
22.0
19.1
0.006
N/A
N/A
39.7
N/A
17.1
2.6
N/A
2003
93
123
0.67
0.53
N/A
N/A
18.5
18.2
0.005
N/A
N/A
42.1
15.8
16.1
3.8
N/A
2002
92
133
0.68
0.70
N/A
N/A
20.2
21.2
N/A
N/A
N/A
37.1
15.3
17.2
4.3
N/A
2001
95
175
0.90
1.69
N/A
N/A
19.5
19.6
N/A
N/A
N/A
32.3
15.6
N/A
4.5
N/A
2000
97
136
0.75
1.35
N/A
N/A
19.8
23.3
N/A
N/A
N/A
38.3
N/A
N/A
4.1
N/A
Natural disasters
Type
Metropolitan Government
Birmingham
Tornado activity compared to U.S. average
169%
252.3%
Earthquake activity compared to U.S. average
296.3%
229.7%
Natural disasters compared to U.S. average
17%
32%
Transportation
Metro has a robust public transportation system with extensive bus routes and a commuter rail service. Birmingham's public transit is mainly comprised of buses run by the Birmingham Jefferson County Transit Authority.
Transport
Type
Metropolitan Government
Birmingham
Amtrak stations
0
1
Amtrak stations nearby
1
1
FAA registered aircraft
0
358
FAA registered aircraft manufacturers and dealers
0
4
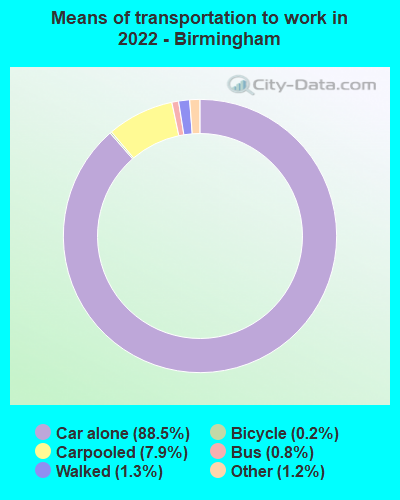
Means of transportation to work
Type
Metropolitan Government
Birmingham
Bicycle
0.1%
0.2%
Bus
1.6%
0.4%
Carpooled
13.3%
7.4%
Car alone
78.6%
89.4%
Taxicab
0.1%
0.2%
Walked
2.3%
1.1%
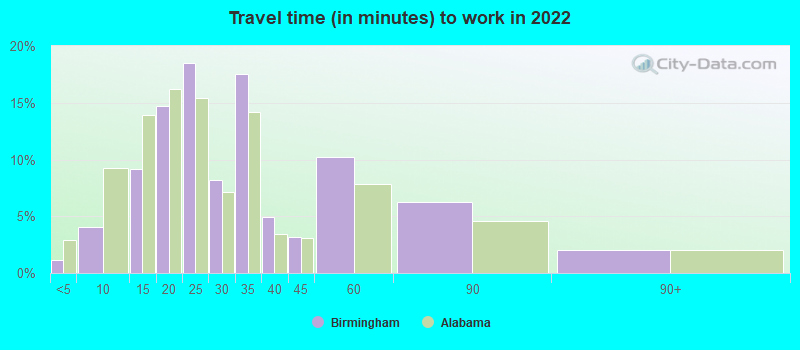
Average travel time to work
Type
Metropolitan Government
Birmingham
Average
23.7 min
29.2 min
Real Estate
Real estate is more costly in Metro compared to Birmingham, reflecting the former's higher cost of living. Residential properties in Metro range from modern condos in the city center to traditional single-family homes in the suburbs.
Neighborhoods
Both cities boast a mixture of quiet suburb-style neighborhoods and busier urban areas. Metro is famous for Music Row and East Nashville, while popular Birmingham neighborhoods include Five Points South and Lakeview.
Houses and residents
Type
Metropolitan Government
Birmingham
Houses
252,977
108,533
Average household size (people)
2.3
2.3
Houses occupied
237,405 (93.8%)
87,570 (80.7%)
Houses occupied by owners
131,384 (55.3%)
40,665 (46.4%)
Houses occupied by renters
106,021 (44.7%)
46,905 (53.6%)
Median rent asked for vacant for-rent units
$1,207
$620.56
Median price asked for vacant for-sale houses and condos
$226,967
$51,535
Estimated median house or condo value
$350,700
$117,600
Median number of rooms in apartments
4.2
4.5
Median number of rooms in houses and condos
6.4
6.2
Housing density (houses/condos per square mile)
503.7
724
Household income disparities
45.5%
50.2%
Housing units without a mortgage
32,597 (28.1%)
652 (3.2%)
Housing units with both a second mortgage and home equity loan
342 (0.3%)
837 (4%)
Housing units with a mortgage
83,416 (71.9%)
20,029 (96.8%)
Housing units with a home equity loan
8,009 (6.9%)
0 (0%)
Housing units with a second mortgage
9,691 (8.4%)
1,439 (7%)
Housing units lacking complete kitchen facilities
0.7%
5.3%
Housing units lacking complete plumbing facilities
Self-employed workers in own not incorporated business
20,090
4,375
State government workers
13,081
5,819
Unpaid family workers
668
158
Industries and Occupations
In Metro, healthcare and social assistance are the leading industries, followed by retail and education services. In Birmingham, healthcare and retail are also prominent, but there is a larger presence of manufacturing jobs.
Both cities host top-rated hospitals, but Metro's health sector is more robust. It homes Vanderbilt University Medical Center, a leading hospital nationally, and multiple other quality healthcare facilities. Birmingham, meanwhile, boasts the highly rated University of Alabama at Birmingham Hospital.
Health (county statistics)
Type
Metropolitan Government
Birmingham
General health status score of residents in this county from 1 (poor) to 5 (excellent)
Metro boasts more developed infrastructure with more comprehensive transit systems, including buses and a commuter rail service. Birmingham's infrastructure is less developed, but the city is undergoing significant improvements and developments.
Infrastructure
Type
Metropolitan Government
Birmingham
TV stations
19
17
Culture and Food
Culture and food offerings in both cities are shaped by their southern roots. Metro is dubbed the 'Music City' because of its music scene, while Birmingham hosts landmarks like the Civil Rights Institute. Both cities have thriving culinary scenes with BBQ dishes being a highlight.
Sports Teams
Sports fans will have a field day in both cities. Metro is home to the Tennessee Titans (NFL), Nashville Predators (NHL), and Nashville SC (MLS). Birmingham doesn't host major league teams but has a fervent following for college sports, particularly the University of Alabama's football team.
 Metropolitan Government, TN
 Birmingham, AL