Comparing life in Metropolitan Government, TN, and Chattanooga, TN, reveals contrasts and similarities. Both cities showcase Southern charm, vibrant cultures, and offer various opportunities. This comparison covers crime/safety, weather, cost of living, education, job market and economy, infrastructure, main industries and employers, housing, neighborhoods, transportation, taxes, food culture, sports teams, geography, and health care. This analysis is aimed at individuals considering relocation or tourists interested in spending time in these locations.
Comparatively, Metropolitan Government (Nashville-Davidson County), reports higher crime rates than Chattanooga, TN. Tourists need to be cautious in certain areas, especially after dark, while residents should study crime maps to select safer neighborhoods. Chattanooga's crime rate is also above the national average, but less when compared to Metropolitan Government. Besides, both cities have focused on improving safety via increased police patrolling and community initiatives.
Cost of Living
The cost of living in Metropolitan Government is slightly higher than Chattanooga. Factors for this difference include higher housing expenses and transportation costs in Metropolitan Government. However, affordable options exist in both cities depending on your lifestyle and choice of neighborhood.
Income Tax
Tennessee does not impose a state income tax, meaning residents of Metropolitan Government and Chattanooga won't pay state-level income taxes.
Property Tax
Property taxes differ between these cities. Metropolitan Government's property tax rates are generally higher, whereas Chattanooga's rates are comparatively lower.
Sales Tax
Tennessee has high sales taxes, which applies to both cities. The rate is 9.75% in Metropolitan Government and slightly lower in Chattanooga at 9.25%.
Income
Type
Metropolitan Government
Chattanooga
Estimated median household income
$65,348
$55,065
Estimated per capita income
$43,994
$34,297
Cost of living index (U.S. average is 100)
97.9
89.2
If you make $50,000 in Chattanooga, you will have to make $54,877 in Metropolitan Government to maintain the same standard of living.
Geographical Conditions
Metropolitan Government is centered on the banks of the Cumberland River, while Chattanooga is located between the Appalachian Mountains and the Cumberland Plateau, giving it a distinctive and picturesque scenery.
Geographical information
Type
Metropolitan Government
Chattanooga
Land area
502.3 sq. miles
135.2 sq. miles
Population density
1,236.2 people per sq. mile
1,346.9 people per sq. mile
Relative area comparison
Metropolitan Government, TN Chattanooga, TN
Education
Both cities boast good public and private schools and higher education institutions. Metropolitan Government is home to well-known Vanderbilt University, while Chattanooga has the University of Tennessee at Chattanooga. They offer a variety of programs for students, aiding in the cities' educational growth.
Metropolitan Government's economy is strong, driven by health care, music, tourism, and education. Chattanooga, while smaller, has a diversified economy with manufacturing, health care, and education. Both cities have ongoing growth trends and offer numerous opportunities for professionals across different sectors.
Biggest Employers
The biggest employers in Metropolitan Government include Vanderbilt University and Medical Center, Nissan North America, and HCA Healthcare. In Chattanooga, the key employers are Erlanger Health System, BlueCross BlueShield of Tennessee, and Volkswagen.
In Metropolitan Government (Davidson County), 58.5% voted for Democrats and 39.9% for Republicans in 2012 Presidential Election. In Chattanooga (Hamilton County), 41.6% voted for Democrats and 56.6% for Republicans.
Elections
Type
Democrats
Republicans
Other
Year
Metropolitan Government
Chattanooga
Metropolitan Government
Chattanooga
Metropolitan Government
Chattanooga
2020
65.0%
44.5%
32.6%
54.2%
2.3%
1.3%
2016
60.1%
39.1%
34.1%
55.6%
5.7%
5.4%
2012
58.5%
41.6%
39.9%
56.6%
1.6%
1.8%
2008
60.0%
43.4%
39.0%
55.2%
1.0%
1.3%
2004
54.9%
41.9%
44.6%
57.4%
0.4%
0.7%
2000
57.9%
43.1%
40.4%
55.5%
1.7%
1.3%
1996
79.3%
22.5%
18.1%
74.2%
2.6%
3.3%
Breakdown of population affiliated with a religious congregation
Type
Adherents
Congregations
Religion
Metropolitan Government
Chattanooga
Metropolitan Government
Chattanooga
SOUTHERN BAPTIST CONVENTION
14.1%
21.9%
19.6%
20.5%
CATHOLIC CHURCH
4.9%
3.8%
2.3%
1.1%
EPISCOPAL CHURCH
1.5%
1.8%
1.8%
2.1%
SEVENTH DAY ADVENTIST CHURCH
1.1%
3.1%
1.7%
3.8%
COPTIC ORTHODOX CHURCH
1.0%
0.0%
0.5%
0.2%
MUSLIM ESTIMATE
0.8%
0.6%
1.4%
1.3%
PRESBYTERIAN CHURCH IN AMERICA
0.8%
2.1%
0.9%
2.3%
CUMBERLAND PRESBYTERIAN CHURCH
0.4%
0.4%
1.3%
0.9%
LUTHERAN CHURCH
0.3%
0.4%
0.9%
0.9%
Weather
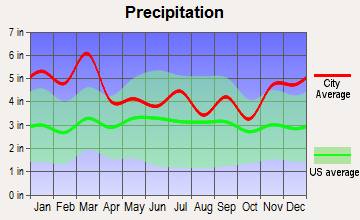
Both Metropolitan Government and Chattanooga enjoy four distinct seasons and a humid subtropical climate. Metropolitan Government sees slightly more rainfall throughout the year, while Chattanooga regularly experiences higher temperatures in summer.
Weather and climate
Type
Metropolitan Government
Chattanooga
Temperature - Average
58.4°F
60°F
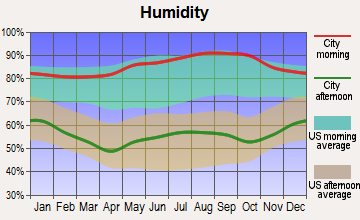
Humidity - Average morning or afternoon humidity
75.9%
76%
Humidity - Differences between morning and afternoon humidity
38%
42%
Humidity - Maximum monthly morning or afternoon humidity
89%
90%
Humidity - Minimum monthly morning or afternoon humidity
51%
48%
Precipitation - Yearly average
49 in
53.2 in
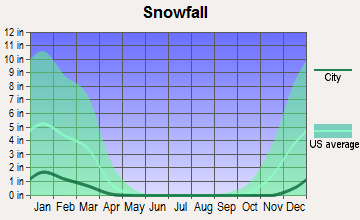
Snowfall - Yearly average
17.8 in
7.8 in
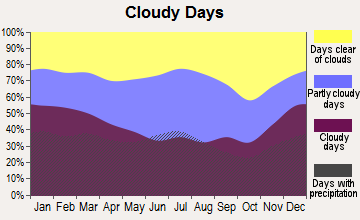
Clouds - Number of days clear of clouds
17.1%
17.3%
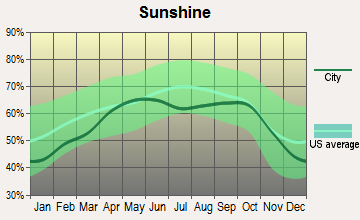
Sunshine amount - Average
59.7%
59.8%
Sunshine amount - Differences during a year
23%
19%
Sunshine amount - Maximum monthly
65%
63%
Sunshine amount - Minimum monthly
42%
44%
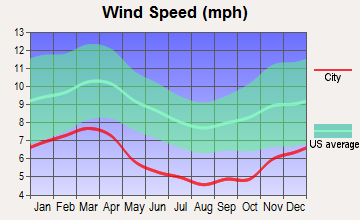
Wind speed - Average
7.7 mph
5.4 mph
Average climate in Metropolitan Government, Tennessee
Average climate in Chattanooga, Tennessee
Air pollution
Type
AQI
CO
NO2
OZONE
PB
PM10
PM25
SO2
Year
Metropolitan Government
Chattanooga
Metropolitan Government
Chattanooga
Metropolitan Government
Chattanooga
Metropolitan Government
Chattanooga
Metropolitan Government
Metropolitan Government
Metropolitan Government
Chattanooga
Metropolitan Government
Chattanooga
2018
71
68
0.40
N/A
13.8
N/A
24.1
32.2
N/A
N/A
15.2
N/A
9.2
9.0
0.2
N/A
2017
70
74
0.38
N/A
14.4
N/A
26.8
32.8
N/A
N/A
15.3
N/A
8.7
9.5
0.1
N/A
2016
90
88
0.42
N/A
16.1
N/A
26.4
37.3
N/A
N/A
N/A
N/A
10.1
10.4
0.0
N/A
2015
68
76
0.43
N/A
15.5
N/A
23.6
31.5
N/A
N/A
N/A
N/A
10.8
9.7
0.1
N/A
2014
66
74
N/A
N/A
N/A
N/A
26.3
33.5
N/A
N/A
N/A
N/A
9.8
10.1
1.4
N/A
2013
62
77
N/A
N/A
N/A
N/A
N/A
33.0
N/A
N/A
N/A
N/A
9.7
10.2
N/A
N/A
2012
81
89
N/A
N/A
N/A
N/A
28.3
36.1
N/A
N/A
N/A
N/A
11.0
11.8
2.3
N/A
2011
81
91
N/A
N/A
N/A
N/A
25.9
35.6
N/A
N/A
N/A
N/A
11.0
13.8
1.7
N/A
2010
80
93
N/A
N/A
N/A
N/A
24.3
37.2
N/A
N/A
N/A
N/A
12.2
13.2
2.2
N/A
2009
72
81
N/A
N/A
N/A
N/A
22.5
33.0
N/A
N/A
N/A
N/A
11.5
11.8
2.4
N/A
2008
81
95
N/A
N/A
N/A
N/A
25.7
37.2
N/A
N/A
N/A
N/A
13.4
15.0
2.5
N/A
2007
99
118
N/A
N/A
N/A
N/A
27.4
41.7
N/A
N/A
N/A
N/A
15.5
N/A
2.7
N/A
2006
93
99
0.69
N/A
N/A
N/A
24.9
37.4
N/A
N/A
N/A
N/A
14.9
N/A
2.9
N/A
2005
104
93
0.56
N/A
N/A
5.5
23.5
34.5
N/A
N/A
N/A
N/A
16.9
N/A
3.1
1.5
2004
83
105
0.61
N/A
N/A
N/A
22.0
33.8
0.006
N/A
N/A
N/A
N/A
N/A
2.6
N/A
2003
93
95
0.67
N/A
N/A
N/A
18.5
27.2
0.005
N/A
N/A
N/A
15.8
N/A
3.8
N/A
2002
92
103
0.68
1.00
N/A
5.1
20.2
30.2
N/A
N/A
N/A
N/A
15.3
N/A
4.3
1.4
2001
95
110
0.90
N/A
N/A
N/A
19.5
27.8
N/A
N/A
N/A
N/A
15.6
N/A
4.5
N/A
2000
97
132
0.75
N/A
N/A
N/A
19.8
28.8
N/A
N/A
N/A
N/A
N/A
N/A
4.1
N/A
Natural disasters
Type
Metropolitan Government
Chattanooga
Tornado activity compared to U.S. average
169%
149.2%
Earthquake activity compared to U.S. average
296.3%
214.8%
Natural disasters compared to U.S. average
17%
17%
Transportation
Metropolitan Government offers more public transportation options with bus and commuter train services. Chattanooga has a free electric shuttle for downtown and a comprehensive bus service, although residents usually prefer using cars.
Transport
Type
Metropolitan Government
Chattanooga
Amtrak stations
0
1
Amtrak stations nearby
1
1
FAA registered aircraft
0
145
FAA registered aircraft manufacturers and dealers
0
13
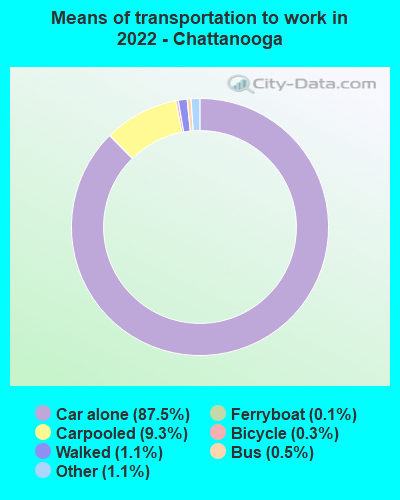
Means of transportation to work
Type
Metropolitan Government
Chattanooga
Bicycle
0.1%
0.1%
Bus
1.6%
0.4%
Carpooled
13.3%
8.6%
Car alone
78.6%
89%
Motorcycle
0.1%
0.1%
Taxicab
0.1%
0.4%
Walked
2.3%
1%
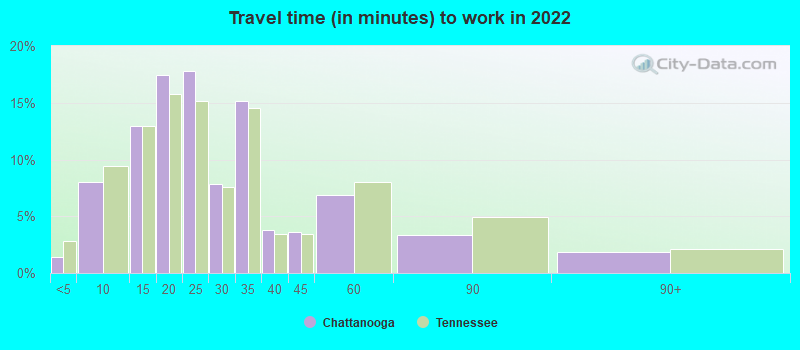
Average travel time to work
Type
Metropolitan Government
Chattanooga
Average
23.7 min
27.1 min
Real Estate
Real estate in Metropolitan Government is more expensive than in Chattanooga, due to Nashville's appeal and growth. Chattanooga offers more affordable housing options, making it attractive for people on a tight budget.
Neighborhoods
Both cities offer a variety of neighborhoods, each reflecting unique character and atmosphere. Metropolitan Government has areas like East Nashville and The Gulch, while Chattanooga boasts Northshore and Southside.
Houses and residents
Type
Metropolitan Government
Chattanooga
Houses
252,977
86,385
Average household size (people)
2.3
2.3
Houses occupied
237,405 (93.8%)
77,299 (89.5%)
Houses occupied by owners
131,384 (55.3%)
41,455 (53.6%)
Houses occupied by renters
106,021 (44.7%)
35,844 (46.4%)
Median rent asked for vacant for-rent units
$1,207
$1,964
Median price asked for vacant for-sale houses and condos
$226,967
$160,185
Estimated median house or condo value
$350,700
$235,900
Median number of rooms in apartments
4.2
4.1
Median number of rooms in houses and condos
6.4
6.4
Housing density (houses/condos per square mile)
503.7
638.9
Household income disparities
45.5%
47%
Housing units without a mortgage
32,597 (28.1%)
739 (2.9%)
Housing units with both a second mortgage and home equity loan
342 (0.3%)
1,674 (6.6%)
Housing units with a mortgage
83,416 (71.9%)
24,594 (97.1%)
Housing units with a home equity loan
8,009 (6.9%)
89 (0.4%)
Housing units with a second mortgage
9,691 (8.4%)
2,103 (8.3%)
Housing units lacking complete kitchen facilities
0.7%
3.1%
Housing units lacking complete plumbing facilities
Self-employed workers in own not incorporated business
20,090
3,502
State government workers
13,081
4,173
Unpaid family workers
668
224
Industries and Occupations
Metropolitan Government is widely acknowledged for its healthcare sector, followed by its music and entertainment industry. Meanwhile, Chattanooga is recognized for its manufacturing industry, with Volkswagen having a significant plant there.
Both cities provide excellent health care facilities. Metropolitan Government houses renowned Vanderbilt University Medical Center, while Erlanger Health System in Chattanooga is highly respected.
Health (county statistics)
Type
Metropolitan Government
Chattanooga
General health status score of residents in this county from 1 (poor) to 5 (excellent)
Metropolitan Government is larger and more developed with several modern facilities. Chattanooga, though smaller, has seen significant developments in infrastructure, including the revitalization of its downtown and riverfront areas.
Infrastructure
Type
Metropolitan Government
Chattanooga
TV stations
19
14
Nuclear power plants nearby
0
2
Culture and Food
Culture and food are where both cities shine. Metropolitan Government is renowned for its music scene and southern cuisine. Chattanooga also provides a vibrant cultural scene and diverse food options, becoming a culinary hotspot with many local restaurants and food festivals.
Sports Teams
Metropolitan Government is home to the NHL's Nashville Predators and NFL's Tennessee Titans. Chattanooga doesn't house any major league sports teams but offers minor league games and university sports.
 Metropolitan Government, TN
 Chattanooga, TN