The comparison between the Metropolitan Government, more often known as Nashville-Davidson, and Clarksville, both located in Tennessee, reveals diverse attributes suitable for varying interests. Whether considering relocation or simply visiting, it's essential to understand each city's distinct features. This evaluation focuses on essential factors such as crime/safety, weather, cost of living, education, work and economy, infrastructure, and many others.
Nashville-Davidson holds a somewhat higher crime rate compared to Clarksville. However, both cities display a devoted law enforcement presence, aiming to ensure the safety of residents and tourists. For those looking for a safer environment, Clarksville may be the preferable choice.
Cost of Living
Nashville-Davidson's cost of living index surpasses Clarksville's, mainly due to housing costs. The median home cost is significantly higher in Nashville-Davidson. However, you may find there are more amenities, which could explain the increased cost of living.
Income Tax
In Tennessee, there is no state income tax levied on salaries and wages. This advantage applies to both Nashville-Davidson and Clarksville.
Property Tax
Property taxes in Nashville-Davidson tend to be higher compared to Clarksville, reflecting the area's higher property values.
Sales Tax
Tennessee has a state sales tax of 7%, however, Nashville-Davidson has an additional local tax of 2.25%, making it total 9.25%. Clarksville also imposes a local tax of 2.5%, culminating in a total of 9.5% sales tax.
Income
Type
Metropolitan Government
Clarksville
Estimated median household income
$65,348
$60,686
Estimated per capita income
$43,994
$26,631
Cost of living index (U.S. average is 100)
97.9
87.7
If you make $50,000 in Clarksville, you will have to make $55,815 in Metropolitan Government to maintain the same standard of living.
Geographical Conditions
Located in the Nashville Basin, Nashville-Davidson exhibits rolling hills and fertile soil, making it visually appealing. Meanwhile, Clarksville is characterized by a blend of flatland and hilly terrain, offering outdoor recreational opportunities.
Geographical information
Type
Metropolitan Government
Clarksville
Land area
502.3 sq. miles
94.9 sq. miles
Population density
1,236.2 people per sq. mile
1,802.2 people per sq. mile
Relative area comparison
Metropolitan Government, TN Clarksville, TN
Education
When it comes to education, both locales offer solid options. Nashville-Davidson is home to top universities like Vanderbilt University, while Clarksville houses Austin Peay State University. Still, Nashville-Davidson has a greater range of educational opportunities, proving a more appealing choice for academics.
Nashville-Davidson is commonly seen as a more lucrative place for job seekers, mainly due to the expansive music industry. However, Clarksville also has a strong job market, notably in manufacturing and retail trade.
Biggest Employers
Nashville-Davidson's biggest employers spread across healthcare, entertainment, and education. Conversely, Clarksville's major employers lie within the military sector at Fort Campbell, followed by some large industrial companies.
In Metropolitan Government (Davidson County), 58.5% voted for Democrats and 39.9% for Republicans in 2012 Presidential Election. In Clarksville (Montgomery County), 44.3% voted for Democrats and 54.6% for Republicans.
Elections
Type
Democrats
Republicans
Other
Year
Metropolitan Government
Clarksville
Metropolitan Government
Clarksville
Metropolitan Government
Clarksville
2020
65.0%
42.6%
32.6%
55.3%
2.3%
2.2%
2016
60.1%
37.8%
34.1%
56.4%
5.7%
5.7%
2012
58.5%
44.3%
39.9%
54.6%
1.6%
1.1%
2008
60.0%
45.6%
39.0%
53.5%
1.0%
0.9%
2004
54.9%
41.1%
44.6%
58.6%
0.4%
0.4%
2000
57.9%
48.5%
40.4%
50.6%
1.7%
0.9%
1996
79.3%
75.0%
18.1%
22.1%
2.6%
2.9%
Breakdown of population affiliated with a religious congregation
Type
Adherents
Congregations
Religion
Metropolitan Government
Clarksville
Metropolitan Government
Clarksville
SOUTHERN BAPTIST CONVENTION
14.1%
22.0%
19.6%
22.3%
CATHOLIC CHURCH
4.9%
4.4%
2.3%
0.5%
EPISCOPAL CHURCH
1.5%
0.3%
1.8%
1.0%
SEVENTH DAY ADVENTIST CHURCH
1.1%
0.2%
1.7%
1.0%
COPTIC ORTHODOX CHURCH
1.0%
0.0%
0.5%
0.0%
MUSLIM ESTIMATE
0.8%
0.2%
1.4%
0.5%
PRESBYTERIAN CHURCH IN AMERICA
0.8%
0.1%
0.9%
0.5%
CUMBERLAND PRESBYTERIAN CHURCH
0.4%
0.4%
1.3%
3.9%
LUTHERAN CHURCH
0.3%
0.4%
0.9%
0.5%
NATIONAL ASSOCIATION FREE WILL BAPTISTS
0.3%
0.4%
2.0%
2.9%
Weather
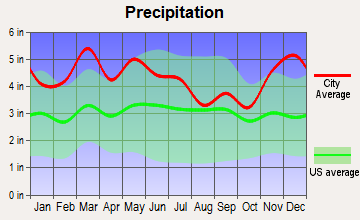
Both cities experience a humid subtropical climate. Summers can be hot and humid while winters are typically mild. Nashvillians may experience slightly more rain compared to Clarksville, beneficial for those who appreciate wetter climates.
Weather and climate
Type
Metropolitan Government
Clarksville
Temperature - Average
58.4°F
57.9°F
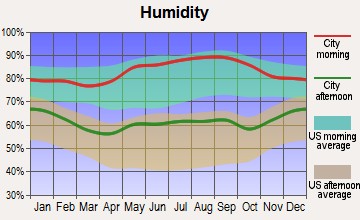
Humidity - Average morning or afternoon humidity
75.9%
76%
Humidity - Differences between morning and afternoon humidity
38%
37.8%
Humidity - Maximum monthly morning or afternoon humidity
89%
89.1%
Humidity - Minimum monthly morning or afternoon humidity
51%
51.3%
Precipitation - Yearly average
49 in
51.8 in
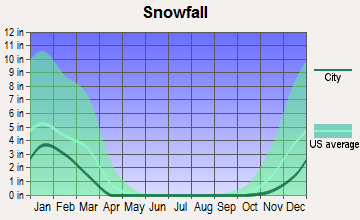
Snowfall - Yearly average
17.8 in
18.2 in
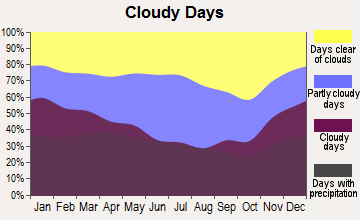
Clouds - Number of days clear of clouds
17.1%
17.1%
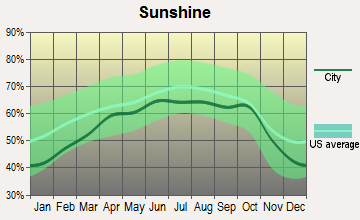
Sunshine amount - Average
59.7%
60.9%
Sunshine amount - Differences during a year
23%
23%
Sunshine amount - Maximum monthly
65%
66%
Sunshine amount - Minimum monthly
42%
43%
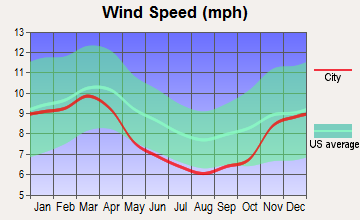
Wind speed - Average
7.7 mph
7.6 mph
Average climate in Metropolitan Government, Tennessee
Average climate in Clarksville, Tennessee
Air pollution
Type
AQI
CO
NO2
OZONE
PB
PM10
PM25
SO2
Year
Metropolitan Government
Clarksville
Metropolitan Government
Metropolitan Government
Clarksville
Metropolitan Government
Clarksville
Metropolitan Government
Metropolitan Government
Metropolitan Government
Clarksville
Metropolitan Government
Clarksville
2018
71
62
0.40
N/A
13.8
N/A
24.1
32.2
N/A
N/A
15.2
N/A
9.2
8.0
0.2
N/A
2017
70
59
0.38
N/A
14.4
N/A
26.8
32.3
N/A
N/A
15.3
N/A
8.7
8.1
0.1
N/A
2016
90
46
0.42
N/A
16.1
N/A
26.4
33.1
N/A
N/A
N/A
N/A
10.1
N/A
0.0
N/A
2015
68
41
0.43
N/A
15.5
N/A
23.6
33.5
N/A
N/A
N/A
N/A
10.8
N/A
0.1
1.4
2014
66
44
N/A
N/A
N/A
N/A
26.3
34.3
N/A
N/A
N/A
N/A
9.8
N/A
1.4
1.6
2013
62
44
N/A
N/A
N/A
N/A
N/A
35.0
N/A
N/A
N/A
N/A
9.7
N/A
N/A
1.3
2012
81
56
N/A
N/A
N/A
N/A
28.3
40.2
N/A
N/A
N/A
N/A
11.0
N/A
2.3
1.8
2011
81
53
N/A
N/A
N/A
N/A
25.9
38.3
N/A
N/A
N/A
N/A
11.0
N/A
1.7
2.4
2010
80
56
N/A
N/A
N/A
N/A
24.3
41.0
N/A
N/A
N/A
N/A
12.2
N/A
2.2
1.5
2009
72
45
N/A
N/A
N/A
N/A
22.5
34.6
N/A
N/A
N/A
N/A
11.5
N/A
2.4
1.5
2008
81
59
N/A
N/A
N/A
N/A
25.7
39.2
N/A
N/A
N/A
N/A
13.4
N/A
2.5
1.4
2007
99
82
N/A
N/A
N/A
N/A
27.4
45.7
N/A
N/A
N/A
N/A
15.5
N/A
2.7
3.0
2006
93
66
0.69
N/A
N/A
N/A
24.9
36.5
N/A
N/A
N/A
N/A
14.9
N/A
2.9
5.5
2005
104
76
0.56
N/A
N/A
3.6
23.5
34.6
N/A
N/A
N/A
N/A
16.9
N/A
3.1
4.0
2004
83
63
0.61
N/A
N/A
N/A
22.0
37.8
0.006
N/A
N/A
N/A
N/A
N/A
2.6
5.0
2003
93
76
0.67
N/A
N/A
N/A
18.5
40.6
0.005
N/A
N/A
N/A
15.8
N/A
3.8
5.0
2002
92
74
0.68
N/A
N/A
N/A
20.2
40.2
N/A
N/A
N/A
N/A
15.3
N/A
4.3
4.9
2001
95
78
0.90
N/A
N/A
N/A
19.5
37.1
N/A
N/A
N/A
N/A
15.6
N/A
4.5
3.7
2000
97
98
0.75
N/A
N/A
4.9
19.8
34.7
N/A
N/A
N/A
N/A
N/A
N/A
4.1
3.3
Natural disasters
Type
Metropolitan Government
Clarksville
Tornado activity compared to U.S. average
169%
158.8%
Earthquake activity compared to U.S. average
296.3%
331.7%
Natural disasters compared to U.S. average
17%
13%
Transportation
Both cities offer public transit options, with Nashville-Davidson's being more comprehensive due to its larger size. Traffic tends to be heavier in Nashville-Davidson, but it also provides more commuting options.
Transport
Type
Metropolitan Government
Clarksville
Amtrak stations nearby
1
0
FAA registered aircraft
0
81
FAA registered aircraft manufacturers and dealers
0
11
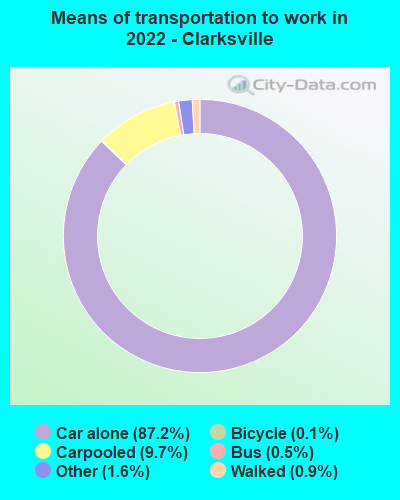
Means of transportation to work
Type
Metropolitan Government
Clarksville
Bicycle
0.1%
0.1%
Bus
1.6%
0.5%
Carpooled
13.3%
9.6%
Car alone
78.6%
87.5%
Motorcycle
0.1%
0.2%
Taxicab
0.1%
0.1%
Walked
2.3%
1.1%
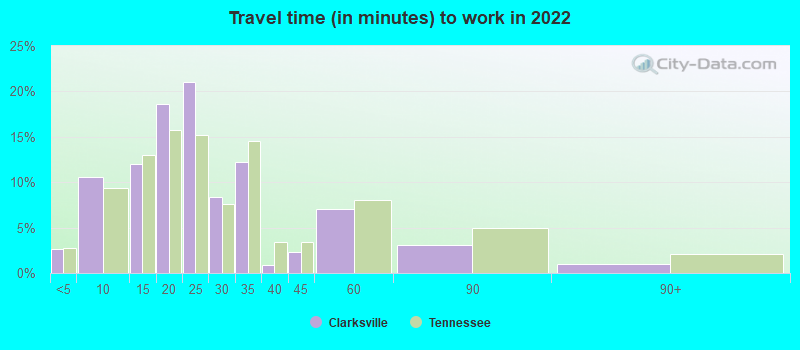
Average travel time to work
Type
Metropolitan Government
Clarksville
Average
23.7 min
25.9 min
Real Estate
Real estate in Nashville-Davidson tends to be more expensive than Clarksville due to the larger market and higher demand. However, this means higher potential returns for property investors. Clarksville's real estate market is more affordable, welcoming to first-time homebuyers.
Neighborhoods
Nashville-Davidson offers a wider variety of neighborhoods, from artsy areas to upscale districts. Clarksville provides a selection of family-friendly communities with a more relaxed atmosphere.
Houses and residents
Type
Metropolitan Government
Clarksville
Houses
252,977
68,485
Average household size (people)
2.3
2.6
Houses occupied
237,405 (93.8%)
63,787 (93.1%)
Houses occupied by owners
131,384 (55.3%)
34,601 (54.2%)
Houses occupied by renters
106,021 (44.7%)
29,186 (45.8%)
Median rent asked for vacant for-rent units
$1,207
$900.96
Median price asked for vacant for-sale houses and condos
$226,967
$228,803
Estimated median house or condo value
$350,700
$211,100
Median number of rooms in apartments
4.2
4.6
Median number of rooms in houses and condos
6.4
6.3
Housing density (houses/condos per square mile)
503.7
722
Household income disparities
45.5%
37.6%
Housing units without a mortgage
32,597 (28.1%)
530 (2.2%)
Housing units with both a second mortgage and home equity loan
342 (0.3%)
1,709 (7.1%)
Housing units with a mortgage
83,416 (71.9%)
23,690 (97.8%)
Housing units with a home equity loan
8,009 (6.9%)
0 (0%)
Housing units with a second mortgage
9,691 (8.4%)
1,709 (7.1%)
Housing units lacking complete kitchen facilities
0.7%
1.6%
Housing units lacking complete plumbing facilities
Self-employed workers in own not incorporated business
20,090
1,734
State government workers
13,081
2,881
Unpaid family workers
668
0
Industries and Occupations
Nashville-Davidson shines in the music and entertainment industry, while healthcare and education are also leading sectors. Meanwhile, Clarksville takes pride in its robust manufacturing, military, and educational sectors.
Nashville-Davidson stands out with its excellent healthcare facilities, including the renowned Vanderbilt University Medical Center. On the other hand, Clarksville's Tennova Healthcare offers solid healthcare services to its residents.
Health (county statistics)
Type
Metropolitan Government
Clarksville
General health status score of residents in this county from 1 (poor) to 5 (excellent)
Both cities boast robust infrastructure. Nashville-Davidson, as the state capital, can offer larger-scale public services. Conversely, Clarksville's smaller size can provide a more tight-knit community feel and provide adequate services for its population.
Infrastructure
Type
Metropolitan Government
Clarksville
TV stations
19
8
Culture and Food
Nashville-Davidson's cultural scene, due to its renowned music industry, is vibrant and varied. It boasts an extensive food scene, offering everything from Southern comfort cuisine to international dishes. Clarksville also offers a rich cultural heritage with a more localized culinary scene.
Sports Teams
Nashville-Davidson hosts several professional sports teams including the Tennessee Titans (NFL) and the Nashville Predators (NHL). Clarksville, by contrast, does not host any professional sports teams, but offers a strong community sports support.
 Metropolitan Government, TN
 Clarksville, TN