When comparing Metropolitan Government, TN and Columbus, GA, both offer unique living experiences. Metropolitan Government, often referred to as Metro Nashville or Nashville, is known for its vibrant music scene, booming economy, and diverse culture. Columbus, GA, situated near the Chattahoochee River, offers a more relaxed lifestyle with an appealing southern charm. This comparison will help potential relocators and tourists understand the significant differences in crime and safety, weather, cost of living, education, work and economy, and many more aspects.
Nashville’s crime rates have been a concern in recent years, with some areas experiencing higher rates than others. However, the Metropolitan Police work diligently to ensure safety. Conversely, Columbus, GA has a similar crime rate to Nashville, with proactive efforts from local law enforcement to curb it. It's always advisable for tourists and locals to stay in safe areas and adhere to common safety precautions.
Cost of Living
The cost of living in Nashville is marginally higher than the national average, reflecting the city's growing economy and high demand. Housing is the leading factor in this high cost. Meanwhile, Columbus offers a cheaper cost of living, with housing costs significantly lower than the national average.
Income Tax
Tennessee currently does not impose a state income tax on salaries and wages. In contrast, Georgia has an income tax ranging from 1% to 6%, depending on income.
Property Tax
Property tax in Nashville tends to be higher due to the increased value of properties. In contrast, Columbus has lower property values and comparatively lower taxes.
Sales Tax
Tennessee has a higher state sales tax rate at 7%, with Nashville adding a 2.25% city sales tax. Georgia's state sales tax is 4%, and Columbus adds a 4% city sales tax.
Income
Type
Metropolitan Government
Columbus
Estimated median household income
$65,348
$52,817
Estimated per capita income
$43,994
$29,689
Cost of living index (U.S. average is 100)
97.9
86.8
If you make $50,000 in Columbus, you will have to make $56,394 in Metropolitan Government to maintain the same standard of living.
Geographical Conditions
Nashville is located in the Eastern Highland Rim and is characterized by rolling hills. Columbus is situated on the fall line, giving it varied geography with sections of flat plains and hilly areas.
Geographical information
Type
Metropolitan Government
Columbus
Land area
502.3 sq. miles
216.1 sq. miles
Population density
1,236.2 people per sq. mile
860.2 people per sq. mile
Relative area comparison
Metropolitan Government, TN Columbus, GA
Education
Metropolitan Nashville is home to many top-rated universities like Vanderbilt and Belmont. In Columbus, the Muscogee County School District manages public schools, and there's Columbus State University for higher education. Both cities place high importance on education and offer ample opportunities.
Nashville’s economy is growing rapidly, driven by industries like healthcare, education, and music. Columbus, while smaller, has a steady economy with focus on manufacturing, healthcare, and education. Employment opportunities are abundant in both cities given their diverse industrial setups.
Biggest Employers
Vanderbilt University Medical Center, Nissan North America, and HCA Healthcare are among Nashville’s biggest employers. In Columbus, the biggest employers are the Muscogee County School District, TSYS, and the Medical Center Hospital.
In Metropolitan Government (Davidson County), 58.5% voted for Democrats and 39.9% for Republicans in 2012 Presidential Election. In Columbus (Muscogee County), 60.3% voted for Democrats and 39.0% for Republicans.
Elections
Type
Democrats
Republicans
Other
Year
Metropolitan Government
Columbus
Metropolitan Government
Columbus
Metropolitan Government
Columbus
2020
65.0%
61.4%
32.6%
37.4%
2.3%
1.2%
2016
60.1%
57.4%
34.1%
38.9%
5.7%
3.7%
2012
58.5%
60.3%
39.9%
39.0%
1.6%
0.7%
2008
60.0%
59.7%
39.0%
40.0%
1.0%
0.4%
2004
54.9%
51.4%
44.6%
48.2%
0.4%
0.4%
2000
57.9%
54.3%
40.4%
45.2%
1.7%
0.5%
1996
79.3%
53.8%
18.1%
41.9%
2.6%
4.4%
Breakdown of population affiliated with a religious congregation
Type
Adherents
Congregations
Religion
Metropolitan Government
Columbus
Metropolitan Government
Columbus
SOUTHERN BAPTIST CONVENTION
14.1%
22.8%
19.6%
16.6%
CATHOLIC CHURCH
4.9%
4.6%
2.3%
1.5%
EPISCOPAL CHURCH
1.5%
0.6%
1.8%
1.2%
SEVENTH DAY ADVENTIST CHURCH
1.1%
0.5%
1.7%
0.8%
COPTIC ORTHODOX CHURCH
1.0%
0.0%
0.5%
0.0%
MUSLIM ESTIMATE
0.8%
1.2%
1.4%
1.2%
PRESBYTERIAN CHURCH IN AMERICA
0.8%
0.2%
0.9%
1.2%
CUMBERLAND PRESBYTERIAN CHURCH
0.4%
0.0%
1.3%
0.0%
AMERICAN BAPTIST CHURCHES IN THE USA
0.1%
0.5%
0.3%
0.8%
Weather
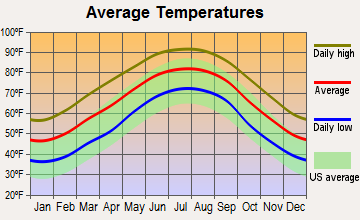
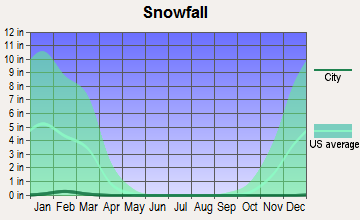
Metropolitan Nashville experiences a humid subtropical climate with hot summers and mild winters. Snowfall is light and occurs infrequently. Columbus, GA shares a similar climate, with slightly warmer temperatures in the summer and cool winters. Both cities offer a fairly comfortable climate most of the year.
Weather and climate
Type
Metropolitan Government
Columbus
Temperature - Average
58.4°F
65.1°F
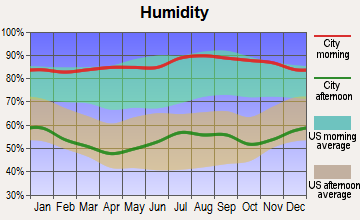
Humidity - Average morning or afternoon humidity
75.9%
74.6%
Humidity - Differences between morning and afternoon humidity
38%
42%
Humidity - Maximum monthly morning or afternoon humidity
89%
89%
Humidity - Minimum monthly morning or afternoon humidity
51%
47%
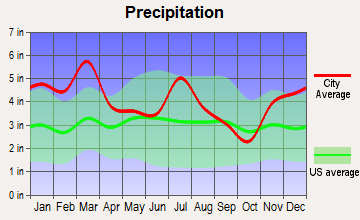
Precipitation - Yearly average
49 in
48.6 in
Snowfall - Yearly average
17.8 in
1 in
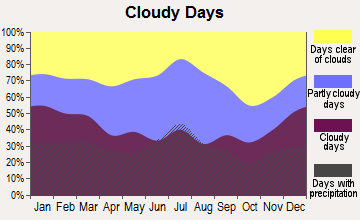
Clouds - Number of days clear of clouds
17.1%
18.3%
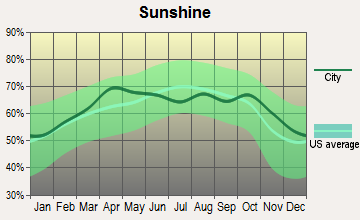
Sunshine amount - Average
59.7%
66.5%
Sunshine amount - Differences during a year
23%
17.4%
Sunshine amount - Maximum monthly
65%
68%
Sunshine amount - Minimum monthly
42%
50.6%
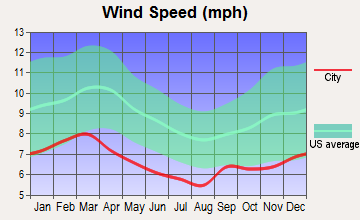
Wind speed - Average
7.7 mph
6.6 mph
Average climate in Metropolitan Government, Tennessee
Average climate in Columbus, Georgia
Air pollution
Type
AQI
CO
NO2
OZONE
PB
PM10
PM25
SO2
Year
Metropolitan Government
Columbus
Metropolitan Government
Metropolitan Government
Metropolitan Government
Columbus
Metropolitan Government
Columbus
Metropolitan Government
Metropolitan Government
Columbus
Metropolitan Government
Columbus
2018
71
61
0.40
N/A
13.8
N/A
24.1
28.3
N/A
N/A
15.2
N/A
9.2
6.8
0.2
N/A
2017
70
71
0.38
N/A
14.4
N/A
26.8
28.8
N/A
N/A
15.3
N/A
8.7
8.4
0.1
N/A
2016
90
76
0.42
N/A
16.1
N/A
26.4
30.8
N/A
N/A
N/A
N/A
10.1
8.1
0.0
N/A
2015
68
70
0.43
N/A
15.5
N/A
23.6
26.9
N/A
N/A
N/A
N/A
10.8
8.1
0.1
N/A
2014
66
78
N/A
N/A
N/A
N/A
26.3
28.0
N/A
N/A
N/A
N/A
9.8
9.2
1.4
N/A
2013
62
72
N/A
N/A
N/A
N/A
N/A
28.5
N/A
N/A
N/A
N/A
9.7
8.4
N/A
N/A
2012
81
79
N/A
N/A
N/A
N/A
28.3
30.6
N/A
N/A
N/A
N/A
11.0
9.5
2.3
1.1
2011
81
86
N/A
N/A
N/A
N/A
25.9
32.0
N/A
N/A
N/A
N/A
11.0
11.6
1.7
1.2
2010
80
81
N/A
N/A
N/A
N/A
24.3
31.5
N/A
N/A
N/A
N/A
12.2
10.9
2.2
1.2
2009
72
75
N/A
N/A
N/A
N/A
22.5
28.8
N/A
N/A
N/A
N/A
11.5
10.0
2.4
1.3
2008
81
81
N/A
N/A
N/A
N/A
25.7
33.2
N/A
0.004
N/A
N/A
13.4
11.7
2.5
1.7
2007
99
103
N/A
N/A
N/A
N/A
27.4
35.7
N/A
0.004
N/A
N/A
15.5
14.8
2.7
N/A
2006
93
99
0.69
N/A
N/A
N/A
24.9
34.6
N/A
0.004
N/A
N/A
14.9
14.1
2.9
N/A
2005
104
104
0.56
N/A
N/A
N/A
23.5
30.6
N/A
0.004
N/A
N/A
16.9
13.3
3.1
2.0
2004
83
94
0.61
N/A
N/A
N/A
22.0
28.9
0.006
0.005
N/A
N/A
N/A
13.3
2.6
N/A
2003
93
84
0.67
N/A
N/A
N/A
18.5
26.9
0.005
0.004
N/A
N/A
15.8
N/A
3.8
N/A
2002
92
62
0.68
N/A
N/A
N/A
20.2
27.9
N/A
N/A
N/A
N/A
15.3
N/A
4.3
1.9
2001
95
88
0.90
N/A
N/A
N/A
19.5
30.1
N/A
N/A
N/A
N/A
15.6
N/A
4.5
N/A
2000
97
110
0.75
N/A
N/A
N/A
19.8
34.2
N/A
N/A
N/A
N/A
N/A
N/A
4.1
N/A
Natural disasters
Type
Metropolitan Government
Columbus
Tornado activity compared to U.S. average
169%
137.4%
Earthquake activity compared to U.S. average
296.3%
132.7%
Natural disasters compared to U.S. average
17%
7%
Transportation
Nashville's public transport is managed by WeGo Public Transit and includes buses and commuter rail services. Columbus's public transportation services, METRA Transit System, cover most of the city, but rely more heavily on personal vehicles for commuting.
Transport
Type
Metropolitan Government
Columbus
Amtrak stations
0
1
Amtrak stations nearby
1
1
FAA registered aircraft
0
85
FAA registered aircraft manufacturers and dealers
0
3
Means of transportation to work
Type
Metropolitan Government
Columbus
Bicycle
0.1%
0.1%
Bus
1.6%
1.1%
Carpooled
13.3%
14.6%
Car alone
78.6%
75.5%
Taxicab
0.1%
0.3%
Walked
2.3%
4.7%
Average travel time to work
Type
Metropolitan Government
Columbus
Average
23.7 min
20.5 min
Real Estate
Nashville's real estate market is significantly pricier, reflecting the city's popularity. Columbus, with its lower housing prices, offers a more affordable housing market for those looking to buy.
Neighborhoods
Nashville has a mix of exciting urban neighborhoods and quiet suburbs, like East Nashville, 12 South, and Brentwood. Columbus features historic, charming neighborhoods like Lakebottom and The Country Club.
Houses and residents
Type
Metropolitan Government
Columbus
Houses
252,977
75,938
Average household size (people)
2.3
2.5
Houses occupied
237,405 (93.8%)
69,597 (91.7%)
Houses occupied by owners
131,384 (55.3%)
39,266 (56.4%)
Houses occupied by renters
106,021 (44.7%)
30,331 (43.6%)
Median rent asked for vacant for-rent units
$1,207
$599.09
Median price asked for vacant for-sale houses and condos
$226,967
$61,168
Estimated median house or condo value
$350,700
$171,106
Median number of rooms in apartments
4.2
4.8
Median number of rooms in houses and condos
6.4
6.6
Housing density (houses/condos per square mile)
503.7
351.4
Household income disparities
45.5%
46.6%
Housing units without a mortgage
32,597 (28.1%)
9,803 (27%)
Housing units with both a second mortgage and home equity loan
342 (0.3%)
91 (0.3%)
Housing units with a mortgage
83,416 (71.9%)
26,511 (73%)
Housing units with a home equity loan
8,009 (6.9%)
2,477 (6.8%)
Housing units with a second mortgage
9,691 (8.4%)
3,939 (10.8%)
Housing units lacking complete kitchen facilities
0.7%
0.8%
Housing units lacking complete plumbing facilities
0.5%
0.5%
Housing units in structures
Housing units in structures
Metropolitan Government
Columbus
One, detached
52.7%
65.5%
One, attached
6.9%
3.1%
Two
6.0%
3.4%
3 or 4
4.0%
6.8%
5 to 9
7.1%
7.5%
10 to 19
9.0%
4.0%
20 to 49
4.6%
2.3%
50 or more
8.0%
3.6%
Mobile homes
1.6%
3.8%
Median real estate property taxes paid for housing units
Self-employed workers in own not incorporated business
20,090
3,992
State government workers
13,081
3,806
Unpaid family workers
668
211
Industries and Occupations
In Nashville, the primary industries are healthcare, education, finance, and music. Columbus leans more towards manufacturing, with companies such as Carmike Cinemas and TSYS having their headquarters there.
Healthcare in Nashville is top-notch, with world-renowned facilities like Vanderbilt University Medical Center. Columbus has several notable healthcare facilities, but the choices are relatively fewer.
Nashville has a more modern infrastructure, with an international airport, a network of highways, and developing public transit systems. Columbus is smaller and traditionally structured, with a regional airport and an effective road network.
Infrastructure
Type
Metropolitan Government
Columbus
TV stations
19
10
Culture and Food
Nashville boasts a dynamic music scene, unique tourist attractions, and a thriving food scene with Southern classics and innovative cuisine. Columbus offers a rich historical culture, Southern hospitality, and traditional Southern cuisine with a modern flare.
Sports Teams
Nashville is home to several professional sports teams such as the Predators (NHL), Titans (NFL), and Nashville SC (MLS). Columbus does not have any professional teams but supports local college sports extensively.
 Metropolitan Government, TN
 Columbus, GA