Dive deep into the comparison of life in Metropolitan Government, Tennessee (TN), often referred to as Nashville or Davidson county, and Kansas City, Missouri (MO). These two vibrant cities offer distinctive qualities across various dimensions such as crime/safety, cost of living, education, work and economy, infrastructure, and more. These cities are appealing for their significant cultural, sports, and economic offerings. However, they present their unique advantages and considerations depending on individual preferences and lifestyle choices.
While both cities experience crime, Metropolitan Government, TN boasts a lower overall crime rate compared to Kansas City, MO. The safety appeal of Metropolitan Government is bolstered by law enforcement initiatives focused on improving community relations and crime prevention. On the other hand, despite its higher crime rate, Kansas City has been implementing numerous strategies to enhance safety, which includes bolstering law enforcement resources and encouraging community involvement in crime prevention efforts.
Cost of Living
Kansas City, MO generally has a lower cost of living compared to Metropolitan Government, TN, comprising various factors such as housing, utilities, groceries, and healthcare. This affordability, combined with the city's entertainment and cultural offerings, makes Kansas City a popular choice for both retirees and young professionals. Despite its higher living costs, Metropolitan Government, TN offers higher average incomes, which somewhat offsets the expenditure.
Income Tax
An important financial consideration is that Metropolitan Government, TN, as part of Tennessee, has no state income tax. In contrast, Missouri levies a state income tax, which adds to the overall tax burden for Kansas City residents.
Property Tax
Property tax rates also vary, with Kansas City, MO generally having higher rates than Metropolitan Government, TN. However, the actual property tax burden will also depend on the specific property values in each city.
Sales Tax
Kansas City, MO has a notably higher overall sales tax rate compared to Metropolitan Government, TN. This aspect can potentially impact your daily living costs and should be factored into the overall cost-of-living comparisons.
Income
Type
Metropolitan Government
Kansas City
Estimated median household income
$65,348
$63,396
Estimated per capita income
$43,994
$36,456
Cost of living index (U.S. average is 100)
97.9
87.3
If you make $50,000 in Kansas City, you will have to make $56,071 in Metropolitan Government to maintain the same standard of living.
Geographical Conditions
Geographically, Kansas City, MO is characterized by its fluctuating terrain of bluffs and broad valleys while Metropolitan Government, TN is known for its rolling hills. Both cities are near major bodies of water, providing numerous recreational opportunities.
Geographical information
Type
Metropolitan Government
Kansas City
Land area
502.3 sq. miles
313.5 sq. miles
Population density
1,236.2 people per sq. mile
1,621.4 people per sq. mile
Relative area comparison
Metropolitan Government, TN Kansas City, MO
Education
Both cities have strong education systems, with numerous public and private schools, along with colleges and universities. However, Metropolitan Government, TN edges out with a higher high-school graduation rate and more residents holding bachelor's degree or higher. Nashville is also home to the renowned Vanderbilt University.
The economy of Metropolitan Government, TN is notably strong and diverse, anchored in industries such as healthcare, music and entertainment, education, and technology. Kansas City, MO also has a robust economy, but it is more focused on sectors like transportation, logistics, financial services, and information technology.
Biggest Employers
The largest employers in Metropolitan Government, TN include Vanderbilt University and Medical Center, Nissan North America, and HCA Healthcare. In contrast, Kansas City, MO's biggest employers are Walmart, Cerner Corporation, and the University of Kansas Hospital.
In Metropolitan Government (Davidson County), 58.5% voted for Democrats and 39.9% for Republicans in 2012 Presidential Election. In Kansas City (Jackson County), 58.9% voted for Democrats and 39.3% for Republicans.
Elections
Type
Democrats
Republicans
Other
Year
Metropolitan Government
Kansas City
Metropolitan Government
Kansas City
Metropolitan Government
Kansas City
2020
65.0%
60.1%
32.6%
38.1%
2.3%
1.8%
2016
60.1%
55.5%
34.1%
38.1%
5.7%
6.4%
2012
58.5%
58.9%
39.9%
39.3%
1.6%
1.7%
2008
60.0%
62.1%
39.0%
36.8%
1.0%
1.1%
2004
54.9%
58.2%
44.6%
41.4%
0.4%
0.4%
2000
57.9%
59.0%
40.4%
38.4%
1.7%
2.5%
1996
79.3%
56.2%
18.1%
34.3%
2.6%
9.5%
Breakdown of population affiliated with a religious congregation
Type
Adherents
Congregations
Religion
Metropolitan Government
Kansas City
Metropolitan Government
Kansas City
SOUTHERN BAPTIST CONVENTION
14.1%
9.5%
19.6%
13.7%
CATHOLIC CHURCH
4.9%
10.3%
2.3%
6.4%
EPISCOPAL CHURCH
1.5%
0.8%
1.8%
1.7%
SEVENTH DAY ADVENTIST CHURCH
1.1%
0.5%
1.7%
1.0%
COPTIC ORTHODOX CHURCH
1.0%
0.0%
0.5%
0.0%
MUSLIM ESTIMATE
0.8%
0.4%
1.4%
1.1%
PRESBYTERIAN CHURCH IN AMERICA
0.8%
0.0%
0.9%
0.1%
CUMBERLAND PRESBYTERIAN CHURCH
0.4%
0.0%
1.3%
0.1%
LUTHERAN CHURCH
0.3%
1.4%
0.9%
1.8%
AMERICAN BAPTIST CHURCHES IN THE USA
0.1%
0.3%
0.3%
1.4%
SALVATION ARMY
0.1%
0.4%
0.5%
0.6%
Weather
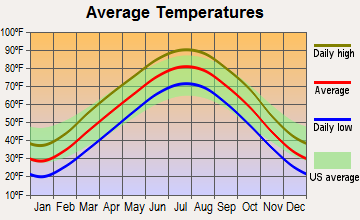
In terms of weather, Kansas City, MO tends to experience more extreme weather patterns, with hot summers and cold winters. The city is also prone to tornadoes. Meanwhile, Metropolitan Government, TN generally has a milder climate, which might be more appealing to people who prefer moderate temperatures. It enjoys four distinct seasons with milder winters compared to Kansas City.
Weather and climate
Type
Metropolitan Government
Kansas City
Temperature - Average
58.4°F
56.2°F
Humidity - Average morning or afternoon humidity
75.9%
76.3%
Humidity - Differences between morning and afternoon humidity
38%
30.1%
Humidity - Maximum monthly morning or afternoon humidity
89%
86%
Humidity - Minimum monthly morning or afternoon humidity
51%
56%
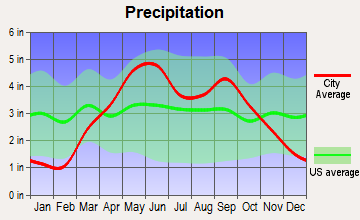
Precipitation - Yearly average
49 in
36.3 in
Snowfall - Yearly average
17.8 in
38 in
Clouds - Number of days clear of clouds
17.1%
20.1%
Sunshine amount - Average
59.7%
67.3%
Sunshine amount - Differences during a year
23%
25.9%
Sunshine amount - Maximum monthly
65%
74%
Sunshine amount - Minimum monthly
42%
48%
Wind speed - Average
7.7 mph
11.2 mph
Average climate in Metropolitan Government, Tennessee
Average climate in Kansas City, Missouri
Air pollution
Type
AQI
CO
NO2
OZONE
PB
PM10
PM25
SO2
Year
Metropolitan Government
Kansas City
Metropolitan Government
Kansas City
Metropolitan Government
Kansas City
Metropolitan Government
Kansas City
Metropolitan Government
Metropolitan Government
Kansas City
Metropolitan Government
Kansas City
Metropolitan Government
Kansas City
2018
71
89
0.40
0.29
13.8
11.1
24.1
29.6
N/A
N/A
15.2
24.5
9.2
7.4
0.2
0.9
2017
70
88
0.38
0.29
14.4
11.6
26.8
30.4
N/A
N/A
15.3
26.7
8.7
10.0
0.1
1.4
2016
90
85
0.42
0.30
16.1
12.0
26.4
28.9
N/A
N/A
N/A
24.9
10.1
9.0
0.0
1.5
2015
68
90
0.43
0.30
15.5
12.9
23.6
28.9
N/A
N/A
N/A
33.6
10.8
8.3
0.1
4.6
2014
66
90
N/A
0.28
N/A
13.0
26.3
28.6
N/A
N/A
N/A
28.5
9.8
9.3
1.4
5.0
2013
62
88
N/A
0.41
N/A
13.2
N/A
29.3
N/A
N/A
N/A
30.8
9.7
10.3
N/A
5.6
2012
81
105
N/A
0.52
N/A
14.2
28.3
31.9
N/A
N/A
N/A
N/A
11.0
10.3
2.3
6.4
2011
81
108
N/A
0.45
N/A
15.0
25.9
29.9
N/A
N/A
N/A
N/A
11.0
10.9
1.7
4.8
2010
80
97
N/A
0.40
N/A
15.0
24.3
27.4
N/A
N/A
N/A
N/A
12.2
11.9
2.2
5.4
2009
72
96
N/A
0.29
N/A
14.8
22.5
28.3
N/A
N/A
N/A
N/A
11.5
9.6
2.4
6.1
2008
81
89
N/A
0.40
N/A
17.0
25.7
25.7
N/A
N/A
N/A
N/A
13.4
11.5
2.5
6.0
2007
99
104
N/A
0.42
N/A
18.4
27.4
29.1
N/A
N/A
N/A
N/A
15.5
13.1
2.7
4.2
2006
93
104
0.69
0.36
N/A
18.5
24.9
29.2
N/A
N/A
N/A
N/A
14.9
12.4
2.9
5.1
2005
104
105
0.56
0.55
N/A
18.3
23.5
28.4
N/A
N/A
N/A
N/A
16.9
N/A
3.1
4.5
2004
83
83
0.61
0.45
N/A
11.6
22.0
26.2
0.006
N/A
N/A
N/A
N/A
N/A
2.6
4.0
2003
93
99
0.67
0.41
N/A
10.9
18.5
28.0
0.005
N/A
N/A
N/A
15.8
N/A
3.8
3.0
2002
92
100
0.68
0.40
N/A
8.9
20.2
27.0
N/A
N/A
N/A
N/A
15.3
N/A
4.3
2.5
2001
95
88
0.90
0.52
N/A
7.9
19.5
27.0
N/A
N/A
N/A
N/A
15.6
N/A
4.5
1.2
2000
97
102
0.75
0.75
N/A
8.8
19.8
29.2
N/A
N/A
N/A
N/A
N/A
N/A
4.1
2.2
Natural disasters
Type
Metropolitan Government
Kansas City
Tornado activity compared to U.S. average
169%
200.4%
Earthquake activity compared to U.S. average
296.3%
598.9%
Natural disasters compared to U.S. average
17%
24%
Transportation
Metropolitan Government, TN and Kansas City, MO offer comprehensive public transit systems, including bus and light rail services. However, like many U.S. cities, the majority of residents in both cities prefer using personal vehicles for commuting. Still, both cities are increasingly investing in public transit and alternative transportation systems to reduce traffic congestion and improve accessibility.
Transport
Type
Metropolitan Government
Kansas City
Amtrak stations
0
1
Amtrak stations nearby
1
3
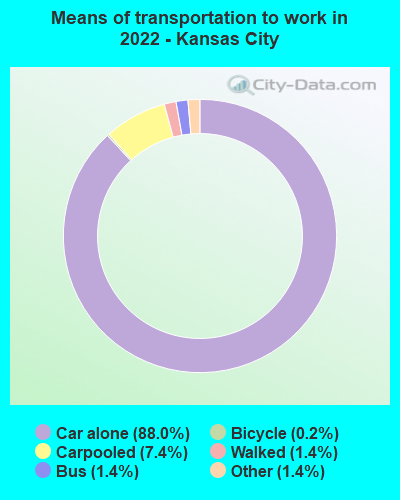
Means of transportation to work
Type
Metropolitan Government
Kansas City
Bicycle
0.1%
0.4%
Bus
1.6%
1.5%
Carpooled
13.3%
8.7%
Car alone
78.6%
86.8%
Taxicab
0.1%
0.2%
Walked
2.3%
1.3%
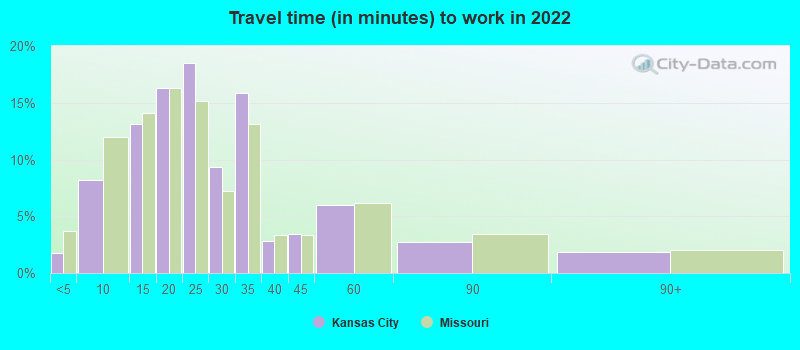
Average travel time to work
Type
Metropolitan Government
Kansas City
Average
23.7 min
25.5 min
Real Estate
Real estate in Kansas City, MO generally tends to be more affordable than Metropolitan Government, TN. However, Metropolitan Government's real estate market is noted for its robust growth and appreciating property values, which can potentially offer higher investment returns.
Neighborhoods
Both cities have a mix of urban, suburban, and rural neighborhoods catering to diverse lifestyle preferences. Notable neighborhoods in Metropolitan Government, TN include trendy East Nashville, affluent Belle Meade, and family-friendly Green Hills. In contrast, Kansas City, MO boasts neighborhoods like the bustling Downtown, artsy Crossroads, and upscale Country Club Plaza.
Houses and residents
Type
Metropolitan Government
Kansas City
Houses
252,977
243,950
Average household size (people)
2.3
2.3
Houses occupied
237,405 (93.8%)
219,020 (89.8%)
Houses occupied by owners
131,384 (55.3%)
118,384 (54.1%)
Houses occupied by renters
106,021 (44.7%)
100,636 (45.9%)
Median rent asked for vacant for-rent units
$1,207
$933.71
Median price asked for vacant for-sale houses and condos
$226,967
$71,644
Estimated median house or condo value
$350,700
$213,400
Median number of rooms in apartments
4.2
4.3
Median number of rooms in houses and condos
6.4
6.6
Housing density (houses/condos per square mile)
503.7
778
Household income disparities
45.5%
43.9%
Housing units without a mortgage
32,597 (28.1%)
1,566 (2%)
Housing units with both a second mortgage and home equity loan
342 (0.3%)
5,650 (7.2%)
Housing units with a mortgage
83,416 (71.9%)
77,422 (98%)
Housing units with a home equity loan
8,009 (6.9%)
403 (0.5%)
Housing units with a second mortgage
9,691 (8.4%)
6,848 (8.7%)
Housing units lacking complete kitchen facilities
0.7%
3.8%
Housing units lacking complete plumbing facilities
Self-employed workers in own not incorporated business
20,090
13,035
State government workers
13,081
6,835
Unpaid family workers
668
197
Industries and Occupations
Kansas City, MO is known as a transportation and logistics powerhouse and has many professionals in this industry. It also has a substantial presence in sectors such as finance, telecommunication, and public administration. Metropolitan Government, TN, has a diverse occupation profile extending across healthcare, education, arts, entertainment, and recreation, among others.
Both cities are known for their excellent healthcare facilities. Metropolitan Government, TN is a major hub for healthcare anchored by Vanderbilt University Medical Center. Kansas City, MO also offers top-notch healthcare institutions like the University of Kansas Hospital and St. Luke's Hospital.
Health (county statistics)
Type
Metropolitan Government
Kansas City
General health status score of residents in this county from 1 (poor) to 5 (excellent)
Infrastructure-wise, both cities offer all the amenities of modern urban living such as utilities, widespread internet access, public facilities, and more. However, Kansas City's midwestern location makes it a crucial transportation and logistics hub. Metropolitan Government, TN, on the other hand, benefits from significant infrastructure investments to support its booming population and business growth.
Infrastructure
Type
Metropolitan Government
Kansas City
TV stations
19
14
Culture and Food
Culturally, both cities are rich, but they have distinctive charms. Metropolitan Government, TN is the heart of country music and offers an exciting nightlife along with a food scene known for hot chicken and barbecue. Kansas City, MO is globally recognized for jazz music and its unique style of barbecue. It offers a blend of cultural influences, making it a dynamic destination for foodies.
Sports Teams
Sports enthusiasts will find something to cheer for in both locations. Kansas City, MO is home to the Chiefs (NFL), Royals (MLB), and Sporting Kansas City (MLS). As for Metropolitan Government, it houses the Titans (NFL), Predators (NHL), and Nashville SC (MLS).

 Metropolitan Government, TN
 Kansas City, MO