Nashville metropolitan government of Tennessee (commonly known as Metro Nashville or simply Metro) and Portland, Oregon, are two vibrant U.S. cities with diverse cultures and economies. Nashville is renowned for its vibrant music scene and Southern hospitality, whereas Portland impresses with its green spaces and array of food and beverage options. While there are some similarities, there are also profound differences based on factors such as cost of living, education, work and economy, and more which will be explored in the subsequent sections.
When it comes to crime and safety, both cities have their challenges. Nashville's crime rate is higher than Portland's, making it slightly less safe. The crime rate in Nashville is higher than the national average, specifically in areas of property crime. However, it varies between neighborhoods, with some areas being safer than others. On the other hand, crime rate in Portland, while still concerning, is lower than Nashville's but is on the rise, especially in relation to property crimes and some areas experience higher rates of crime.
Cost of Living
The cost of living in both cities can command a premium, although Nashville generally has a lower cost of living compared to Portland. This includes costs associated with housing, groceries, health care, and general expenses. However, both cities offer a range of housing options and neighborhoods to choose from, suiting different budgetary needs.
Income Tax
While Portland has both state and local income tax, Tennessee does not have a state income tax, which could make it attractive for higher earners considering relocation.
Property Tax
Both Nashville and Portland have property taxes that fund various community services. Nashville's rates tend to be lower, while Portland's are higher. However, actual amounts can depend on the specific property and neighborhood.
Sales Tax
Sales tax in Nashville is relatively high at nearly 10% including state and local taxation, while Portland doesn't have any sales tax, something that might be attractive for both potential residents and tourists.
Income
Type
Metropolitan Government
Portland
Estimated median household income
$65,348
$79,057
Estimated per capita income
$43,994
$49,003
Cost of living index (U.S. average is 100)
97.9
106.5
If you make $50,000 in Metropolitan Government, you will have to make $54,392 in Portland to maintain the same standard of living.
Geographical Conditions
Geographically, Nashville is located in the southeast, characterized by rolling hills and river valleys, while Portland is situated in the Pacific Northwest, showcasing lush greenery, mountains, and the Oregon coastline.
Geographical information
Type
Metropolitan Government
Portland
Land area
502.3 sq. miles
134.3 sq. miles
Population density
1,236.2 people per sq. mile
4,773.4 people per sq. mile
Relative area comparison
Metropolitan Government, TN Portland, OR
Education
Nashville and Portland both have strong education systems. Nashville is home to top-rated universities like Vanderbilt University and Belmont University, while Portland offers prestigious institutions such as Portland State University and Reed College. Both cities also have numerous quality public and private school options for K-12 students.
Both Nashville and Portland have flourishing economies. Nashville's economy is primarily driven by health care, music, and entertainment industry, while Portland's economy leans on technology, manufacturing, and retail trade sectors. Unemployment rates in both cities are generally on par with the national average, showing robust local economies.
Biggest Employers
Nashville's largest employers encompass a diverse range, from Vanderbilt University and Health Care to Nissan North America. Portland's major employers come from various industries too, including Intel, Providence Health & Services, and Oregon Health & Science University.
In Metropolitan Government (Davidson County), 58.5% voted for Democrats and 39.9% for Republicans in 2012 Presidential Election. In Portland (Multnomah County), 75.4% voted for Democrats and 20.6% for Republicans.
Elections
Type
Democrats
Republicans
Other
Year
Metropolitan Government
Portland
Metropolitan Government
Portland
Metropolitan Government
Portland
2020
65.0%
79.2%
32.6%
17.9%
2.3%
2.9%
2016
60.1%
73.3%
34.1%
17.0%
5.7%
9.7%
2012
58.5%
75.4%
39.9%
20.6%
1.6%
4.0%
2008
60.0%
76.7%
39.0%
20.6%
1.0%
2.7%
2004
54.9%
71.6%
44.6%
27.1%
0.4%
1.3%
2000
57.9%
63.8%
40.4%
28.3%
1.7%
7.9%
1996
79.3%
59.2%
18.1%
26.3%
2.6%
14.4%
Breakdown of population affiliated with a religious congregation
Type
Adherents
Congregations
Religion
Metropolitan Government
Portland
Metropolitan Government
Portland
SOUTHERN BAPTIST CONVENTION
14.1%
0.5%
19.6%
3.8%
CATHOLIC CHURCH
4.9%
15.2%
2.3%
6.7%
EPISCOPAL CHURCH
1.5%
0.7%
1.8%
2.2%
SEVENTH DAY ADVENTIST CHURCH
1.1%
0.9%
1.7%
3.4%
COPTIC ORTHODOX CHURCH
1.0%
0.0%
0.5%
0.2%
MUSLIM ESTIMATE
0.8%
0.3%
1.4%
1.0%
PRESBYTERIAN CHURCH IN AMERICA
0.8%
0.0%
0.9%
0.3%
CUMBERLAND PRESBYTERIAN CHURCH
0.4%
0.0%
1.3%
0.0%
LUTHERAN CHURCH
0.3%
0.4%
0.9%
2.2%
EVANGELICAL LUTHERAN CHURCH IN AMERICA
0.2%
0.9%
0.8%
4.0%
AMERICAN BAPTIST CHURCHES IN THE USA
0.1%
0.8%
0.3%
2.7%
Weather
Weather in Nashville is characterized by hot, humid summers and mild to cool winters with occasional snowfall. In contrast, Portland's climate is cooler and more temperate, with wet, rainy winters and drier, moderately warm summers. Both cities can experience extreme weather events, with Nashville susceptible to tornadoes and Portland at risk of heavy rainstorms and potentially earthquakes due to its proximity to the Cascadia Subduction Zone.
Weather and climate
Type
Metropolitan Government
Portland
Temperature - Average
58.4°F
53.9°F
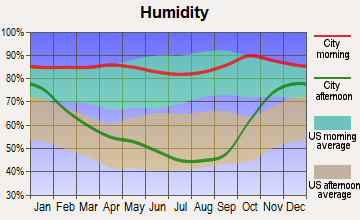
Humidity - Average morning or afternoon humidity
75.9%
76.5%
Humidity - Differences between morning and afternoon humidity
38%
42%
Humidity - Maximum monthly morning or afternoon humidity
89%
86%
Humidity - Minimum monthly morning or afternoon humidity
51%
44%
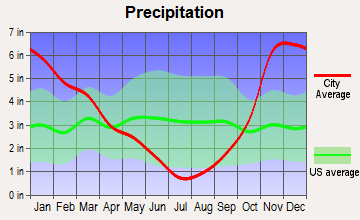
Precipitation - Yearly average
49 in
41.6 in
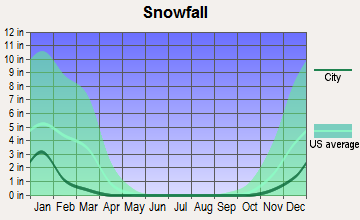
Snowfall - Yearly average
17.8 in
12.8 in
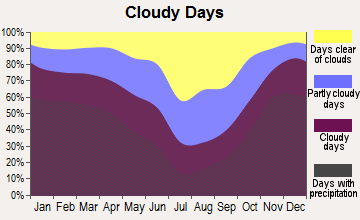
Clouds - Number of days clear of clouds
17.1%
11.3%
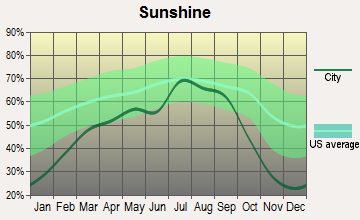
Sunshine amount - Average
59.7%
54.7%
Sunshine amount - Differences during a year
23%
52%
Sunshine amount - Maximum monthly
65%
72%
Sunshine amount - Minimum monthly
42%
20%
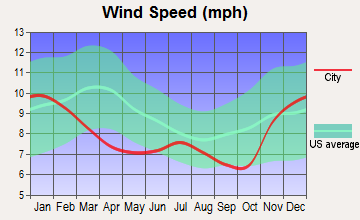
Wind speed - Average
7.7 mph
8.1 mph
Average climate in Metropolitan Government, Tennessee
Average climate in Portland, Oregon
Air pollution
Type
AQI
CO
NO2
OZONE
PB
PM10
PM25
SO2
Year
Metropolitan Government
Portland
Metropolitan Government
Portland
Metropolitan Government
Portland
Metropolitan Government
Portland
Metropolitan Government
Portland
Metropolitan Government
Metropolitan Government
Portland
Metropolitan Government
Portland
2018
71
79
0.40
0.26
13.8
8.8
24.1
21.4
N/A
N/A
15.2
N/A
9.2
7.2
0.2
0.4
2017
70
93
0.38
0.26
14.4
8.7
26.8
22.6
N/A
N/A
15.3
N/A
8.7
7.1
0.1
0.4
2016
90
72
0.42
0.25
16.1
8.7
26.4
20.8
N/A
N/A
N/A
N/A
10.1
5.2
0.0
0.2
2015
68
91
0.43
0.28
15.5
9.2
23.6
20.1
N/A
N/A
N/A
N/A
10.8
7.4
0.1
0.5
2014
66
91
N/A
0.24
N/A
8.5
26.3
21.0
N/A
N/A
N/A
N/A
9.8
6.3
1.4
0.8
2013
62
85
N/A
0.29
N/A
9.6
N/A
17.9
N/A
N/A
N/A
N/A
9.7
8.6
N/A
1.1
2012
81
78
N/A
0.30
N/A
9.1
28.3
21.0
N/A
N/A
N/A
N/A
11.0
7.4
2.3
0.6
2011
81
89
N/A
0.34
N/A
9.4
25.9
18.5
N/A
N/A
N/A
N/A
11.0
8.1
1.7
0.8
2010
80
80
N/A
0.33
N/A
9.1
24.3
19.4
N/A
N/A
N/A
N/A
12.2
6.4
2.2
1.4
2009
72
95
N/A
0.32
N/A
10.2
22.5
20.0
N/A
N/A
N/A
N/A
11.5
8.4
2.4
1.6
2008
81
101
N/A
0.34
N/A
10.9
25.7
19.2
N/A
N/A
N/A
N/A
13.4
8.8
2.5
1.0
2007
99
101
N/A
0.35
N/A
11.4
27.4
18.1
N/A
N/A
N/A
N/A
15.5
8.8
2.7
1.3
2006
93
106
0.69
N/A
N/A
N/A
24.9
N/A
N/A
N/A
N/A
N/A
14.9
7.8
2.9
1.5
2005
104
96
0.56
N/A
N/A
N/A
23.5
N/A
N/A
N/A
N/A
N/A
16.9
8.9
3.1
1.7
2004
83
92
0.61
N/A
N/A
N/A
22.0
N/A
0.006
N/A
N/A
N/A
N/A
9.8
2.6
N/A
2003
93
77
0.67
N/A
N/A
N/A
18.5
N/A
0.005
0.008
N/A
N/A
15.8
8.6
3.8
N/A
2002
92
68
0.68
N/A
N/A
N/A
20.2
N/A
N/A
0.010
N/A
N/A
15.3
8.4
4.3
N/A
2001
95
73
0.90
N/A
N/A
N/A
19.5
N/A
N/A
0.008
N/A
N/A
15.6
8.9
4.5
N/A
2000
97
52
0.75
N/A
N/A
N/A
19.8
N/A
N/A
N/A
N/A
N/A
N/A
N/A
4.1
N/A
Natural disasters
Type
Metropolitan Government
Portland
Tornado activity compared to U.S. average
169%
8.4%
Earthquake activity compared to U.S. average
296.3%
1,575.5%
Natural disasters compared to U.S. average
17%
9%
Transportation
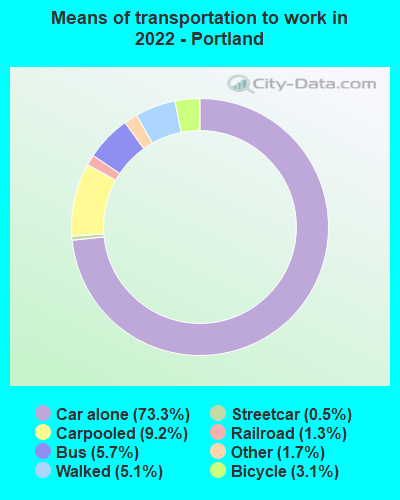
Nashville has a bus system and a commuter rail service, although many residents rely on cars. Portland, however, has an intensive public transit system that includes buses, light rail, and streetcars, making it a more transit-friendly city.
Transport
Type
Metropolitan Government
Portland
Amtrak stations
0
1
Amtrak stations nearby
1
3
FAA registered aircraft
0
804
FAA registered aircraft manufacturers and dealers
0
6
Means of transportation to work
Type
Metropolitan Government
Portland
Bicycle
0.1%
3.1%
Bus
1.6%
4.6%
Carpooled
13.3%
9.4%
Car alone
78.6%
76.2%
Motorcycle
0.1%
0.2%
Railroad
0%
0.9%
Streetcar
0%
0.3%
Taxicab
0.1%
0.1%
Walked
2.3%
3.8%
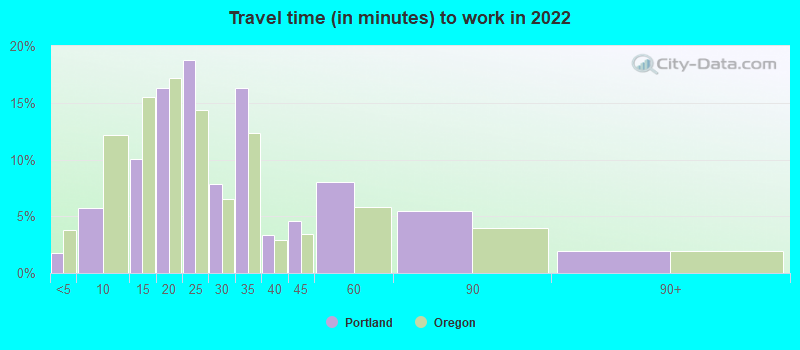
Average travel time to work
Type
Metropolitan Government
Portland
Average
23.7 min
28.8 min
Real Estate
Real estate in both cities can be expensive, although it is generally more affordable in Nashville. Residential properties in posh neighborhoods can command high prices, and the same holds for central business districts. However, there are also areas in both cities where more affordable homes are available.
Neighborhoods
Both cities offer a range of neighborhoods, from bustling urban areas to quieter residential ones. Nashville has popular neighborhoods like East Nashville, Germantown, and The Gulch, while Portland is known for areas such as the Pearl District, Nob Hill, and Hawthorne.
Houses and residents
Type
Metropolitan Government
Portland
Houses
252,977
303,483
Average household size (people)
2.3
2.3
Houses occupied
237,405 (93.8%)
286,734 (94.5%)
Houses occupied by owners
131,384 (55.3%)
153,121 (53.4%)
Houses occupied by renters
106,021 (44.7%)
133,613 (46.6%)
Median rent asked for vacant for-rent units
$1,207
$1,917
Median price asked for vacant for-sale houses and condos
$226,967
$248,225
Estimated median house or condo value
$350,700
$520,200
Median number of rooms in apartments
4.2
3.4
Median number of rooms in houses and condos
6.4
6.2
Housing density (houses/condos per square mile)
503.7
2,259.4
Household income disparities
45.5%
44.7%
Housing units without a mortgage
32,597 (28.1%)
2,404 (2.2%)
Housing units with both a second mortgage and home equity loan
342 (0.3%)
11,239 (10.1%)
Housing units with a mortgage
83,416 (71.9%)
108,864 (97.8%)
Housing units with a home equity loan
8,009 (6.9%)
396 (0.4%)
Housing units with a second mortgage
9,691 (8.4%)
12,832 (11.5%)
Housing units lacking complete kitchen facilities
0.7%
1.2%
Housing units lacking complete plumbing facilities
Self-employed workers in own not incorporated business
20,090
25,437
State government workers
13,081
15,615
Unpaid family workers
668
688
Industries and Occupations
The primary industries in Nashville include health care, music and entertainment, education, and finance. In contrast, manufacturing, technology, and retail trade dominate Portland's economic landscape. While the wider occupations in Nashville revolve around entertainment and health care services, Portland is known for its tech jobs and skilled labor opportunities.
Health care in both cities is top-notch. Nashville is the home to many hospitals, including the well-regarded Vanderbilt University Medical Center. Portland also has several top-rated hospitals, with the Oregon Health & Science University Hospital rated high nationally.
Health (county statistics)
Type
Metropolitan Government
Portland
General health status score of residents in this county from 1 (poor) to 5 (excellent)
The infrastructure in both cities is sturdy. Nashville boasts impressive facilities for its renowned music industry, excellent health care facilities, and adequate transport systems. In contrast, Portland has strong infrastructure catering to cycling, public transit, and its bustling food and beverage industries.
Infrastructure
Type
Metropolitan Government
Portland
TV stations
19
18
Culture and Food
Culture and food are highlights for both cities. Nashville is synonymous with country music and Southern comfort food, while Portland is famous for its food trucks, craft beer scene, and eclectic mix of culinary offerings from around the world.
Sports Teams
Sports enthusiasts will find plenty to cheer for in both cities. Nashville has professional football, hockey, and soccer teams. Meanwhile, Portland boasts NBA basketball and MLS soccer, as well as a passionate community of trail runners and cyclists.
 Metropolitan Government, TN
 Portland, OR