Metropolitan Government, also known as Nashville-Davidson, TN, and Raleigh, NC, both offer residents and tourists distinct lifestyles with varying strengths. Comparing safety, weather, job opportunities, cost of living, and other key factors can give potential movers and travelers an idea of what to expect in these cities. Both have unique characteristics that appeal to different preferences and needs, but a comprehensive comparison can highlight their unique features and help one decide which is more suitable.
While no city is without crime, statistics show that Metropolitan Government, TN has a relatively higher crime rate compared to Raleigh, NC. Nashville’s property crime rate is higher, so potential residents and tourists should consider securing accommodations in safer neighborhoods. On the other hand, Raleigh boasts one of the lower crime rates for a U.S. city of its size, making it a relatively safe place to visit or relocate.
Cost of Living
Cost of living significantly varies between the two cities. Metropolitan Government can be more pricey, with higher costs for housing, utilities, and transportation compared to the national average. On the other hand, Raleigh offers a more manageable cost of living with housing expenses being noticeably lower than Nashville.
Income Tax
In Metropolitan Government, residents benefit from no state income tax. Raleigh residents, however, pay a flat state income tax rate.
Property Tax
Property tax rates in Metropolitan Government are higher compared to Raleigh, impacting the overall cost of living.
Sales Tax
The total sales tax rate in Metropolitan Government is higher than in Raleigh. Tennessee has a high state sales tax without state income tax, whereas North Carolina has a moderate sales tax and state income tax.
Income
Type
Metropolitan Government
Raleigh
Estimated median household income
$65,348
$74,612
Estimated per capita income
$43,994
$44,001
Cost of living index (U.S. average is 100)
97.9
95.1
If you make $50,000 in Raleigh, you will have to make $51,472 in Metropolitan Government to maintain the same standard of living.
Geographical Conditions
Metropolitan Government’s terrain encompasses a low basin surrounded by rolling hills. Raleigh features gently rolling hills leading up to the Blue Ridge Mountains to the west and Atlantic coast beaches to the east.
Geographical information
Type
Metropolitan Government
Raleigh
Land area
502.3 sq. miles
114.6 sq. miles
Population density
1,236.2 people per sq. mile
4,093.6 people per sq. mile
Relative area comparison
Metropolitan Government, TN Raleigh, NC
Education
Both cities shine in education. Metropolitan Government hosts multiple universities and colleges, including Vanderbilt University, an internationally recognized research institution. Raleigh, part of the "Research Triangle," is a hub of higher education and research, housing institutions like North Carolina State University and several more in close proximity.
Metropolitan Government is famous for industries like music, healthcare, and education, with many employment opportunities in these sectors. Raleigh's economy, fueled by the tech and healthcare sectors, is robust, resilient, and diverse, creating job opportunities across various fields.
Biggest Employers
In Metropolitan Government, Vanderbilt University and Medical Center is the major employer. In Raleigh, employers like Duke University and Health System, IBM, and WakeMed Health and Hospitals hold large shares of the employment market.
In Metropolitan Government (Davidson County), 58.5% voted for Democrats and 39.9% for Republicans in 2012 Presidential Election. In Raleigh (Wake County), 54.9% voted for Democrats and 43.5% for Republicans.
Elections
Type
Democrats
Republicans
Other
Year
Metropolitan Government
Raleigh
Metropolitan Government
Raleigh
Metropolitan Government
Raleigh
2020
65.0%
62.3%
32.6%
35.9%
2.3%
1.8%
2016
60.1%
57.4%
34.1%
37.2%
5.7%
5.5%
2012
58.5%
54.9%
39.9%
43.5%
1.6%
1.6%
2008
60.0%
56.8%
39.0%
42.3%
1.0%
0.9%
2004
54.9%
48.7%
44.6%
50.9%
0.4%
0.4%
2000
57.9%
46.1%
40.4%
53.2%
1.7%
0.7%
1996
79.3%
45.9%
18.1%
48.2%
2.6%
5.9%
Breakdown of population affiliated with a religious congregation
Type
Adherents
Congregations
Religion
Metropolitan Government
Raleigh
Metropolitan Government
Raleigh
SOUTHERN BAPTIST CONVENTION
14.1%
9.0%
19.6%
22.5%
CATHOLIC CHURCH
4.9%
11.0%
2.3%
2.4%
EPISCOPAL CHURCH
1.5%
1.1%
1.8%
1.8%
SEVENTH DAY ADVENTIST CHURCH
1.1%
0.2%
1.7%
1.0%
COPTIC ORTHODOX CHURCH
1.0%
0.1%
0.5%
0.1%
MUSLIM ESTIMATE
0.8%
1.1%
1.4%
1.0%
PRESBYTERIAN CHURCH IN AMERICA
0.8%
0.2%
0.9%
1.5%
CUMBERLAND PRESBYTERIAN CHURCH
0.4%
0.0%
1.3%
0.0%
LUTHERAN CHURCH
0.3%
0.4%
0.9%
0.6%
EVANGELICAL LUTHERAN CHURCH IN AMERICA
0.2%
0.6%
0.8%
1.1%
AMERICAN BAPTIST CHURCHES IN THE USA
0.1%
0.4%
0.3%
0.6%
Weather
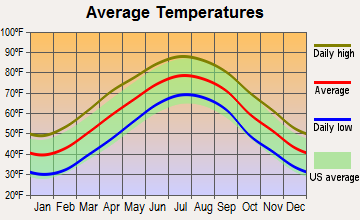
Climate differs in both cities, which can be a deciding factor for those sensitive to certain weather conditions. Metropolitan Government experiences a typically warmer and more humid climate with strong heat in summer, and mild to cool winters. Raleigh, experiencing a subtropical climate, has hot, humid summers, and cool winters with occasional snow.
Weather and climate
Type
Metropolitan Government
Raleigh
Temperature - Average
58.4°F
59.8°F
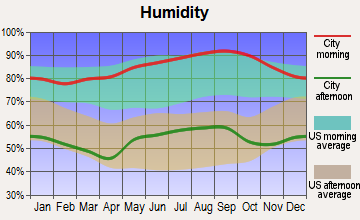
Humidity - Average morning or afternoon humidity
75.9%
73.7%
Humidity - Differences between morning and afternoon humidity
38%
44%
Humidity - Maximum monthly morning or afternoon humidity
89%
90%
Humidity - Minimum monthly morning or afternoon humidity
51%
46%
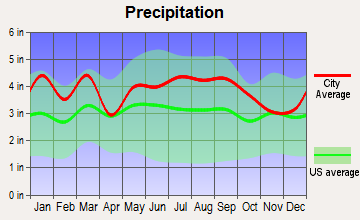
Precipitation - Yearly average
49 in
46.2 in
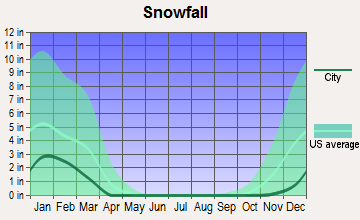
Snowfall - Yearly average
17.8 in
13.4 in
Clouds - Number of days clear of clouds
17.1%
18.5%
Sunshine amount - Average
59.7%
63.9%
Sunshine amount - Differences during a year
23%
13%
Sunshine amount - Maximum monthly
65%
64%
Sunshine amount - Minimum monthly
42%
51%
Wind speed - Average
7.7 mph
7.1 mph
Average climate in Metropolitan Government, Tennessee
Average climate in Raleigh, North Carolina
Air pollution
Type
AQI
CO
NO2
OZONE
PB
PM10
PM25
SO2
Year
Metropolitan Government
Raleigh
Metropolitan Government
Raleigh
Metropolitan Government
Raleigh
Metropolitan Government
Raleigh
Metropolitan Government
Metropolitan Government
Raleigh
Metropolitan Government
Raleigh
Metropolitan Government
Raleigh
2018
71
71
0.40
0.23
13.8
4.9
24.1
27.5
N/A
N/A
15.2
14.6
9.2
9.5
0.2
0.2
2017
70
70
0.38
0.23
14.4
5.5
26.8
25.8
N/A
N/A
15.3
14.7
8.7
9.3
0.1
0.2
2016
90
80
0.42
0.23
16.1
5.6
26.4
26.9
N/A
N/A
N/A
8.7
10.1
10.0
0.0
0.3
2015
68
79
0.43
0.27
15.5
5.7
23.6
28.6
N/A
N/A
N/A
12.4
10.8
11.0
0.1
0.3
2014
66
74
N/A
0.26
N/A
6.0
26.3
29.9
N/A
N/A
N/A
N/A
9.8
11.2
1.4
0.3
2013
62
72
N/A
0.26
N/A
N/A
N/A
26.9
N/A
N/A
N/A
N/A
9.7
10.7
N/A
0.4
2012
81
80
N/A
0.28
N/A
N/A
28.3
29.7
N/A
N/A
N/A
N/A
11.0
9.5
2.3
0.6
2011
81
84
N/A
0.27
N/A
N/A
25.9
32.9
N/A
N/A
N/A
N/A
11.0
10.3
1.7
0.7
2010
80
89
N/A
0.30
N/A
N/A
24.3
32.4
N/A
N/A
N/A
N/A
12.2
10.9
2.2
1.0
2009
72
77
N/A
0.30
N/A
N/A
22.5
27.8
N/A
N/A
N/A
N/A
11.5
10.3
2.4
1.0
2008
81
99
N/A
0.36
N/A
N/A
25.7
32.3
N/A
N/A
N/A
N/A
13.4
12.5
2.5
1.4
2007
99
98
N/A
0.40
N/A
N/A
27.4
35.7
N/A
N/A
N/A
N/A
15.5
13.9
2.7
1.2
2006
93
90
0.69
0.44
N/A
N/A
24.9
31.9
N/A
N/A
N/A
N/A
14.9
13.5
2.9
0.9
2005
104
80
0.56
0.38
N/A
N/A
23.5
33.9
N/A
N/A
N/A
N/A
16.9
N/A
3.1
2.5
2004
83
82
0.61
0.40
N/A
N/A
22.0
28.4
0.006
N/A
N/A
N/A
N/A
N/A
2.6
2.6
2003
93
82
0.67
N/A
N/A
N/A
18.5
29.9
0.005
N/A
N/A
N/A
15.8
N/A
3.8
3.0
2002
92
89
0.68
N/A
N/A
N/A
20.2
36.1
N/A
N/A
N/A
N/A
15.3
N/A
4.3
2.6
2001
95
128
0.90
N/A
N/A
N/A
19.5
34.5
N/A
N/A
N/A
N/A
15.6
N/A
4.5
N/A
2000
97
115
0.75
0.64
N/A
N/A
19.8
34.1
N/A
N/A
N/A
N/A
N/A
N/A
4.1
N/A
Natural disasters
Type
Metropolitan Government
Raleigh
Tornado activity compared to U.S. average
169%
95.1%
Earthquake activity compared to U.S. average
296.3%
52.6%
Natural disasters compared to U.S. average
17%
18%
Transportation
Public transit in Metropolitan Government mainly involves buses and trolleys, while Raleigh offers buses, ride-sharing options, and a free downtown circulator, the R-Line.
Transport
Type
Metropolitan Government
Raleigh
Amtrak stations
0
1
Amtrak stations nearby
1
3
FAA registered aircraft
0
499
FAA registered aircraft manufacturers and dealers
0
12
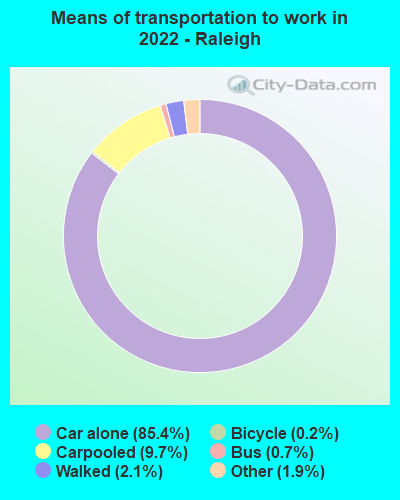
Means of transportation to work
Type
Metropolitan Government
Raleigh
Bicycle
0.1%
0.2%
Bus
1.6%
1.1%
Carpooled
13.3%
8.5%
Car alone
78.6%
87.4%
Motorcycle
0.1%
0.1%
Taxicab
0.1%
0.3%
Walked
2.3%
1.1%
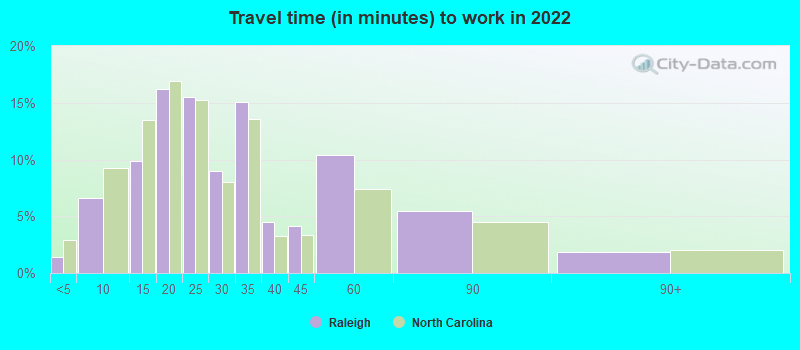
Average travel time to work
Type
Metropolitan Government
Raleigh
Average
23.7 min
29.4 min
Real Estate
Real estate in Metropolitan Government may be challenging due to the high demand and rising prices. In contrast, Raleigh's real estate market offers a wide range of options, from affordable to luxury, and a relatively lower cost of living.
Neighborhoods
Metropolitan Government’s neighborhoods vary, featuring downtown excitement, peaceful suburban areas, and everything in-between. Raleigh, known as "City of Oaks," has scenic, peaceful neighborhoods, along with vibrant city areas like Fayetteville Street.
Houses and residents
Type
Metropolitan Government
Raleigh
Houses
252,977
217,866
Average household size (people)
2.3
2.4
Houses occupied
237,405 (93.8%)
194,917 (89.5%)
Houses occupied by owners
131,384 (55.3%)
103,367 (53%)
Houses occupied by renters
106,021 (44.7%)
91,550 (47%)
Median rent asked for vacant for-rent units
$1,207
$1,740
Median price asked for vacant for-sale houses and condos
$226,967
$302,120
Estimated median house or condo value
$350,700
$340,200
Median number of rooms in apartments
4.2
3.9
Median number of rooms in houses and condos
6.4
6.7
Housing density (houses/condos per square mile)
503.7
1,901.1
Household income disparities
45.5%
45.4%
Housing units without a mortgage
32,597 (28.1%)
1,689 (2.1%)
Housing units with both a second mortgage and home equity loan
342 (0.3%)
6,627 (8.2%)
Housing units with a mortgage
83,416 (71.9%)
78,923 (97.9%)
Housing units with a home equity loan
8,009 (6.9%)
0 (0%)
Housing units with a second mortgage
9,691 (8.4%)
7,783 (9.7%)
Housing units lacking complete kitchen facilities
0.7%
0.6%
Housing units lacking complete plumbing facilities
Self-employed workers in own not incorporated business
20,090
12,488
State government workers
13,081
19,792
Unpaid family workers
668
523
Industries and Occupations
In Nashville, the music industry reigns supreme, along with healthcare, education, and finance. Raleigh has a diverse economic landscape, with strong tech, research, healthcare, and education sectors.
Metropolitan Government has exceptional healthcare, led by Vanderbilt University Medical Center. Raleigh’s healthcare system is also of high standards, with facilities like Duke Health Raleigh Hospital.
Health (county statistics)
Type
Metropolitan Government
Raleigh
General health status score of residents in this county from 1 (poor) to 5 (excellent)
In Metropolitan Government, infrastructural development revolves around its entertainment industry, needing continual investment in infrastructural improvements. In contrast, Raleigh's infrastructure is modern and well-maintained, given the economic importance of the Research Triangle.
Infrastructure
Type
Metropolitan Government
Raleigh
TV stations
19
20
Nuclear power plants nearby
0
1
Culture and Food
Metropolitan Government is known for its vibrant music and food scene, especially hot chicken and barbecue. On the other hand, Raleigh offers a diverse cultural experience with its southern cooking and booming craft beer scene.
Sports Teams
Nashville is home to sports teams like the Tennessee Titans (NFL) and Nashville Predators (NHL). Raleigh hosts teams like the Carolina Panthers (NFL), and Carolina Hurricanes (NHL).
 Metropolitan Government, TN
 Raleigh, NC