In a comparative analysis between living in Metropolitan Government, Tennessee (better known as Nashville), and Tampa, Florida, there are key aspects such as crime/safety, weather, cost of living, and various other factors to consider. Both cities boast a rich culture, have a diverse economy, and offer varying recreational activities. However, aspects like the cost of living, climate, and tax structures vary significantly, which might influence decisions for both potential residents and tourists.
Despite being major cities, both Nashville and Tampa deal with crime rates higher than the national average. While Nashville's crime rate is slightly higher than Tampa's, residents in both cities generally feel safe. Both cities have a robust law enforcement presence and community programs designed to deter crime.
Cost of Living
While the cost of living in both cities is higher than the national average, Tampa is generally more affordable than Nashville. Housing, in particular, is cheaper in Tampa. The grocery prices, utility costs, and gas prices are also moderately lower in Tampa compared to Nashville.
Income Tax
For income tax, Nashville residents reap the benefits of Tennessee's lack of an individual state income tax. However, Florida also doesn't impose a state income tax, making Tampa equally appealing in this regard.
Property Tax
Nashville has a slightly higher property tax rate than Tampa, but the actual tax bill often comes lower due to property values being generally higher in Nashville than in Tampa.
Sales Tax
Sales tax is significant in both cities. Nashville has a combined city and state sales tax rate of 9.75%, while Tampa has a combined rate of 8.5%.
Income
Type
Metropolitan Government
Tampa
Estimated median household income
$65,348
$63,404
Estimated per capita income
$43,994
$43,517
Cost of living index (U.S. average is 100)
97.9
99.8
If you make $50,000 in Metropolitan Government, you will have to make $50,970 in Tampa to maintain the same standard of living.
Geographical Conditions
Nashville lies within the central basin of Tennessee, offering rolling hills and lush greenery. In contrast, Tampa is positioned on Florida's gulf coast, offering beautiful beaches and stunning waterfront views.
Geographical information
Type
Metropolitan Government
Tampa
Land area
502.3 sq. miles
112.1 sq. miles
Population density
1,236.2 people per sq. mile
3,453.8 people per sq. mile
Relative area comparison
Metropolitan Government, TN Tampa, FL
Education
Both cities offer quality education with numerous public and private schools, colleges, and universities. Notably, Nashville is known as the "Athens of the South" due to the high number of educational institutions in the city, including Vanderbilt University. Tampa is home to the University of South Florida and several other reputable institutions.
Nashville and Tampa both have diversified economies, with health care, tourism, and music being a prominent industry in Nashville. Tampa’s economy is primarily driven by industries such as finance, healthcare, insurance, shipping by air and sea, and national defense.
Biggest Employers
The largest employer in Nashville is Vanderbilt University Medical Center. In Tampa, the BayCare Health System employs the highest number of individuals. Both cities have a significant number of jobs in educational institutions, health care facilities, grocery chains, and retail.
In Metropolitan Government (Davidson County), 58.5% voted for Democrats and 39.9% for Republicans in 2012 Presidential Election. In Tampa (Hillsborough County), 53.0% voted for Democrats and 46.3% for Republicans.
Elections
Type
Democrats
Republicans
Other
Year
Metropolitan Government
Tampa
Metropolitan Government
Tampa
Metropolitan Government
Tampa
2020
65.0%
52.9%
32.6%
46.0%
2.3%
1.1%
2016
60.1%
51.2%
34.1%
44.4%
5.7%
4.5%
2012
58.5%
53.0%
39.9%
46.3%
1.6%
0.6%
2008
60.0%
53.4%
39.0%
46.2%
1.0%
0.4%
2004
54.9%
46.4%
44.6%
53.2%
0.4%
0.4%
2000
57.9%
47.2%
40.4%
50.4%
1.7%
2.4%
1996
79.3%
46.8%
18.1%
44.3%
2.6%
8.9%
Breakdown of population affiliated with a religious congregation
Type
Adherents
Congregations
Religion
Metropolitan Government
Tampa
Metropolitan Government
Tampa
SOUTHERN BAPTIST CONVENTION
14.1%
8.3%
19.6%
19.4%
CATHOLIC CHURCH
4.9%
10.7%
2.3%
2.8%
EPISCOPAL CHURCH
1.5%
0.5%
1.8%
1.4%
SEVENTH DAY ADVENTIST CHURCH
1.1%
0.5%
1.7%
2.2%
COPTIC ORTHODOX CHURCH
1.0%
0.1%
0.5%
0.2%
MUSLIM ESTIMATE
0.8%
1.7%
1.4%
1.1%
PRESBYTERIAN CHURCH IN AMERICA
0.8%
0.1%
0.9%
0.7%
CUMBERLAND PRESBYTERIAN CHURCH
0.4%
0.0%
1.3%
0.4%
LUTHERAN CHURCH
0.3%
0.3%
0.9%
1.1%
EVANGELICAL LUTHERAN CHURCH IN AMERICA
0.2%
0.5%
0.8%
1.2%
Weather
Weather drastically differs between Nashville and Tampa. Nashville experiences four distinct seasons, with mildly hot summers and chilly winters. On the other hand, Tampa has a tropical climate with hot summer months and mild winters. Due to being near the Gulf Coast, Tampa is susceptible to hurricanes, particularly from June to November.
Weather and climate
Type
Metropolitan Government
Tampa
Temperature - Average
58.4°F
73.1°F
Humidity - Average morning or afternoon humidity
75.9%
77.6%
Humidity - Differences between morning and afternoon humidity
38%
38%
Humidity - Maximum monthly morning or afternoon humidity
89%
89%
Humidity - Minimum monthly morning or afternoon humidity
51%
51%
Precipitation - Yearly average
49 in
45.6 in
Snowfall - Yearly average
17.8 in
0 in
Clouds - Number of days clear of clouds
17.1%
16.9%
Sunshine amount - Average
59.7%
74.8%
Sunshine amount - Differences during a year
23%
18%
Sunshine amount - Maximum monthly
65%
80%
Sunshine amount - Minimum monthly
42%
62%
Wind speed - Average
7.7 mph
7.4 mph
Average climate in Metropolitan Government, Tennessee
Average climate in Tampa, Florida
Air pollution
Type
AQI
CO
NO2
OZONE
PB
PM10
PM25
SO2
Year
Metropolitan Government
Tampa
Metropolitan Government
Tampa
Metropolitan Government
Tampa
Metropolitan Government
Tampa
Metropolitan Government
Tampa
Metropolitan Government
Tampa
Metropolitan Government
Tampa
Metropolitan Government
Tampa
2018
71
68
0.40
0.16
13.8
N/A
24.1
27.7
N/A
N/A
15.2
18.9
9.2
7.9
0.2
1.1
2017
70
79
0.38
0.17
14.4
N/A
26.8
28.4
N/A
N/A
15.3
20.5
8.7
8.8
0.1
0.6
2016
90
71
0.42
0.17
16.1
N/A
26.4
30.8
N/A
N/A
N/A
20.2
10.1
7.9
0.0
0.8
2015
68
74
0.43
0.15
15.5
N/A
23.6
28.7
N/A
N/A
N/A
19.0
10.8
10.0
0.1
2.2
2014
66
74
N/A
0.16
N/A
N/A
26.3
28.0
N/A
N/A
N/A
20.0
9.8
8.4
1.4
1.6
2013
62
68
N/A
0.16
N/A
N/A
N/A
27.7
N/A
N/A
N/A
20.3
9.7
9.3
N/A
1.4
2012
81
85
N/A
0.17
N/A
N/A
28.3
28.0
N/A
N/A
N/A
21.0
11.0
9.7
2.3
1.0
2011
81
83
N/A
0.18
N/A
N/A
25.9
29.2
N/A
N/A
N/A
20.8
11.0
10.1
1.7
1.2
2010
80
84
N/A
0.25
N/A
N/A
24.3
29.8
N/A
N/A
N/A
21.8
12.2
9.9
2.2
1.3
2009
72
77
N/A
0.27
N/A
N/A
22.5
27.4
N/A
N/A
N/A
21.2
11.5
10.1
2.4
1.5
2008
81
86
N/A
0.18
N/A
4.0
25.7
27.5
N/A
N/A
N/A
23.3
13.4
10.2
2.5
2.4
2007
99
102
N/A
0.31
N/A
5.4
27.4
28.8
N/A
N/A
N/A
26.0
15.5
12.0
2.7
3.3
2006
93
99
0.69
0.42
N/A
6.9
24.9
29.5
N/A
N/A
N/A
25.8
14.9
11.6
2.9
3.0
2005
104
99
0.56
0.45
N/A
6.7
23.5
27.9
N/A
N/A
N/A
25.0
16.9
13.2
3.1
3.0
2004
83
92
0.61
0.40
N/A
7.2
22.0
26.5
0.006
0.004
N/A
25.0
N/A
12.5
2.6
3.2
2003
93
94
0.67
0.42
N/A
N/A
18.5
23.8
0.005
0.004
N/A
23.9
15.8
11.7
3.8
4.4
2002
92
84
0.68
0.38
N/A
N/A
20.2
24.5
N/A
0.006
N/A
24.2
15.3
11.5
4.3
4.9
2001
95
100
0.90
0.44
N/A
N/A
19.5
26.2
N/A
0.012
N/A
24.9
15.6
12.1
4.5
4.7
2000
97
98
0.75
0.48
N/A
N/A
19.8
29.3
N/A
0.020
N/A
26.3
N/A
N/A
4.1
5.1
Natural disasters
Type
Metropolitan Government
Tampa
Tornado activity compared to U.S. average
169%
152.6%
Earthquake activity compared to U.S. average
296.3%
11.1%
Natural disasters compared to U.S. average
17%
25%
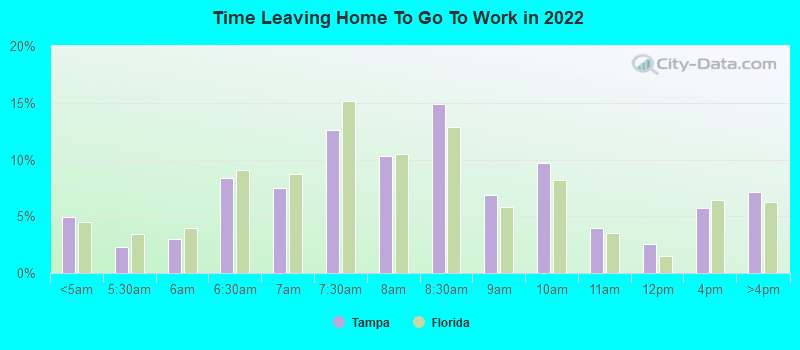
Transportation
When it comes to transportation, both cities have their own public transit systems. Nashville's WeGo Public Transit provides bus service throughout the city, and Tampa's Hillsborough Area Regional Transit (HART) serves the city with bus and streetcar services.
Transport
Type
Metropolitan Government
Tampa
Amtrak stations
0
1
Amtrak stations nearby
1
3
FAA registered aircraft
0
541
FAA registered aircraft manufacturers and dealers
0
78
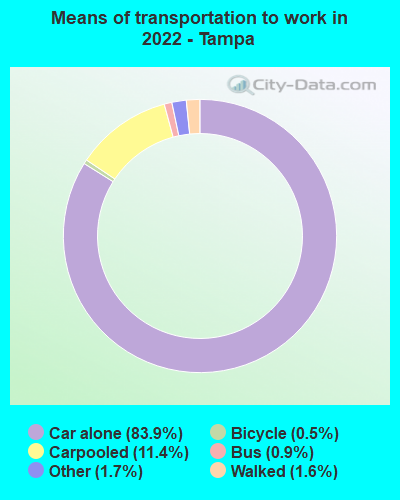
Means of transportation to work
Type
Metropolitan Government
Tampa
Bicycle
0.1%
0.4%
Bus
1.6%
1.1%
Carpooled
13.3%
8.5%
Car alone
78.6%
87%
Motorcycle
0.1%
0.2%
Railroad
0%
0.2%
Taxicab
0.1%
0.1%
Walked
2.3%
1.3%
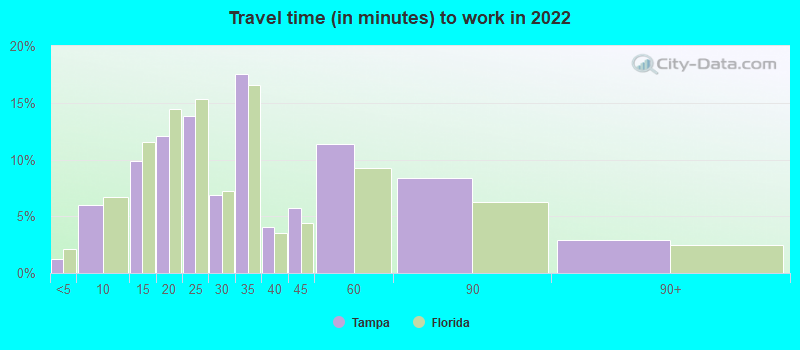
Average travel time to work
Type
Metropolitan Government
Tampa
Average
23.7 min
31.4 min
Real Estate
While the real estate market is robust in both cities, the home values in Tampa are generally lower than in Nashville. Both markets are hot and competitive, with home prices expected to rise in the future.
Neighborhoods
Nashville's neighborhoods like Germantown and East Nashville are known for their vibrancy and historic charm, while Tampa's Hyde Park and Davis Islands are noted for their upscale homes and waterfront views.
Houses and residents
Type
Metropolitan Government
Tampa
Houses
252,977
172,886
Average household size (people)
2.3
2.4
Houses occupied
237,405 (93.8%)
159,925 (92.5%)
Houses occupied by owners
131,384 (55.3%)
84,660 (52.9%)
Houses occupied by renters
106,021 (44.7%)
75,265 (47.1%)
Median rent asked for vacant for-rent units
$1,207
$1,369
Median price asked for vacant for-sale houses and condos
$226,967
$380,334
Estimated median house or condo value
$350,700
$336,200
Median number of rooms in apartments
4.2
3.9
Median number of rooms in houses and condos
6.4
6
Housing density (houses/condos per square mile)
503.7
1,542.7
Household income disparities
45.5%
48.9%
Housing units without a mortgage
32,597 (28.1%)
1,024 (1.9%)
Housing units with both a second mortgage and home equity loan
342 (0.3%)
4,974 (9.2%)
Housing units with a mortgage
83,416 (71.9%)
53,063 (98.1%)
Housing units with a home equity loan
8,009 (6.9%)
110 (0.2%)
Housing units with a second mortgage
9,691 (8.4%)
5,716 (10.6%)
Housing units lacking complete kitchen facilities
0.7%
1.2%
Housing units lacking complete plumbing facilities
Self-employed workers in own not incorporated business
20,090
10,160
State government workers
13,081
6,101
Unpaid family workers
668
602
Industries and Occupations
In Nashville, healthcare, music, and tourism are the primary industries, whereas in Tampa, finance, healthcare, and trade play an essential role. Both cities offer a wide variety of opportunities for professionals in these fields.
In terms of health care, Nashville is home to some of the nation's highest-ranked hospitals, including Vanderbilt University Medical Center. Tampa also boasts well-regarded health care facilities including the Tampa General Hospital.
Health (county statistics)
Type
Metropolitan Government
Tampa
General health status score of residents in this county from 1 (poor) to 5 (excellent)
Both cities offer robust infrastructures with a mix of modern and historic architectures. While Nashville's skyline is highlighted by modern skyscrapers, Tampa boasts a vast number of historic buildings preserved and revitalized to sustain the city's heritage.
Infrastructure
Type
Metropolitan Government
Tampa
TV stations
19
26
Culture and Food
While Nashville is renowned for its country music and Southern cuisine, Tampa is famous for its vibrant nightlife, Cuban culture, and seafood. Both cities offer a variety of cultural experiences and attractions that captivate both residents and tourists.
Sports Teams
Sports fans will find plenty to cheer about in both cities. Nashville houses NFL's Tennessee Titans and NHL's Nashville Predators. Tampa is home to the NFL's Tampa Bay Buccaneers, NHL's Tampa Bay Lightning, and MLB's Tampa Bay Rays.
 Metropolitan Government, TN
 Tampa, FL