Metropolitan Government, Tennessee, and Tucson, Arizona, differ significantly across several essential factors such as crime and safety, weather, and cost of living. The two cities also offer different education opportunities and economic potentials. Each location has its attractions, and your choice will ultimately depend on your personal preferences, lifestyle, and needs.
When comparing Metropolitan Government, TN, and Tucson, AZ in terms of crime and safety, both cities have areas of concern. Crime rates in Metropolitan Government have been higher than the national average, although safer neighborhoods exist. Tucson also confronts issues with crime, especially property crime. Regardless, proactive efforts from local law enforcement agencies are ongoing in both cities to increase safety.
Cost of Living
The cost of living in the Metropolitan Government area is slightly below the national average, making it an affordable option for many families and individuals. However, Tucson offers an even lower cost of living with affordable housing, food, and transportation costs, making it an attractive option for those seeking to stretch their dollars further.
Income Tax
In the matter of income tax, Tennessee does not impose a state income tax, which is financially beneficial for Metropolitan Government residents. Arizona, however, levies a state income tax, which impacts Tucson residents.
Property Tax
In terms of property taxes, both cities are relatively high compared to the national average. Metropolitan Government's property tax rate is considered high for the state of Tennessee. Tucson's property taxes are also high, particularly for the state of Arizona.
Sales Tax
For sales tax, Tennessee's state rates are higher, with Metropolitan Government adding its local tax, making the combined rate quite significant. In contrast, Tucson has a lower state rate, but when combined with local city taxes, the total rate is still relatively high.
Income
Type
Metropolitan Government
Tucson
Estimated median household income
$65,348
$50,306
Estimated per capita income
$43,994
$27,821
Cost of living index (U.S. average is 100)
97.9
90.1
If you make $50,000 in Tucson, you will have to make $54,329 in Metropolitan Government to maintain the same standard of living.
Geographical Conditions
The geographical conditions are also strikingly different. Metropolitan Government is characterized by rolling hills and abundant greenery, while Tucson sits in the Sonoran Desert surrounded by stunning mountain ranges.
Geographical information
Type
Metropolitan Government
Tucson
Land area
502.3 sq. miles
194.7 sq. miles
Population density
1,236.2 people per sq. mile
2,790.5 people per sq. mile
Relative area comparison
Metropolitan Government, TN Tucson, AZ
Education
Both Metropolitan Government and Tucson boast a variety of quality educational institutions. Selma, Metropolitan's largest city, is home to several public and private universities and technical colleges, providing a broad range of studies. Tucson houses the University of Arizona, one of the nation's top public universities, along with numerous public and private schools.
Metropolitan Government's economy is diverse, with significant sectors including healthcare, music, publishing, banking, technology, and higher education. Tucson's economy, on the other hand, is dominated by the University of Arizona, Davis-Monthan Air Force Base, and industries such as healthcare, education, and tourism.
Biggest Employers
In Metropolitan Government, some of the largest employers are Vanderbilt University, Nissan North America, and HCA Healthcare. Tucson’s largest employers include the University of Arizona, TMC HealthCare, and Raytheon Missile Systems.
In Metropolitan Government (Davidson County), 58.5% voted for Democrats and 39.9% for Republicans in 2012 Presidential Election. In Tucson (Pima County), 52.7% voted for Democrats and 45.7% for Republicans.
Elections
Type
Democrats
Republicans
Other
Year
Metropolitan Government
Tucson
Metropolitan Government
Tucson
Metropolitan Government
Tucson
2020
65.0%
58.4%
32.6%
39.8%
2.3%
1.7%
2016
60.1%
53.3%
34.1%
39.7%
5.7%
7.0%
2012
58.5%
52.7%
39.9%
45.7%
1.6%
1.6%
2008
60.0%
52.4%
39.0%
46.3%
1.0%
1.4%
2004
54.9%
52.7%
44.6%
46.7%
0.4%
0.6%
2000
57.9%
51.4%
40.4%
43.3%
1.7%
5.3%
1996
79.3%
52.2%
18.1%
39.4%
2.6%
8.5%
Breakdown of population affiliated with a religious congregation
Type
Adherents
Congregations
Religion
Metropolitan Government
Tucson
Metropolitan Government
Tucson
SOUTHERN BAPTIST CONVENTION
14.1%
2.3%
19.6%
10.4%
CATHOLIC CHURCH
4.9%
20.8%
2.3%
7.9%
EPISCOPAL CHURCH
1.5%
0.8%
1.8%
1.4%
SEVENTH DAY ADVENTIST CHURCH
1.1%
0.3%
1.7%
1.9%
COPTIC ORTHODOX CHURCH
1.0%
0.0%
0.5%
0.2%
MUSLIM ESTIMATE
0.8%
0.0%
1.4%
0.2%
PRESBYTERIAN CHURCH IN AMERICA
0.8%
0.2%
0.9%
0.6%
CUMBERLAND PRESBYTERIAN CHURCH
0.4%
0.0%
1.3%
0.2%
LUTHERAN CHURCH
0.3%
0.4%
0.9%
1.4%
EVANGELICAL LUTHERAN CHURCH IN AMERICA
0.2%
0.9%
0.8%
2.5%
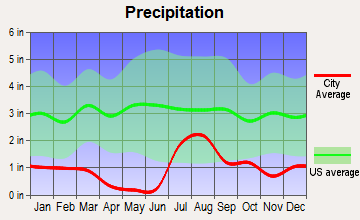
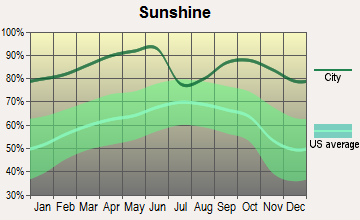
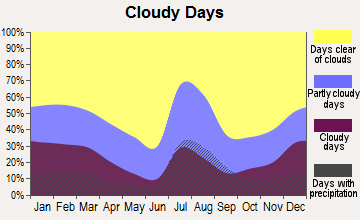
Weather
Weather is one aspect where these two cities vary greatly. Tucson has a hot desert climate, with mild winters and extremely hot summers, making it suitable for those who enjoy a hot, dry environment. Metropolitan Government, on the other hand, features a humid subtropical climate characterized by hot summers and cool winters, with a high amount of rainfall throughout the year.
Weather and climate
Type
Metropolitan Government
Tucson
Temperature - Average
58.4°F
70°F
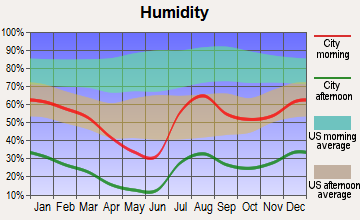
Humidity - Average morning or afternoon humidity
75.9%
38.6%
Humidity - Differences between morning and afternoon humidity
38%
46%
Humidity - Maximum monthly morning or afternoon humidity
89%
58%
Humidity - Minimum monthly morning or afternoon humidity
51%
12%
Precipitation - Yearly average
49 in
12 in
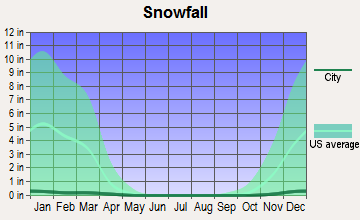
Snowfall - Yearly average
17.8 in
2 in
Clouds - Number of days clear of clouds
17.1%
32.3%
Sunshine amount - Average
59.7%
92.8%
Sunshine amount - Differences during a year
23%
15%
Sunshine amount - Maximum monthly
65%
94%
Sunshine amount - Minimum monthly
42%
79%
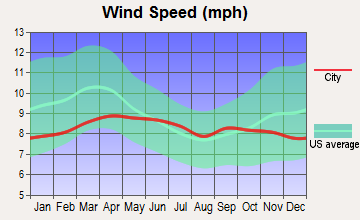
Wind speed - Average
7.7 mph
8.3 mph
Average climate in Metropolitan Government, Tennessee
Average climate in Tucson, Arizona
Air pollution
Type
AQI
CO
NO2
OZONE
PB
PM10
PM25
SO2
Year
Metropolitan Government
Tucson
Metropolitan Government
Tucson
Metropolitan Government
Tucson
Metropolitan Government
Tucson
Metropolitan Government
Metropolitan Government
Tucson
Metropolitan Government
Tucson
Metropolitan Government
Tucson
2018
71
87
0.40
0.19
13.8
8.3
24.1
32.0
N/A
N/A
15.2
29.9
9.2
5.5
0.2
0.1
2017
70
73
0.38
0.18
14.4
8.4
26.8
31.7
N/A
N/A
15.3
32.2
8.7
7.1
0.1
0.1
2016
90
68
0.42
0.21
16.1
7.9
26.4
29.7
N/A
N/A
N/A
25.3
10.1
4.5
0.0
0.1
2015
68
62
0.43
0.21
15.5
8.7
23.6
29.7
N/A
N/A
N/A
25.4
10.8
5.1
0.1
0.2
2014
66
74
N/A
0.19
N/A
10.0
26.3
28.8
N/A
N/A
N/A
28.0
9.8
5.6
1.4
0.2
2013
62
94
N/A
0.17
N/A
10.4
N/A
30.4
N/A
N/A
N/A
30.9
9.7
6.8
N/A
0.2
2012
81
73
N/A
0.20
N/A
11.8
28.3
30.0
N/A
N/A
N/A
31.2
11.0
5.6
2.3
0.2
2011
81
81
N/A
0.22
N/A
11.9
25.9
31.0
N/A
N/A
N/A
29.7
11.0
5.8
1.7
0.3
2010
80
68
N/A
0.29
N/A
10.8
24.3
30.5
N/A
N/A
N/A
25.5
12.2
N/A
2.2
0.5
2009
72
82
N/A
0.25
N/A
11.2
22.5
29.2
N/A
N/A
N/A
31.9
11.5
N/A
2.4
0.5
2008
81
81
N/A
0.29
N/A
12.2
25.7
29.2
N/A
N/A
N/A
32.0
13.4
N/A
2.5
0.9
2007
99
75
N/A
0.37
N/A
13.4
27.4
28.7
N/A
N/A
N/A
27.3
15.5
N/A
2.7
0.9
2006
93
74
0.69
0.41
N/A
15.3
24.9
27.7
N/A
N/A
N/A
17.3
14.9
N/A
2.9
0.6
2005
104
76
0.56
0.43
N/A
15.1
23.5
26.0
N/A
N/A
N/A
17.8
16.9
N/A
3.1
0.7
2004
83
77
0.61
0.49
N/A
15.6
22.0
25.6
0.006
N/A
N/A
14.0
N/A
N/A
2.6
1.2
2003
93
81
0.67
0.57
N/A
17.2
18.5
27.1
0.005
N/A
N/A
19.2
15.8
N/A
3.8
1.2
2002
92
76
0.68
0.56
N/A
16.9
20.2
26.8
N/A
N/A
N/A
19.9
15.3
N/A
4.3
1.0
2001
95
70
0.90
0.55
N/A
16.4
19.5
26.1
N/A
N/A
N/A
23.2
15.6
N/A
4.5
0.8
2000
97
78
0.75
0.50
N/A
16.7
19.8
26.4
N/A
N/A
N/A
N/A
N/A
N/A
4.1
2.3
Natural disasters
Type
Metropolitan Government
Tucson
Tornado activity compared to U.S. average
169%
8.9%
Earthquake activity compared to U.S. average
296.3%
1,584.9%
Natural disasters compared to U.S. average
17%
13%
Transportation
When it comes to public transit, both cities feature extensive bus systems, bicycle-sharing programs, and plenty of roads and highways for commuters. Metropolitan Government also includes commuter trains, and Tucson boasts a modern streetcar system.
Transport
Type
Metropolitan Government
Tucson
Amtrak stations
0
1
Amtrak stations nearby
1
1
FAA registered aircraft
0
983
FAA registered aircraft manufacturers and dealers
0
14
Means of transportation to work
Type
Metropolitan Government
Tucson
Bicycle
0.1%
1%
Bus
1.6%
1.9%
Carpooled
13.3%
11.5%
Car alone
78.6%
81.9%
Motorcycle
0.1%
0.5%
Taxicab
0.1%
0.1%
Walked
2.3%
2.3%
Average travel time to work
Type
Metropolitan Government
Tucson
Average
23.7 min
26 min
Real Estate
As for the real-estate market, Metropolitan Government offers a dynamic market with steady growth. Tucson, on the other hand, is one of the least expensive markets in America. Despite the difference, both cities present opportunities for property investment.
Neighborhoods
Both Metropolitan Government and Tucson feature a mix of neighborhoods, offering something for everyone. Metropolitan Government has upscale neighborhoods like Green Hills and Belle Meade, while Tucson features historic neighborhoods like Barrio Histórico and exclusive areas like Catalina Foothills.
Houses and residents
Type
Metropolitan Government
Tucson
Houses
252,977
242,816
Average household size (people)
2.3
2.4
Houses occupied
237,405 (93.8%)
223,068 (91.9%)
Houses occupied by owners
131,384 (55.3%)
114,708 (51.4%)
Houses occupied by renters
106,021 (44.7%)
108,360 (48.6%)
Median rent asked for vacant for-rent units
$1,207
$801.80
Median price asked for vacant for-sale houses and condos
$226,967
$557,132
Estimated median house or condo value
$350,700
$224,800
Median number of rooms in apartments
4.2
4
Median number of rooms in houses and condos
6.4
5.8
Housing density (houses/condos per square mile)
503.7
1,247.3
Household income disparities
45.5%
44.9%
Housing units without a mortgage
32,597 (28.1%)
1,087 (1.5%)
Housing units with both a second mortgage and home equity loan
342 (0.3%)
2,785 (3.9%)
Housing units with a mortgage
83,416 (71.9%)
70,054 (98.5%)
Housing units with a home equity loan
8,009 (6.9%)
211 (0.3%)
Housing units with a second mortgage
9,691 (8.4%)
4,051 (5.7%)
Housing units lacking complete kitchen facilities
0.7%
1.2%
Housing units lacking complete plumbing facilities
Self-employed workers in own not incorporated business
20,090
14,487
State government workers
13,081
17,981
Unpaid family workers
668
709
Industries and Occupations
The most prevalent industries in Metropolitan Government include healthcare, education, music, and banking. Tucson's dominant industries are education, military, tourism, and healthcare. Both locations offer a wide range of job opportunities, depending upon one's qualifications and experience.
Both Metropolitan Government and Tucson boast top-notch healthcare facilities. Vanderbilt University Medical Center, a highly ranked hospital in Metropolitan Government, and Banner University Medical Center in Tucson are known for their exceptional healthcare services.
Health (county statistics)
Type
Metropolitan Government
Tucson
General health status score of residents in this county from 1 (poor) to 5 (excellent)
Both cities have well-developed infrastructures with a focus on growth and development. Metropolitan Government boasts the well-known Nashville International Airport and an extensive road network. Tucson also offers a well-established transportation network, including Tucson International Airport and Interstate 10.
Infrastructure
Type
Metropolitan Government
Tucson
TV stations
19
20
Culture and Food
Culture and food are areas where both cities shine. Metropolitan Government, particularly Nashville, is known for its rich musical culture and scrumptious southern cuisine. Tucson was named the first UNESCO City of Gastronomy in the United States and boasts a vibrant art scene.
Sports Teams
In terms of sports, Metropolitan Government is home to professional teams like the Tennessee Titans (football) and Nashville Predators (hockey). Tucson does not have any major league sports teams but has a strong collegiate sports scene at the University of Arizona.
 Metropolitan Government, TN
 Tucson, AZ