The cities of Milwaukee, WI, and Raleigh, NC, present unique opportunities and experiences. Both cities offer a blend of urban lifestyle, cultural richness, vibrant economies, and educational opportunities, but they also have their share of challenges. This comparison aims to provide an objective view of what it's like to live or visit each city.
Distance between
Milwaukee, WI and
Raleigh, NC : 703.9 miles
Milwaukee's population is larger by 21%. Its population has decreased by 27,644 people (4.6%) since 2000. The population of Raleigh has grown by 193,031 people (69.9%) during that time.
Milwaukee has a higher crime rate compared to the national average, with violent crimes and property crimes being particular issues. However, crime rates can vary significantly based on neighborhoods. On the other hand, Raleigh has a comparatively lower crime rate and is generally considered safer. Still, vigilance is necessary, particularly in some neighborhoods.
City-data.com crime index counts serious crimes and violent crime more heavily. It adjusts for the number of visitors and daily workers commuting into cities. (higher means more crime, U.S. average = 301.1)
City-data.com crime index counts serious crimes and violent crime more heavily. It adjusts for the number of visitors and daily workers commuting into cities. (higher means more crime, U.S. average = 301.1)
Sex Offenders
According to our data, there are 2,401 registered sex offenders living in Milwaukee and 2,158 registered sex offenders living in . The ratio of residents to sex offenders in Milwaukee is 248 to 1; the ratio in Raleigh is 213 to 1. The number of registered sex offenders compared to the number of residents in Milwaukee is near to than in Raleigh.
Cost of Living
The cost of living in Milwaukee is slightly lower than the national average. Housing costs, in particular, are quite affordable compared to other major cities. In contrast, the cost of living in Raleigh is higher, with housing as the biggest factor in cost differences.
Income Tax
Wisconsin has a progressive income tax system with rates ranging from 4% to 7.65%. North Carolina imposes a flat income tax rate of 5.25%.
Property Tax
The average effective property tax rate in Milwaukee is quite high, around 2.68%, while Raleigh's average rate is significantly lower, at 0.86%.
Sales Tax
Wisconsin's state sales tax is 5%, which is lower than North Carolina's 4.75%. However, with local taxes, the total sales tax rate in Milwaukee ends up around 5.6%, while Raleigh's total sales tax rate is 7.25%.
Income
Type
Milwaukee
Raleigh
Estimated median household income
$46,637
$74,612
Estimated per capita income
$26,998
$44,001
Cost of living index (U.S. average is 100)
97.5
95.1
If you make $50,000 in Raleigh, you will have to make $51,262 in Milwaukee to maintain the same standard of living.
Geographical Conditions
Located on the western shore of Lake Michigan, Milwaukee has a mix of urban and beach landscapes. Raleigh is characterized by rolling hills, lush forests, and numerous green spaces.
Raleigh is home to world-renowned educational institutions, including North Carolina State University. Public schools are high-performing, and there are plenty of private and charter schools too. Milwaukee also has reputable educational facilities. However, it's worth noting that overall, Raleigh's public school performance is consistently higher compared to Milwaukee’s.
Milwaukee's economy is diverse, with major sectors including manufacturing, health care, and food and beverage industries. Raleigh has a healthy economy, largely fueled by technology, healthcare, and education sectors. Both cities boast low unemployment rates and ample job opportunities, but Raleigh’s job market is rated higher.
Biggest Employers
The biggest employers in Milwaukee include Aurora Health Care, Froedtert Health, and Milwaukee Public Schools. In Raleigh, the largest employers are North Carolina State University, IBM, and WakeMed Health Hospitals.
There were 28 building permits issued in Milwaukee in 2012 (103 less than in 2011) compared to 1,354 building permits issued in Raleigh in 2012 (366 more than in 2011).
In Milwaukee (Milwaukee County), 67.8% voted for Democrats and 31.6% for Republicans in 2012 Presidential Election. In Raleigh (Wake County), 54.9% voted for Democrats and 43.5% for Republicans.
Elections
Type
Democrats
Republicans
Other
Year
Milwaukee
Raleigh
Milwaukee
Raleigh
Milwaukee
Raleigh
2020
69.3%
62.3%
29.4%
35.9%
1.3%
1.8%
2016
65.6%
57.4%
28.6%
37.2%
5.8%
5.5%
2012
67.8%
54.9%
31.6%
43.5%
0.5%
1.6%
2008
67.8%
56.8%
31.7%
42.3%
0.5%
0.9%
2004
62.0%
48.7%
37.5%
50.9%
0.5%
0.4%
2000
58.5%
46.1%
37.9%
53.2%
3.6%
0.7%
1996
58.3%
45.9%
32.2%
48.2%
9.5%
5.9%
Breakdown of population affiliated with a religious congregation
Type
Adherents
Congregations
Religion
Milwaukee
Raleigh
Milwaukee
Raleigh
CATHOLIC CHURCH
21.0%
11.0%
10.8%
2.4%
LUTHERAN CHURCH
3.0%
0.4%
5.9%
0.6%
EVANGELICAL LUTHERAN CHURCH IN AMERICA
2.4%
0.6%
6.7%
1.1%
WISCONSIN EVANGELICAL LUTHERAN SYNOD
2.2%
0.0%
6.0%
0.3%
SOUTHERN BAPTIST CONVENTION
1.3%
9.0%
4.3%
22.5%
MUSLIM ESTIMATE
1.0%
1.1%
1.1%
1.0%
AMERICAN BAPTIST CHURCHES IN THE USA
0.7%
0.4%
3.1%
0.6%
EPISCOPAL CHURCH
0.4%
1.1%
1.7%
1.8%
Weather
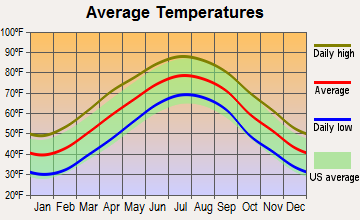
Weather-wise, Milwaukee experiences a four-season climate with cold, snowy winters and warm, humid summers. On the other hand, Raleigh experiences a humid subtropical climate, with hot, muggy summers and cool winters. Some people may prefer the milder winters in Raleigh, while others may be drawn to the snowy winters in Milwaukee.
Weather and climate
Type
Milwaukee
Raleigh
Temperature - Average
48.1°F
59.8°F
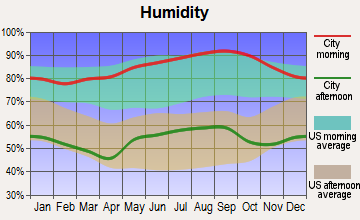
Humidity - Average morning or afternoon humidity
77%
73.7%
Humidity - Differences between morning and afternoon humidity
26%
44%
Humidity - Maximum monthly morning or afternoon humidity
85%
90%
Humidity - Minimum monthly morning or afternoon humidity
59%
46%
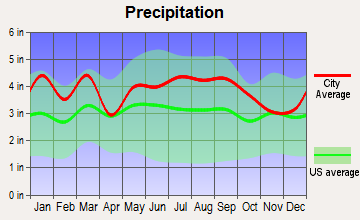
Precipitation - Yearly average
33.3 in
46.2 in
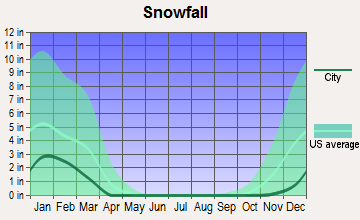
Snowfall - Yearly average
95.8 in
13.4 in
Clouds - Number of days clear of clouds
14.9%
18.5%
Sunshine amount - Average
57.6%
63.9%
Sunshine amount - Differences during a year
34%
13%
Sunshine amount - Maximum monthly
69%
64%
Sunshine amount - Minimum monthly
35%
51%
Wind speed - Average
11 mph
7.1 mph
Average climate in Milwaukee, Wisconsin
Average climate in Raleigh, North Carolina
Air pollution
Type
AQI
CO
NO2
OZONE
PB
PM10
PM25
SO2
Year
Milwaukee
Raleigh
Milwaukee
Raleigh
Milwaukee
Raleigh
Milwaukee
Raleigh
Milwaukee
Milwaukee
Raleigh
Milwaukee
Raleigh
Milwaukee
Raleigh
2018
84
71
N/A
0.23
8.8
4.9
28.2
27.5
N/A
N/A
15.3
14.6
7.8
9.5
0.2
0.2
2017
80
70
N/A
0.23
8.9
5.5
27.7
25.8
N/A
N/A
14.3
14.7
6.9
9.3
0.3
0.2
2016
86
80
N/A
0.23
9.4
5.6
27.0
26.9
N/A
N/A
15.0
8.7
7.4
10.0
1.2
0.3
2015
78
79
N/A
0.27
9.6
5.7
27.2
28.6
N/A
N/A
14.9
12.4
7.8
11.0
1.1
0.3
2014
89
74
N/A
0.26
9.9
6.0
26.0
29.9
N/A
N/A
15.4
N/A
9.2
11.2
1.0
0.3
2013
81
72
N/A
0.26
10.4
N/A
26.9
26.9
N/A
N/A
15.4
N/A
9.6
10.7
0.7
0.4
2012
108
80
N/A
0.28
11.5
N/A
28.3
29.7
N/A
N/A
17.2
N/A
9.6
9.5
1.0
0.6
2011
95
84
N/A
0.27
11.4
N/A
27.3
32.9
N/A
N/A
16.2
N/A
10.1
10.3
1.2
0.7
2010
83
89
N/A
0.30
12.9
N/A
26.9
32.4
N/A
N/A
N/A
N/A
N/A
10.9
N/A
1.0
2009
69
77
N/A
0.30
12.2
N/A
23.7
27.8
N/A
N/A
N/A
N/A
N/A
10.3
N/A
1.0
2008
61
99
N/A
0.36
12.4
N/A
24.6
32.3
N/A
N/A
17.3
N/A
N/A
12.5
N/A
1.4
2007
80
98
N/A
0.40
14.2
N/A
24.1
35.7
N/A
N/A
19.9
N/A
N/A
13.9
N/A
1.2
2006
66
90
0.35
0.44
14.7
N/A
22.8
31.9
0.017
N/A
19.9
N/A
N/A
13.5
2.6
0.9
2005
99
80
0.36
0.38
16.6
N/A
25.1
33.9
0.015
N/A
25.4
N/A
N/A
N/A
3.1
2.5
2004
75
82
0.41
0.40
16.6
N/A
21.2
28.4
0.011
N/A
21.4
N/A
N/A
N/A
3.3
2.6
2003
76
82
0.41
N/A
16.7
N/A
27.1
29.9
0.017
N/A
N/A
N/A
N/A
N/A
3.3
3.0
2002
92
89
0.40
N/A
N/A
N/A
28.9
36.1
0.018
N/A
N/A
N/A
N/A
N/A
3.7
2.6
2001
96
128
0.34
N/A
15.8
N/A
28.3
34.5
0.020
N/A
N/A
N/A
N/A
N/A
3.0
N/A
2000
84
115
0.29
0.64
16.5
N/A
27.0
34.1
0.018
N/A
N/A
N/A
N/A
N/A
3.4
N/A
Natural disasters
Type
Milwaukee
Raleigh
Tornado activity compared to U.S. average
118.1%
95.1%
Earthquake activity compared to U.S. average
109.3%
52.6%
Natural disasters compared to U.S. average
19%
18%
Transportation
Milwaukee operates numerous bus routes and a streetcar service providing connectivity within the city. On the other hand, Raleigh's public transportation relies primarily on buses. Both cities can experience traffic congestion during peak commute times, but Milwaukee generally has less severe traffic.
Transport
Type
Milwaukee
Raleigh
Amtrak stations
1
1
Amtrak stations nearby
1
3
FAA registered aircraft
202
499
FAA registered aircraft manufacturers and dealers
1
12
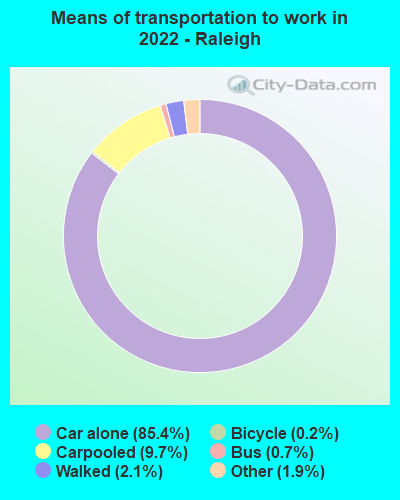
Means of transportation to work
Type
Milwaukee
Raleigh
Bicycle
0.5%
0.2%
Bus
4.2%
1.1%
Carpooled
8.4%
8.5%
Car alone
81.1%
87.4%
Motorcycle
0.1%
0.1%
Taxicab
0.2%
0.3%
Walked
3.9%
1.1%
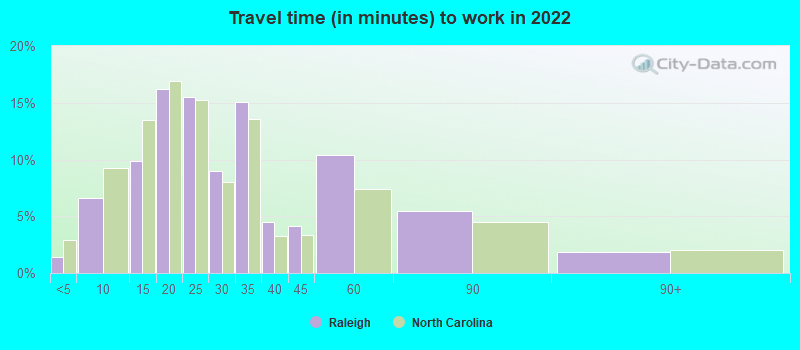
Average travel time to work
Type
Milwaukee
Raleigh
Average
24.2 min
29.4 min
Other means
21.1 min
22.5 min
Public transportation
40.3 min
39.9 min
Private vehicle occupancy
Type
Milwaukee
Raleigh
Average
1.2
1.1
Drove alone
88.7%
90.1%
In 2 person carpool
8.4%
7.6%
In 3 person carpool
1.6%
1.4%
In 4 person carpool
0.7%
0.3%
In 5-6 person carpool
0.4%
0.6%
In 7+ person carpool
0.1%
0.1%
How many people usually rode to work in the car, truck or van.
Real Estate
Real estate in Milwaukee is generally affordable, with diverse options from historic homes to contemporary condos. In Raleigh, home prices are higher, reflecting strong demand buoyed by the city's economic growth and appeal to well-paid professionals.
Neighborhoods
Milwaukee's neighborhoods are rich in character, combining historical influences with modern developments. The Historic Third Ward and Bay View are popular options. In contrast, Raleigh's neighborhoods like North Hills and Wakefield Plantation, offer suburban comfort with city convenience.
Houses and residents
Type
Milwaukee
Raleigh
Houses
257,812
217,866
Average household size (people)
2.5
2.4
Median year apartment built
1956
1995
Median year house/condo built
1952
1995
Length of stay in the house since moving in
14.1 years
11.5 years
Houses occupied
232,362 (90.1%)
194,917 (89.5%)
Houses occupied by owners
96,044 (41.3%)
103,367 (53%)
Houses occupied by renters
136,318 (58.7%)
91,550 (47%)
Median rent asked for vacant for-rent units
$854.05
$1,740
Median monthly housing costs
$965
$1,298
Median price asked for vacant for-sale houses and condos
$172,751
$302,120
Estimated median house or condo value
$160,100
$340,200
Median numbers of rooms
4.9
5.1
Median number of rooms in apartments
4.3
3.9
Median number of rooms in houses and condos
5.7
6.7
Median house price - detached houses
$177,554
$446,507
Median house price - in 2-unit structures
$161,248
$403,968
Median house price - in 3-to-4-unit structures
$178,933
$170,635
Median house price - in 5 or more unit structures
$222,376
$306,998
Median house price - mobile homes
$67,466
$31,622
Median house price - Townhouses or other attached units
$171,473
$292,086
Median house price - All housing units
$176,965
$404,828
Median house age
68
26
Renting percentage
56.4%
46.5%
Housing density (houses/condos per square mile)
2,683.8
1,901.1
House value disparities
33%
30.8%
Household income disparities
46.1%
45.4%
Median household income for houses/condes with a mortgage
$72,490
$114,680
Median household income for apartments without a mortgage
$53,843
$81,716
Housing units without a mortgage
1,800 (2.8%)
1,689 (2.1%)
Housing units with both a second mortgage and home equity loan
3,918 (6.2%)
6,627 (8.2%)
Housing units with a mortgage
61,602 (97.2%)
78,923 (97.9%)
Housing units with a home equity loan
270 (0.4%)
0 (0%)
Housing units with a second mortgage
5,023 (7.9%)
7,783 (9.7%)
House/condo owner moved in on average (years ago)
13
8
House/condo renter moved in on average (years ago)
1
1
Housing units lacking complete kitchen facilities
4.5%
0.6%
Housing units lacking complete plumbing facilities
1.1%
0.5%
Housing units in structures
Housing units in structures
Milwaukee
Raleigh
One, detached
38.9%
45.0%
One, attached
4.5%
14.0%
Two
23.5%
1.2%
3 or 4
6.3%
4.6%
5 to 9
6.3%
6.3%
10 to 19
4.1%
12.4%
20 to 49
6.6%
6.0%
50 or more
9.5%
9.2%
Mobile homes
0.3%
1.2%
Median real estate property taxes paid for housing units
Self-employed workers in own not incorporated business
10,069
12,488
State government workers
7,334
19,792
Unpaid family workers
199
523
Industries and Occupations
In Milwaukee, the most common sectors for employment are healthcare, manufacturing, and retail. In Raleigh, top industries are technology, education, and healthcare. Both cities have seen a growth in tech-related jobs, but the surge is more prominent in Raleigh.
Both cities boast excellent healthcare facilities. However, Milwaukee's larger population and established medical schools give it a slight edge in the quality and diversity of healthcare services available.
Health (county statistics)
Type
Milwaukee
Raleigh
General health status score of residents in this county from 1 (poor) to 5 (excellent)
Milwaukee's urban infrastructure is predominantly influenced by its industrial history. A blend of historic architecture and modern designs characterizes the cityscape. Meanwhile, Raleigh, as part of the Research Triangle, offers state-of-the-art infrastructure geared towards modern industries.
Infrastructure
Type
Milwaukee
Raleigh
Hospitals
29
19
TV stations
17
20
Arenas or stadiums
3
3
Bank branches located here
146
136
Bank institutions located here
29
27
Main business address for public companies
32
21
Nuclear power plants nearby
0
1
Drinking water stations with no reported violations in the past
24
2
Drinking water stations with reported violations in the past
HMDA - Conventional home purchase loans - Applications denied
Year
Milwaukee
Raleigh
1999
1,506
1,618
2000
1,666
890
2001
1,410
557
2002
1,157
510
2003
1,641
564
2004
2,251
700
2005
3,325
1,083
2006
4,218
1,097
2007
2,555
859
2008
719
424
2009
456
253
Culture and Food
Both cities have a vibrant cultural scene. Milwaukee, with its diverse immigrant history, has an eclectic mix of food and culture, with summer festivals being a major highlight. Raleigh, part of the southern US, offers rich historical charm and a delectable southern cuisine tradition.
Sports Teams
Milwaukee has sports teams across several major leagues, including the Milwaukee Bucks (NBA) and the Brewers (MLB). Raleigh is home to the Carolina Hurricanes (NHL), and college sports also hold considerable appeal.


 Milwaukee, WI
 Raleigh, NC