Comparing Nashville-Davidson, Tennessee, to Albuquerque, New Mexico, presents a unique perspective on the diverse array of the American lifestyle experiences. Each city offers different climates, employment opportunities, standards of living, and cultural intricacies. This comparison primarily focuses on both cities' quality of life for potential residents or visitors, examining the areas of crime, weather, the cost of living, education, the economy, infrastructure, predominant industries, primary employers, real estate, neighborhoods, transportation systems, taxes, cultures, and sports teams, just to name a few.
Distance between
Nashville-Davidson, TN and
Albuquerque, NM : 1,114.9 miles
Nashville-Davidson's population is larger by 21%. Its population has grown by 133,327 people (24.4%) since 2000. The population of Albuquerque has grown by 113,992 people (25.4%) during that time.
While both cities have crime rates higher than the national average, Albuquerque's rates are significantly higher than Nashville-Davidson's. Albuquerque struggles particularly with property crime, which is around three times the national average. If safety is a top priority, Nashville-Davidson, with its lower crime rates and active community policing efforts, may be a more suitable choice.
Cost of Living
If you're focused on the cost of living, Albuquerque offers a more affordable lifestyle with a lower cost of living than Nashville-Davidson. Housing is primarily the biggest factor in the variance, with homes in Albuquerque being less expensive than in Nashville-Davidson.
Income Tax
If you're considering income tax, Tennessee has an advantage as it doesn't impose a state income tax, while New Mexico does with rates ranging from 1.7% to 5.9%, depending on income.
Property Tax
Property taxes in both cities are within national averages, but Albuquerque's are slightly lower. Nashville-Davidson's property tax rate is around 0.97% while Albuquerque's is approximately 0.78%.
Sales Tax
In terms of sales tax, Nashville-Davidson residents face a higher rate, with a combined city and state sales tax rate of 9.25%, while Albuquerque residents pay a lower combined rate of 7.88%.
Income
Type
Nashville-Davidson
Albuquerque
Estimated median household income
$64,857
$58,512
Estimated per capita income
$42,268
$35,738
Cost of living index (U.S. average is 100)
90.9
93.6
If you make $50,000 in Nashville-Davidson, you will have to make $51,485 in Albuquerque to maintain the same standard of living.
Geographical Conditions
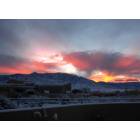
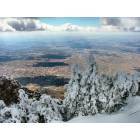
The geographical conditions of these locations contrast greatly — Albuquerque sits high in the desert, offering a variety of outdoor activities, while Nashville-Davidson lies in a basin with picturesque rolling hills.
If education is a significant factor for you, Nashville-Davidson boasts more top-rated schools and is home to prestigious universities such as Vanderbilt University. Conversely, Albuquerque's education system varies widely in quality, with fewer highly rated schools.
When considering economic opportunities, Nashville-Davidson and Albuquerque offer differing industries. Nashville-Davidson enjoys a diverse economy with a dominant healthcare sector, while Albuquerque has a robust science and technology industry, anchored by the presence of Sandia National Laboratories.
Biggest Employers
In Nashville-Davidson, Vanderbilt University, Nissan North America, and HCA Healthcare are among the largest employers. Conversely, the University of New Mexico, Sandia National Laboratories, and Kirtland Air Force Base are key employers in Albuquerque.
There were 3,932 building permits issued in Nashville-Davidson in 2012 (2854 more than in 2011) compared to 773 building permits issued in Albuquerque in 2012 (19 more than in 2011).
In Nashville-Davidson (Davidson County), 58.5% voted for Democrats and 39.9% for Republicans in 2012 Presidential Election. In Albuquerque (Bernalillo County), 55.8% voted for Democrats and 39.4% for Republicans.
Elections
Type
Democrats
Republicans
Other
Year
Nashville-Davidson
Albuquerque
Nashville-Davidson
Albuquerque
Nashville-Davidson
Albuquerque
2020
65.0%
61.3%
32.6%
36.7%
2.3%
2.0%
2016
60.1%
52.4%
34.1%
34.6%
5.7%
13.0%
2012
58.5%
55.8%
39.9%
39.4%
1.6%
4.9%
2008
60.0%
60.2%
39.0%
38.8%
1.0%
1.0%
2004
54.9%
51.6%
44.6%
47.4%
0.4%
0.9%
2000
57.9%
48.8%
40.4%
46.8%
1.7%
4.4%
1996
79.3%
48.3%
18.1%
43.2%
2.6%
8.5%
Breakdown of population affiliated with a religious congregation
Type
Adherents
Congregations
Religion
Nashville-Davidson
Albuquerque
Nashville-Davidson
Albuquerque
SOUTHERN BAPTIST CONVENTION
14.1%
2.6%
19.6%
11.4%
CATHOLIC CHURCH
4.9%
26.5%
2.3%
10.7%
EPISCOPAL CHURCH
1.5%
0.7%
1.8%
1.9%
SEVENTH DAY ADVENTIST CHURCH
1.1%
0.4%
1.7%
1.9%
COPTIC ORTHODOX CHURCH
1.0%
0.0%
0.5%
0.2%
MUSLIM ESTIMATE
0.8%
0.3%
1.4%
0.5%
PRESBYTERIAN CHURCH IN AMERICA
0.8%
0.0%
0.9%
0.5%
CUMBERLAND PRESBYTERIAN CHURCH
0.4%
0.4%
1.3%
0.2%
LUTHERAN CHURCH
0.3%
0.3%
0.9%
1.7%
EVANGELICAL LUTHERAN CHURCH IN AMERICA
0.2%
0.4%
0.8%
1.9%
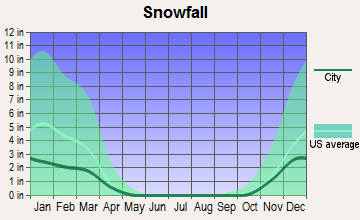
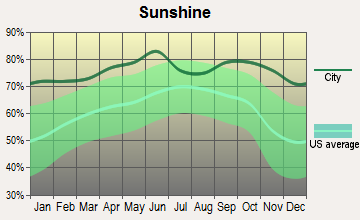
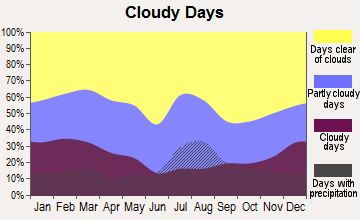
Weather
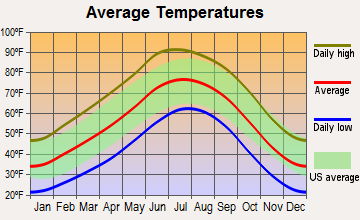
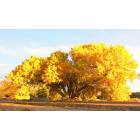
When it comes to weather, Albuquerque and Nashville-Davidson present distinct climates. Albuquerque enjoys over 280 sunny days a year, a dry climate, and milder winters. On the other hand, Nashville-Davidson features a humid subtropical climate with all four seasons, experiencing hot summers and mild to moderately cold winters.
Weather and climate
Type
Nashville-Davidson
Albuquerque
Temperature - Average
58.5°F
55.6°F
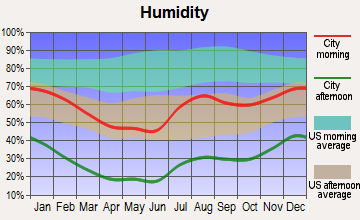
Humidity - Average morning or afternoon humidity
75.9%
44.3%
Humidity - Differences between morning and afternoon humidity
38%
46%
Humidity - Maximum monthly morning or afternoon humidity
89%
63%
Humidity - Minimum monthly morning or afternoon humidity
51%
17%
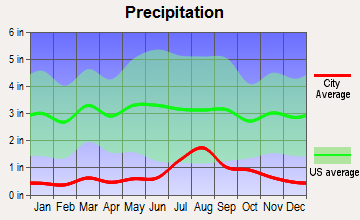
Precipitation - Yearly average
49 in
9.4 in
Snowfall - Yearly average
17.8 in
19.2 in
Clouds - Number of days clear of clouds
17.1%
27.8%
Sunshine amount - Average
59.7%
82.7%
Sunshine amount - Differences during a year
23%
9%
Sunshine amount - Maximum monthly
65%
82%
Sunshine amount - Minimum monthly
42%
73%
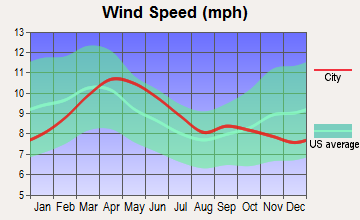
Wind speed - Average
7.7 mph
8.9 mph
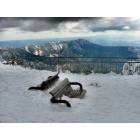
Average climate in Nashville-Davidson, Tennessee
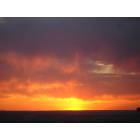
Average climate in Albuquerque, New Mexico
Air pollution
Type
AQI
CO
NO2
OZONE
PB
PM10
PM25
SO2
Year
Nashville-Davidson
Albuquerque
Nashville-Davidson
Albuquerque
Nashville-Davidson
Albuquerque
Nashville-Davidson
Albuquerque
Nashville-Davidson
Albuquerque
Nashville-Davidson
Albuquerque
Nashville-Davidson
Albuquerque
Nashville-Davidson
Albuquerque
2018
71
95
0.40
0.23
13.8
10.3
24.1
35.3
N/A
N/A
15.2
20.3
9.2
4.3
0.2
0.5
2017
70
82
0.38
0.24
14.4
10.4
26.8
33.5
N/A
N/A
15.3
18.4
8.7
5.7
0.1
0.4
2016
90
86
0.42
0.22
16.1
10.4
26.4
33.2
N/A
N/A
N/A
16.0
10.1
5.3
0.0
0.8
2015
68
84
0.43
0.23
15.5
11.2
23.6
30.8
N/A
N/A
N/A
16.0
10.8
6.1
0.1
0.7
2014
66
89
N/A
0.22
N/A
11.7
26.3
31.8
N/A
N/A
N/A
22.0
9.8
6.1
1.4
0.6
2013
62
91
N/A
0.22
N/A
11.8
N/A
34.1
N/A
N/A
N/A
21.8
9.7
5.7
N/A
0.8
2012
81
116
N/A
0.18
N/A
13.7
28.3
33.6
N/A
N/A
N/A
26.6
11.0
9.3
2.3
0.7
2011
81
130
N/A
0.21
N/A
13.5
25.9
34.0
N/A
N/A
N/A
28.6
11.0
9.9
1.7
0.4
2010
80
92
N/A
0.15
N/A
12.2
24.3
32.1
N/A
N/A
N/A
25.1
12.2
6.8
2.2
N/A
2009
72
81
N/A
0.16
N/A
12.5
22.5
30.4
N/A
N/A
N/A
26.2
11.5
6.9
2.4
N/A
2008
81
91
N/A
0.21
N/A
11.8
25.7
31.5
N/A
N/A
N/A
20.8
13.4
6.5
2.5
N/A
2007
99
112
N/A
0.29
N/A
13.0
27.4
31.4
N/A
N/A
N/A
19.7
15.5
6.7
2.7
N/A
2006
93
103
0.69
0.33
N/A
14.2
24.9
31.8
N/A
N/A
N/A
21.1
14.9
N/A
2.9
N/A
2005
104
85
0.56
0.32
N/A
13.9
23.5
29.7
N/A
N/A
N/A
20.0
16.9
N/A
3.1
N/A
2004
83
89
0.61
0.32
N/A
16.6
22.0
29.8
0.006
0.003
N/A
21.5
N/A
N/A
2.6
N/A
2003
93
115
0.67
0.37
N/A
17.6
18.5
31.9
0.005
0.004
N/A
25.1
15.8
N/A
3.8
N/A
2002
92
91
0.67
0.43
N/A
18.9
20.2
29.1
N/A
0.005
N/A
23.1
15.3
N/A
4.3
N/A
2001
95
81
0.89
0.67
N/A
17.2
19.5
29.4
N/A
N/A
N/A
20.9
15.6
N/A
4.5
N/A
2000
97
95
0.74
0.81
N/A
17.0
19.8
27.9
N/A
N/A
N/A
17.7
N/A
N/A
4.1
N/A
Natural disasters
Type
Nashville-Davidson
Albuquerque
Tornado activity compared to U.S. average
169.1%
6.4%
Earthquake activity compared to U.S. average
296.1%
802.6%
Natural disasters compared to U.S. average
17%
9%
Transportation
Both cities have public transit options, but Nashville-Davidson offers a more extensive network. While both cities struggle with traffic, Nashville-Davidson's better public transit options may make commuting easier.
Transport
Type
Nashville-Davidson
Albuquerque
Amtrak stations
0
1
Amtrak stations nearby
1
1
FAA registered aircraft
0
1
FAA registered aircraft manufacturers and dealers
0
17
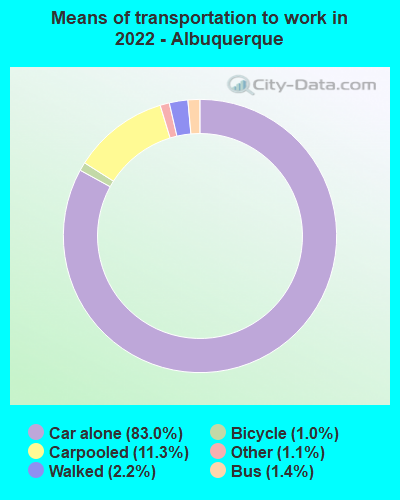
Means of transportation to work
Type
Nashville-Davidson
Albuquerque
Bicycle
0.3%
0.9%
Bus
1.2%
0.8%
Carpooled
9.8%
9.6%
Car alone
85.5%
85.1%
Motorcycle
0.1%
0.2%
Taxicab
0.1%
0%
Walked
1.8%
2.3%
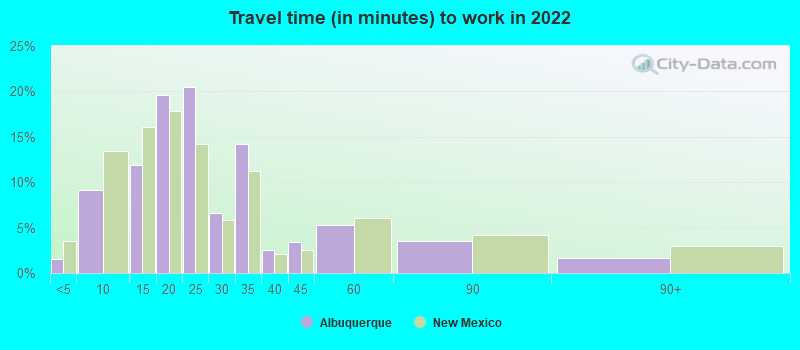
Average travel time to work
Type
Nashville-Davidson
Albuquerque
Average
31.3 min
24.5 min
Other means
23.4 min
20.8 min
Public transportation
38.9 min
37.8 min
Private vehicle occupancy
Type
Nashville-Davidson
Albuquerque
Average
1.2
1.1
Drove alone
88.7%
91.6%
In 2 person carpool
8.5%
6.6%
In 3 person carpool
1.6%
1.2%
In 4 person carpool
0.7%
0.3%
In 5-6 person carpool
0.5%
0.1%
In 7+ person carpool
0%
0.2%
How many people usually rode to work in the car, truck or van.
Real Estate
Looking at the real estate market, Nashville-Davidson's market is hotter, with home values and rental costs significantly higher than in Albuquerque. However, Albuquerque's relatively cheaper housing market may offer more affordable opportunities for newcomers.
Neighborhoods
Nashville-Davidson offers a mix of urban and suburban feel neighborhoods, with many young professionals residing in areas like East Nashville and The Gulch. Meanwhile, Albuquerque's neighborhoods like Nob Hill and North Valley offer a blend of cultural flair and southwestern charm.
Houses and residents
Type
Nashville-Davidson
Albuquerque
Houses
331,262
256,814
Average household size (people)
2.3
2.4
Median year apartment built
1986
1983
Median year house/condo built
1984
1984
Length of stay in the house since moving in
12.2 years
12.6 years
Houses occupied
305,247 (92.1%)
243,582 (94.8%)
Houses occupied by owners
162,426 (53.2%)
147,964 (60.7%)
Houses occupied by renters
142,821 (46.8%)
95,618 (39.3%)
Median rent asked for vacant for-rent units
$1,391
$893.82
Median monthly housing costs
$1,291
$1,021
Median price asked for vacant for-sale houses and condos
$221,129
$171,149
Estimated median house or condo value
$346,700
$251,500
Median numbers of rooms
5.2
5.3
Median number of rooms in apartments
4.2
3.9
Median number of rooms in houses and condos
6.3
6.2
Median house price - detached houses
$437,686
$290,578
Median house price - in 2-unit structures
$320,904
$636,758
Median house price - in 3-to-4-unit structures
$319,119
$274,794
Median house price - in 5 or more unit structures
$305,249
$224,872
Median house price - mobile homes
$133,346
$52,392
Median house price - Townhouses or other attached units
$328,258
$209,825
Median house price - All housing units
$412,434
$271,083
Median house age
35
38
Renting percentage
44.6%
39.7%
Housing density (houses/condos per square mile)
699.9
1,421.7
House value disparities
31%
29.8%
Household income disparities
45.4%
45.9%
Median household income for houses/condes with a mortgage
$93,092
$87,851
Median household income for apartments without a mortgage
$68,871
$63,195
Housing units without a mortgage
3,189 (2.8%)
1,631 (1.6%)
Housing units with both a second mortgage and home equity loan
10,988 (9.6%)
3,560 (3.6%)
Housing units with a mortgage
110,850 (97.2%)
97,744 (98.4%)
Housing units with a home equity loan
333 (0.3%)
309 (0.3%)
Housing units with a second mortgage
13,192 (11.6%)
6,864 (6.9%)
House/condo owner moved in on average (years ago)
9
11
House/condo renter moved in on average (years ago)
1
1
Housing units lacking complete kitchen facilities
1.3%
1.1%
Housing units lacking complete plumbing facilities
0.5%
0.3%
Housing units in structures
Housing units in structures
Nashville-Davidson
Albuquerque
One, detached
50.9%
61.4%
One, attached
8.4%
6.6%
Two
3.3%
1.0%
3 or 4
3.1%
6.1%
5 to 9
7.1%
4.7%
10 to 19
8.7%
4.7%
20 to 49
5.3%
4.8%
50 or more
11.9%
6.3%
Mobile homes
1.2%
4.2%
Boats, RVs, vans, etc.
0.1%
0.0%
Median real estate property taxes paid for housing units
Self-employed workers in own not incorporated business
31,952
14,060
State government workers
15,693
20,531
Unpaid family workers
463
359
Industries and Occupations
Nashville-Davidson is rooted in healthcare, education, music, banking, and transportation industries. Its diverse economy supports various occupations, attracting all sorts of professionals. Albuquerque is notable for science and technology fields, bolstered by Sandia National Laboratories and Intel.
Healthcare is one of Nashville-Davidson's key industries, thus it offers excellent medical facilities. Albuquerque also has good access to healthcare, with notable institutions such as the University of New Mexico Hospital.
Health (county statistics)
Type
Nashville-Davidson
Albuquerque
General health status score of residents in this county from 1 (poor) to 5 (excellent)
Both cities offer good infrastructure, but Nashville-Davidson stands out due to its better road conditions and access to different transportation modes, including a well-serviced airport, train network, and bus system. Albuquerque has reliable infrastructure but lags in comparison.
HMDA - Conventional home purchase loans - Applications denied
Year
Nashville-Davidson
Albuquerque
1999
2,397
2,651
2000
1,451
1,303
2001
1,130
752
2002
1,075
693
2003
2,231
1,022
2004
2,731
1,729
2005
3,231
2,199
2006
3,720
2,639
2007
2,419
1,575
2008
952
654
2009
532
368
Culture and Food
Culturally, both cities offer distinctive experiences. Nashville-Davidson, known as 'Music City', is a hub for country music and southern cuisine. Albuquerque, on the other hand, boasts an impressive array of Native American, Hispanic, and Latino influences, particularly visible in its culinary scene.
Sports Teams
Nashville-Davidson is home to professional teams in the NFL, NHL, and MLS. Meanwhile, Albuquerque hosts minor league baseball, with no major professional sports teams.


 Nashville-Davidson, TN and
  Albuquerque, NM : 1,114.9 miles