Nashville-Davidson, TN and Arlington, TX are vibrant cities with unique personalities, offering diverse lifestyles to residents and visitors alike. Nashville, known as "Music City," is a hub of art, culture, and music combined with economic prosperity, while Arlington is a sports-centric city with a lower cost of living and a robust economy. The following comparison provides a detailed look at these two cities in terms of crime and safety, weather, cost of living, and other parameters.
Distance between
Nashville-Davidson, TN and
Arlington, TX : 636.3 miles
Nashville-Davidson's population is larger by 73%. Its population has grown by 133,327 people (24.4%) since 2000. The population of Arlington has grown by 59,817 people (18.0%) during that time.
Nashville-Davidson demonstrates a higher crime rate than Arlington, TX. Street crime is a more pervasive issue in Nashville, particularly in downtown neighborhoods. Safety measures in tourist areas and residential neighborhoods need to be practiced. On the other hand, Arlington demonstrates lower crime rates, making it generally safer compared to Nashville. There are community policing efforts active which help ensure the safety of its residents and visitors.
Cost of Living
The overall cost of living in Nashville is relatively higher than in Arlington. Factors affecting this include housing costs and daily expenses. However, there could be potential financial savings as Tennessee doesn't impose an income tax. Arlington, TX generally offers a more affordable cost of living, particularly in housing which is lower than the national average.
Income Tax
Tennessee, including Nashville, does not have a state income tax, which provides potential savings for residents. Texas also does not tax personal income, a benefit shared with Arlington residents.
Property Tax
The property tax rate in Nashville is relatively lower compared to Arlington. However, property values tend to be higher in Nashville, which may offset the lower tax rate.
Sales Tax
Both cities have comparable sales taxes, with Nashville at 9.75% and Arlington at 8.25%. Both rates are relatively high compared to the national average.
Income
Type
Nashville-Davidson
Arlington
Estimated median household income
$64,857
$59,889
Estimated per capita income
$42,268
$31,722
Cost of living index (U.S. average is 100)
90.9
95.9
If you make $50,000 in Nashville-Davidson, you will have to make $52,750 in Arlington to maintain the same standard of living.
Geographical Conditions
Nashville is surrounded by rolling hills and is along the Cumberland River. Arlington is part of the Texas plains, featuring a more urban-suburban combination.
Nashville boasts a competitive education scene, home to top-rated universities such as Vanderbilt University. The public school system has also been undergoing reforms to enhance performance and student engagement. Conversely, Arlington's school system encompasses numerous high-performing districts and is home to the University of Texas at Arlington.
In Nashville, key industries include healthcare, education, and music with a rapidly growing tech sector. Job growth in Nashville has consistently outpaced national averages. Arlington's economy is heavily influenced by the presence of large sports stadiums and boasts a strong manufacturing sector. Job growth in Arlington is also stable.
Biggest Employers
In Nashville, Vanderbilt University and Medical Center, Nissan North America, and Hospital Corporation of America are some of the major employers. Arlington's economy is boosted by major employers including Texas Health Resources, General Motors, and the Arlington Independent School District.
There were 3,932 building permits issued in Nashville-Davidson in 2012 (2854 more than in 2011) compared to 976 building permits issued in Arlington in 2012 (744 more than in 2011).
In Nashville-Davidson (Davidson County), 58.5% voted for Democrats and 39.9% for Republicans in 2012 Presidential Election. In Arlington (Tarrant County), 41.4% voted for Democrats and 57.1% for Republicans.
Elections
Type
Democrats
Republicans
Other
Year
Nashville-Davidson
Arlington
Nashville-Davidson
Arlington
Nashville-Davidson
Arlington
2020
65.0%
49.3%
32.6%
49.1%
2.3%
1.6%
2016
60.1%
43.2%
34.1%
51.8%
5.7%
5.0%
2012
58.5%
41.4%
39.9%
57.1%
1.6%
1.4%
2008
60.0%
43.8%
39.0%
55.5%
1.0%
0.7%
2004
54.9%
37.0%
44.6%
62.5%
0.4%
0.5%
2000
57.9%
36.9%
40.4%
60.9%
1.7%
2.3%
1996
79.3%
41.6%
18.1%
50.9%
2.6%
7.5%
Breakdown of population affiliated with a religious congregation
Type
Adherents
Congregations
Religion
Nashville-Davidson
Arlington
Nashville-Davidson
Arlington
SOUTHERN BAPTIST CONVENTION
14.1%
17.3%
19.6%
33.3%
CATHOLIC CHURCH
4.9%
11.1%
2.3%
1.9%
EPISCOPAL CHURCH
1.5%
0.3%
1.8%
0.8%
SEVENTH DAY ADVENTIST CHURCH
1.1%
0.4%
1.7%
1.6%
COPTIC ORTHODOX CHURCH
1.0%
0.1%
0.5%
0.1%
MUSLIM ESTIMATE
0.8%
2.2%
1.4%
0.9%
PRESBYTERIAN CHURCH IN AMERICA
0.8%
0.1%
0.9%
0.4%
CUMBERLAND PRESBYTERIAN CHURCH
0.4%
0.0%
1.3%
0.3%
LUTHERAN CHURCH
0.3%
0.5%
0.9%
0.9%
Weather
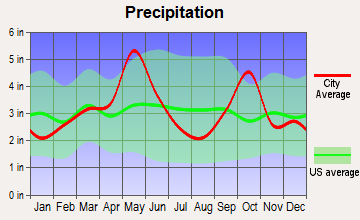
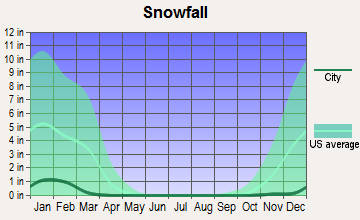
Nashville experiences a humid subtropical climate, with hot summers and mild winters. Snowfall is rarer, making winters generally mild. Arlington also experiences similar weather, but is likely to have more hot days in a year than Nashville. Both cities, however, are likely to experience extreme weather including tornadoes, given their location.
Weather and climate
Type
Nashville-Davidson
Arlington
Temperature - Average
58.5°F
65°F
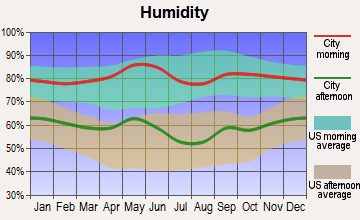
Humidity - Average morning or afternoon humidity
75.9%
71.4%
Humidity - Differences between morning and afternoon humidity
38%
34%
Humidity - Maximum monthly morning or afternoon humidity
89%
82%
Humidity - Minimum monthly morning or afternoon humidity
51%
48%
Precipitation - Yearly average
49 in
37.9 in
Snowfall - Yearly average
17.8 in
4.2 in
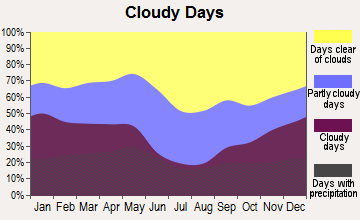
Clouds - Number of days clear of clouds
17.1%
22.7%
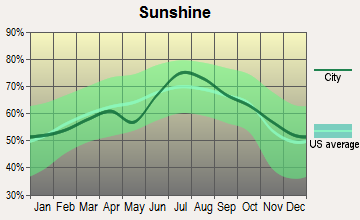
Sunshine amount - Average
59.7%
66.6%
Sunshine amount - Differences during a year
23%
20%
Sunshine amount - Maximum monthly
65%
74%
Sunshine amount - Minimum monthly
42%
54%
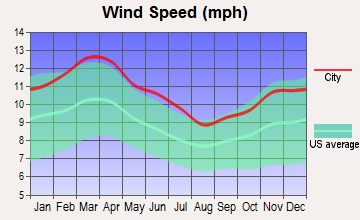
Wind speed - Average
7.7 mph
10.3 mph
Average climate in Nashville-Davidson, Tennessee
Average climate in Arlington, Texas
Air pollution
Type
AQI
CO
NO2
OZONE
PB
PM10
PM25
SO2
Year
Nashville-Davidson
Arlington
Nashville-Davidson
Arlington
Nashville-Davidson
Arlington
Nashville-Davidson
Arlington
Nashville-Davidson
Nashville-Davidson
Nashville-Davidson
Arlington
Nashville-Davidson
Arlington
2018
71
86
0.40
N/A
13.8
5.8
24.1
27.1
N/A
N/A
15.2
N/A
9.2
9.4
0.2
0.4
2017
70
86
0.38
N/A
14.4
6.2
26.8
27.2
N/A
N/A
15.3
N/A
8.7
9.1
0.1
0.3
2016
90
76
0.42
N/A
16.1
6.3
26.4
25.5
N/A
N/A
N/A
N/A
10.1
8.2
0.0
0.2
2015
68
80
0.43
N/A
15.5
6.5
23.6
24.8
N/A
N/A
N/A
N/A
10.8
8.6
0.1
0.3
2014
66
78
N/A
0.22
N/A
6.8
26.3
26.6
N/A
N/A
N/A
N/A
9.8
9.3
1.4
0.3
2013
62
96
N/A
0.25
N/A
6.4
N/A
27.2
N/A
N/A
N/A
N/A
9.7
11.0
N/A
0.2
2012
81
108
N/A
0.26
N/A
7.8
28.3
30.3
N/A
N/A
N/A
N/A
11.0
10.5
2.3
0.3
2011
81
96
N/A
0.23
N/A
8.2
25.9
30.7
N/A
N/A
N/A
N/A
11.0
9.5
1.7
0.6
2010
80
76
N/A
0.23
N/A
8.9
24.3
27.7
N/A
N/A
N/A
N/A
12.2
8.4
2.2
0.7
2009
72
91
N/A
0.25
N/A
8.7
22.5
29.5
N/A
N/A
N/A
N/A
11.5
8.5
2.4
0.5
2008
81
92
N/A
0.25
N/A
9.6
25.7
25.8
N/A
N/A
N/A
N/A
13.4
10.7
2.5
0.5
2007
99
95
N/A
0.30
N/A
10.6
27.4
24.6
N/A
N/A
N/A
N/A
15.5
9.8
2.7
0.5
2006
93
102
0.69
0.34
N/A
10.4
24.9
29.7
N/A
N/A
N/A
N/A
14.9
9.9
2.9
0.8
2005
104
110
0.56
0.34
N/A
11.7
23.5
28.4
N/A
N/A
N/A
N/A
16.9
11.3
3.1
1.0
2004
83
90
0.61
0.39
N/A
10.8
22.0
25.4
0.006
N/A
N/A
N/A
N/A
N/A
2.6
0.9
2003
93
97
0.67
0.40
N/A
11.1
18.5
27.2
0.005
N/A
N/A
N/A
15.8
N/A
3.8
1.0
2002
92
97
0.67
0.37
N/A
11.8
20.2
25.8
N/A
N/A
N/A
N/A
15.3
N/A
4.3
0.6
2001
95
88
0.89
0.48
N/A
14.7
19.5
25.0
N/A
N/A
N/A
N/A
15.6
N/A
4.5
1.1
2000
97
104
0.74
0.55
N/A
14.5
19.8
26.2
N/A
N/A
N/A
N/A
N/A
N/A
4.1
1.3
Natural disasters
Type
Nashville-Davidson
Arlington
Tornado activity compared to U.S. average
169.1%
254.3%
Earthquake activity compared to U.S. average
296.1%
558.3%
Natural disasters compared to U.S. average
17%
23%
Transportation
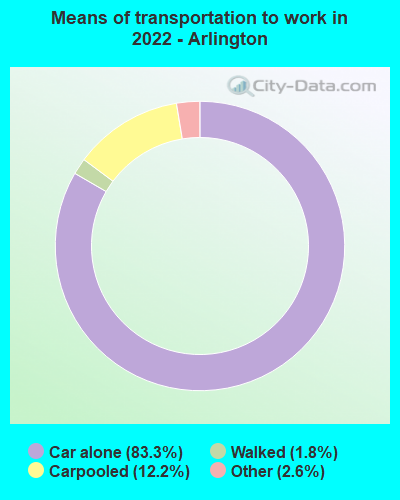
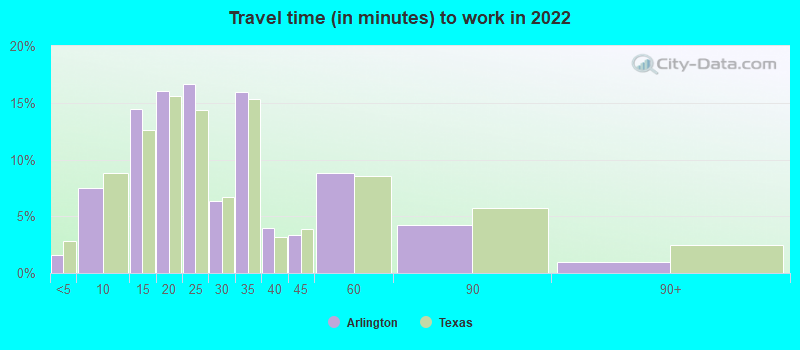
Nashville has been working to expand its public transit, with buses and bike-sharing programs. Commute times in Nashville are relatively longer than Arlington. Arlington offers the Arlington Trolley and Via Rideshare services; however, most residents rely on cars for commuting.
Transport
Type
Nashville-Davidson
Arlington
Amtrak stations nearby
1
2
FAA registered aircraft
0
362
FAA registered aircraft manufacturers and dealers
0
5
Means of transportation to work
Type
Nashville-Davidson
Arlington
Bicycle
0.3%
0.2%
Bus
1.2%
0%
Carpooled
9.8%
11.9%
Car alone
85.5%
85%
Motorcycle
0.1%
0.1%
Taxicab
0.1%
0%
Walked
1.8%
1.4%
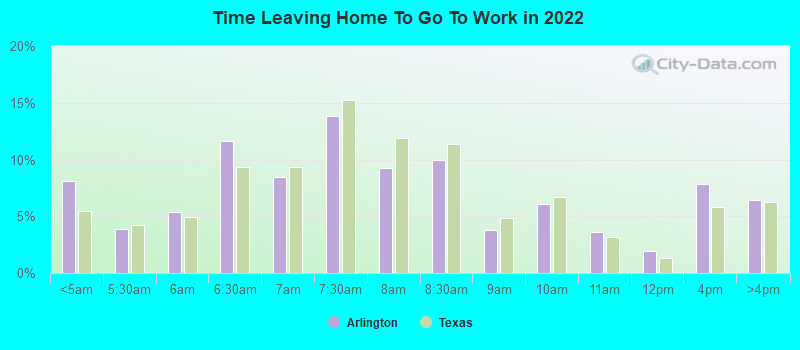
Average travel time to work
Type
Nashville-Davidson
Arlington
Average
31.3 min
26.1 min
Other means
23.4 min
27.6 min
Public transportation
38.9 min
45.1 min
Private vehicle occupancy
Type
Nashville-Davidson
Arlington
Average
1.2
1.2
Drove alone
88.7%
88.7%
In 2 person carpool
8.5%
7.8%
In 3 person carpool
1.6%
2.2%
In 4 person carpool
0.7%
0.8%
In 5-6 person carpool
0.5%
0.4%
How many people usually rode to work in the car, truck or van.
Real Estate
Nashville's real estate market is booming, with higher average home prices compared to Arlington. By contrast, Arlington's real estate market is more affordable with a slower pace of growth.
Neighborhoods
Both cities offer a variety of neighborhoods for every lifestyle. Nashville is known for its vibrant neighborhoods like East Nashville and The Gulch, while Arlington boasts attractive neighborhoods such as Interlochen and Central Arlington.
Houses and residents
Type
Nashville-Davidson
Arlington
Houses
331,262
156,653
Average household size (people)
2.3
2.7
Median year apartment built
1986
1983
Median year house/condo built
1984
1984
Length of stay in the house since moving in
12.2 years
13 years
Houses occupied
305,247 (92.1%)
146,888 (93.8%)
Houses occupied by owners
162,426 (53.2%)
78,883 (53.7%)
Houses occupied by renters
142,821 (46.8%)
68,005 (46.3%)
Median rent asked for vacant for-rent units
$1,391
$1,609
Median monthly housing costs
$1,291
$1,220
Median price asked for vacant for-sale houses and condos
$221,129
$199,415
Estimated median house or condo value
$346,700
$254,700
Median numbers of rooms
5.2
5.4
Median number of rooms in apartments
4.2
4.1
Median number of rooms in houses and condos
6.3
6.5
Median house price - detached houses
$437,686
$265,594
Median house price - in 2-unit structures
$320,904
$415,006
Median house price - in 3-to-4-unit structures
$319,119
$224,044
Median house price - in 5 or more unit structures
$305,249
$131,545
Median house price - mobile homes
$133,346
$92,300
Median house price - Townhouses or other attached units
$328,258
$171,140
Median house price - All housing units
$412,434
$259,527
Median house age
35
37
Renting percentage
44.6%
42.6%
Housing density (houses/condos per square mile)
699.9
1,634.9
House value disparities
31%
25%
Household income disparities
45.4%
43.9%
Median household income for houses/condes with a mortgage
$93,092
$97,883
Median household income for apartments without a mortgage
$68,871
$67,452
Housing units without a mortgage
3,189 (2.8%)
948 (2%)
Housing units with both a second mortgage and home equity loan
10,988 (9.6%)
1,684 (3.6%)
Housing units with a mortgage
110,850 (97.2%)
46,456 (98%)
Housing units with a home equity loan
333 (0.3%)
0 (0%)
Housing units with a second mortgage
13,192 (11.6%)
1,967 (4.1%)
House/condo owner moved in on average (years ago)
9
13
House/condo renter moved in on average (years ago)
1
1
Housing units lacking complete kitchen facilities
1.3%
1.7%
Housing units lacking complete plumbing facilities
0.5%
1%
Housing units in structures
Housing units in structures
Nashville-Davidson
Arlington
One, detached
50.9%
60.2%
One, attached
8.4%
10.8%
Two
3.3%
1.5%
3 or 4
3.1%
4.3%
5 to 9
7.1%
5.7%
10 to 19
8.7%
7.7%
20 to 49
5.3%
3.3%
50 or more
11.9%
5.2%
Mobile homes
1.2%
1.3%
Boats, RVs, vans, etc.
0.1%
0.1%
Median real estate property taxes paid for housing units
Self-employed workers in own not incorporated business
31,952
10,953
State government workers
15,693
6,771
Unpaid family workers
463
396
Industries and Occupations
The health sector dominates in Nashville with large employers such as Vanderbilt University Medical Center. Arlington is known for the aero-defense industry and automobile manufacturing, providing numerous job opportunities.
Nashville, home to renowned medical institutions like Vanderbilt University Medical Center, is a healthcare hotspot. Arlington also offers quality healthcare, with Texas Health Arlington Memorial Hospital recognized for excellence.
Health (county statistics)
Type
Nashville-Davidson
Arlington
General health status score of residents in this county from 1 (poor) to 5 (excellent)
Nashville has seen significant investments in infrastructure in recent years, with a focus on expanding public transit and developing downtown. Arlington also has well-maintained infrastructure, with continuous development of parks, recreation centers, and cultural heritage sites.
HMDA - Conventional home purchase loans - Applications denied
Year
Nashville-Davidson
Arlington
1999
2,397
1,768
2000
1,451
1,198
2001
1,130
1,140
2002
1,075
847
2003
2,231
1,216
2004
2,731
1,504
2005
3,231
2,158
2006
3,720
2,107
2007
2,419
1,390
2008
952
558
2009
532
235
Culture and Food
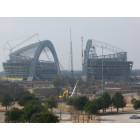
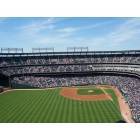
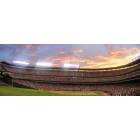
Nashville is famous for its rich cultural scene, particularly focused on the music industry. The local food scene, featuring the iconic "hot chicken," is also a significant draw. Arlington, while having a vibrant culinary scene, puts greater emphasis on sports and recreation, hosting both Dallas Cowboys and Texas Rangers games.
Sports Teams
Nashville has the Tennessee Titans (NFL) and Nashville Predators (NHL). Arlington hosts the Dallas Cowboys (NFL) and the Texas Rangers (MLB).


 Nashville-Davidson, TN and
  Arlington, TX : 636.3 miles