Nashville-Davidson, TN and Atlanta, GA, are well-established and dynamic southern cities in the United States. Known for their vibrant culture, music scenes, and historical importance, each city has unique features that make them both appealing places to live and visit. This article will provide a comparison across various parameters such as crime and safety, weather, cost of living, education, and more to distinguish what makes each city unique in its own right.
Distance between
Nashville-Davidson, TN and
Atlanta, GA : 212.7 miles
Nashville-Davidson's population is larger by 37%. Its population has grown by 133,327 people (24.4%) since 2000. The population of Atlanta has grown by 79,987 people (19.2%) during that time.
The crime rates in both cities are higher compared to the national average, but vary between the two. Nashville's crime rate is 87 per one thousand residents, whereas Atlanta's crime rate is higher at 93 per one thousand residents. Both cities have taken measures to address safety concerns and to mitigate crime rates.
Cost of Living
The cost of living in Atlanta is typically higher than in Nashville, particularly when considering housing costs. However, in terms of everyday expenses like groceries and health care, costs are comparable in both cities.
Income Tax
When it comes to income tax, Tennessee does not levy a state income tax, which may be deemed favorable to some. In contrast, Georgia does impose a state income tax, with brackets ranging from 1% to 5.75%.
Property Tax
In terms of property taxes, rates are slightly higher in Nashville than in Atlanta. Regardless, one's personal experience with property tax will largely depend on the specific property and location.
Sales Tax
Comparatively, Tennessee has a higher sales tax rate than Georgia. Nashville has a 9.25% combined city and state sales tax, while Atlanta has a 7.75% combined rate.
Income
Type
Nashville-Davidson
Atlanta
Estimated median household income
$64,857
$74,107
Estimated per capita income
$42,268
$55,051
Cost of living index (U.S. average is 100)
90.9
104.3
If you make $50,000 in Nashville-Davidson, you will have to make $57,371 in Atlanta to maintain the same standard of living.
Geographical Conditions
Nashville is mostly located on hills, known for its verdant and park-like setting. In contrast, Atlanta is situated in a vast sprawl with skyscrapers, significant hills, and dense tree coverage.
Both cities are home to top-ranking schools and universities. Nashville is renowned for Vanderbilt University, while Atlanta is home to prestigious institutions like Georgia Tech and Emory University. Education in both cities is highly prioritized and well-funded.
Economically speaking, Atlanta has a GDP higher than that of Nashville. Major industries in Atlanta include logistics, professional and business services, media operations, and healthcare, while Nashville's economy is famously driven by music, healthcare, publishing, banking, and transportation industries.
Biggest Employers
In Nashville, the largest employer is Vanderbilt University and Medical Center, while in Atlanta, the largest employer is Delta Air Lines. Both cities also host several Fortune 500 companies.
There were 3,932 building permits issued in Nashville-Davidson in 2012 (2854 more than in 2011) compared to 855 building permits issued in Atlanta in 2012 (628 more than in 2011).
In Nashville-Davidson (Davidson County), 58.5% voted for Democrats and 39.9% for Republicans in 2012 Presidential Election. In Atlanta (Fulton County), 64.3% voted for Democrats and 34.5% for Republicans.
Elections
Type
Democrats
Republicans
Other
Year
Nashville-Davidson
Atlanta
Nashville-Davidson
Atlanta
Nashville-Davidson
Atlanta
2020
65.0%
72.6%
32.6%
26.2%
2.3%
1.2%
2016
60.1%
67.8%
34.1%
26.9%
5.7%
5.3%
2012
58.5%
64.3%
39.9%
34.5%
1.6%
1.2%
2008
60.0%
67.2%
39.0%
32.2%
1.0%
0.6%
2004
54.9%
59.4%
44.6%
40.0%
0.4%
0.7%
2000
57.9%
57.9%
40.4%
39.9%
1.7%
2.2%
1996
79.3%
58.9%
18.1%
36.9%
2.6%
4.1%
Breakdown of population affiliated with a religious congregation
Type
Adherents
Congregations
Religion
Nashville-Davidson
Atlanta
Nashville-Davidson
Atlanta
SOUTHERN BAPTIST CONVENTION
14.1%
7.9%
19.6%
14.7%
CATHOLIC CHURCH
4.9%
9.9%
2.3%
2.4%
EPISCOPAL CHURCH
1.5%
2.1%
1.8%
2.1%
SEVENTH DAY ADVENTIST CHURCH
1.1%
1.2%
1.7%
1.5%
COPTIC ORTHODOX CHURCH
1.0%
0.1%
0.5%
0.1%
MUSLIM ESTIMATE
0.8%
1.4%
1.4%
1.7%
PRESBYTERIAN CHURCH IN AMERICA
0.8%
0.1%
0.9%
1.3%
CUMBERLAND PRESBYTERIAN CHURCH
0.4%
0.0%
1.3%
0.1%
EVANGELICAL LUTHERAN CHURCH IN AMERICA
0.2%
0.6%
0.8%
1.5%
AMERICAN BAPTIST CHURCHES IN THE USA
0.1%
0.8%
0.3%
1.1%
Weather
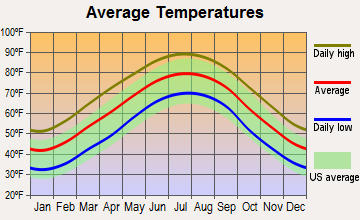
The climate in both cities is classified as humid subtropical, characterized by hot, humid summers and mild winters. Nashville has a slightly more temperate climate, while Atlanta tends to have more warm days. Both cities, however, offer four distinct seasons, which can be appealing to those who enjoy a variety of weather patterns.
Weather and climate
Type
Nashville-Davidson
Atlanta
Temperature - Average
58.5°F
61.7°F
Humidity - Average morning or afternoon humidity
75.9%
73.9%
Humidity - Differences between morning and afternoon humidity
38%
38%
Humidity - Maximum monthly morning or afternoon humidity
89%
87%
Humidity - Minimum monthly morning or afternoon humidity
51%
49%
Precipitation - Yearly average
49 in
51.4 in
Snowfall - Yearly average
17.8 in
4 in
Clouds - Number of days clear of clouds
17.1%
18.3%
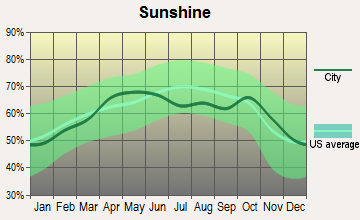
Sunshine amount - Average
59.7%
65.6%
Sunshine amount - Differences during a year
23%
17%
Sunshine amount - Maximum monthly
65%
67%
Sunshine amount - Minimum monthly
42%
50%
Wind speed - Average
7.7 mph
9 mph
Average climate in Nashville-Davidson, Tennessee
Average climate in Atlanta, Georgia
Air pollution
Type
AQI
CO
NO2
OZONE
PB
PM10
PM25
SO2
Year
Nashville-Davidson
Atlanta
Nashville-Davidson
Atlanta
Nashville-Davidson
Atlanta
Nashville-Davidson
Atlanta
Nashville-Davidson
Atlanta
Nashville-Davidson
Atlanta
Nashville-Davidson
Atlanta
Nashville-Davidson
Atlanta
2018
71
84
0.40
0.27
13.8
N/A
24.1
24.7
N/A
N/A
15.2
17.5
9.2
10.6
0.2
0.8
2017
70
87
0.38
0.31
14.4
N/A
26.8
24.7
N/A
N/A
15.3
17.5
8.7
11.3
0.1
1.2
2016
90
105
0.42
0.31
16.1
N/A
26.4
25.9
N/A
N/A
N/A
17.2
10.1
11.1
0.0
1.0
2015
68
91
0.43
0.31
15.5
N/A
23.6
23.9
N/A
N/A
N/A
17.6
10.8
10.2
0.1
0.9
2014
66
88
N/A
0.31
N/A
N/A
26.3
24.0
N/A
N/A
N/A
18.4
9.8
9.1
1.4
1.1
2013
62
88
N/A
0.30
N/A
N/A
N/A
23.7
N/A
N/A
N/A
18.0
9.7
8.7
N/A
1.0
2012
81
109
N/A
0.33
N/A
N/A
28.3
26.2
N/A
N/A
N/A
19.5
11.0
9.8
2.3
1.1
2011
81
98
N/A
0.33
N/A
N/A
25.9
27.5
N/A
N/A
N/A
21.2
11.0
12.0
1.7
1.7
2010
80
102
N/A
0.35
N/A
N/A
24.3
25.8
N/A
N/A
N/A
18.5
12.2
12.5
2.2
1.9
2009
72
96
N/A
N/A
N/A
N/A
22.5
25.2
N/A
N/A
N/A
18.5
11.5
13.8
2.4
1.7
2008
81
99
N/A
0.53
N/A
15.3
25.7
31.2
N/A
0.003
N/A
22.5
13.4
16.3
2.5
2.5
2007
99
124
N/A
0.45
N/A
17.0
27.4
33.1
N/A
0.003
N/A
29.4
15.5
18.1
2.7
2.7
2006
93
129
0.69
0.58
N/A
17.9
24.9
31.3
N/A
0.003
N/A
22.9
14.9
19.7
2.9
3.4
2005
104
123
0.56
0.55
N/A
17.2
23.5
29.0
N/A
0.005
N/A
25.5
16.9
15.8
3.1
3.2
2004
83
118
0.61
0.54
N/A
16.9
22.0
28.8
0.006
0.004
N/A
22.9
N/A
14.6
2.6
2.8
2003
93
112
0.67
0.56
N/A
16.4
18.5
26.7
0.005
0.004
N/A
22.2
15.8
15.4
3.8
3.0
2002
92
120
0.67
0.60
N/A
19.4
20.2
27.9
N/A
N/A
N/A
23.2
15.3
13.1
4.3
3.0
2001
95
117
0.89
0.69
N/A
23.3
19.5
27.2
N/A
N/A
N/A
27.0
15.6
N/A
4.5
3.1
2000
97
132
0.74
0.50
N/A
22.9
19.8
31.2
N/A
N/A
N/A
28.4
N/A
N/A
4.1
3.2
Natural disasters
Type
Nashville-Davidson
Atlanta
Tornado activity compared to U.S. average
169.1%
159.5%
Earthquake activity compared to U.S. average
296.1%
153.4%
Natural disasters compared to U.S. average
17%
15%
Transportation
Atlanta's Metropolitan Atlanta Rapid Transit Authority (MARTA) provides quality public transit services, while Nashville has the Metropolitan Transit Authority (MTA). Additionally, Atlanta is known for its heavy traffic, something Nashville also deals with but to a lesser extent.
Transport
Type
Nashville-Davidson
Atlanta
Amtrak stations
0
1
Amtrak stations nearby
1
1
FAA registered aircraft
0
1
FAA registered aircraft manufacturers and dealers
0
28
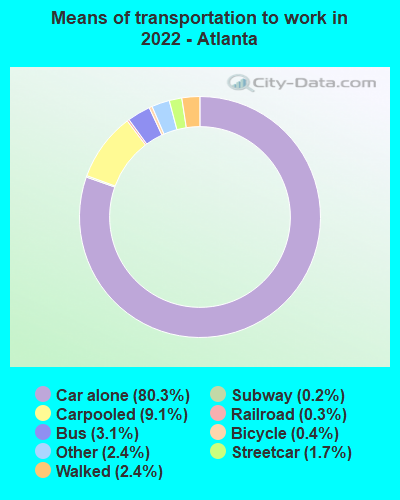
Means of transportation to work
Type
Nashville-Davidson
Atlanta
Bicycle
0.3%
0.5%
Bus
1.2%
2.1%
Carpooled
9.8%
7.6%
Car alone
85.5%
84%
Motorcycle
0.1%
0.1%
Railroad
0%
0.2%
Streetcar
0%
1.1%
Subway
0%
0.4%
Taxicab
0.1%
0.3%
Walked
1.8%
1.9%
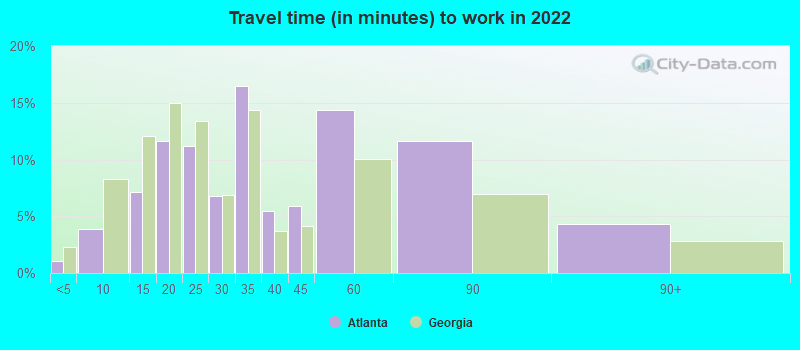
Average travel time to work
Type
Nashville-Davidson
Atlanta
Average
31.3 min
34.9 min
Other means
23.4 min
24.4 min
Public transportation
38.9 min
47.8 min
Private vehicle occupancy
Type
Nashville-Davidson
Atlanta
Average
1.2
1.1
Drove alone
88.7%
92.5%
In 2 person carpool
8.5%
6.7%
In 3 person carpool
1.6%
0.6%
In 4 person carpool
0.7%
0.3%
In 5-6 person carpool
0.5%
0%
How many people usually rode to work in the car, truck or van.
Real Estate
The real-estate market of Atlanta is more expensive than Nashville's. Both cities, however, are appealing to real-estate investors and homebuyers due to their economic growth and desirable living conditions.
Neighborhoods
Both cities offer a variety of neighborhoods that can suit different lifestyles, from vibrant, lively urban environments to serene, family-friendly suburbs. The neighborhoods in these cities are as varied as the people who live in them.
Houses and residents
Type
Nashville-Davidson
Atlanta
Houses
331,262
253,355
Average household size (people)
2.3
2.1
Median year apartment built
1986
1996
Median year house/condo built
1984
1976
Length of stay in the house since moving in
12.2 years
12.2 years
Houses occupied
305,247 (92.1%)
232,720 (91.9%)
Houses occupied by owners
162,426 (53.2%)
113,092 (48.6%)
Houses occupied by renters
142,821 (46.8%)
119,628 (51.4%)
Median rent asked for vacant for-rent units
$1,391
$1,226
Median monthly housing costs
$1,291
$1,504
Median price asked for vacant for-sale houses and condos
$221,129
$325,147
Estimated median house or condo value
$346,700
$375,500
Median numbers of rooms
5.2
4.5
Median number of rooms in apartments
4.2
3.5
Median number of rooms in houses and condos
6.3
6.2
Median house price - detached houses
$437,686
$585,854
Median house price - in 2-unit structures
$320,904
$359,451
Median house price - in 3-to-4-unit structures
$319,119
$453,504
Median house price - in 5 or more unit structures
$305,249
$356,868
Median house price - mobile homes
$133,346
$149,278
Median house price - Townhouses or other attached units
$328,258
$383,334
Median house price - All housing units
$412,434
$508,525
Median house age
35
34
Renting percentage
44.6%
55.1%
Housing density (houses/condos per square mile)
699.9
1,923
House value disparities
31%
36.3%
Household income disparities
45.4%
47.8%
Median household income for houses/condes with a mortgage
$93,092
$123,344
Median household income for apartments without a mortgage
$68,871
$75,939
Housing units without a mortgage
3,189 (2.8%)
1,022 (1.3%)
Housing units with both a second mortgage and home equity loan
10,988 (9.6%)
5,566 (7%)
Housing units with a mortgage
110,850 (97.2%)
78,250 (98.7%)
Housing units with a home equity loan
333 (0.3%)
58 (0.1%)
Housing units with a second mortgage
13,192 (11.6%)
7,203 (9.1%)
House/condo owner moved in on average (years ago)
9
7
House/condo renter moved in on average (years ago)
1
1
Housing units lacking complete kitchen facilities
1.3%
2%
Housing units lacking complete plumbing facilities
0.5%
1.5%
Housing units in structures
Housing units in structures
Nashville-Davidson
Atlanta
One, detached
50.9%
37.5%
One, attached
8.4%
6.6%
Two
3.3%
2.4%
3 or 4
3.1%
3.9%
5 to 9
7.1%
5.9%
10 to 19
8.7%
5.7%
20 to 49
5.3%
6.8%
50 or more
11.9%
30.7%
Mobile homes
1.2%
0.5%
Boats, RVs, vans, etc.
0.1%
0.0%
Median real estate property taxes paid for housing units
Self-employed workers in own not incorporated business
31,952
15,892
State government workers
15,693
13,288
Unpaid family workers
463
550
Industries and Occupations
Atlanta’s economy is dominated by service industries, especially information technology, while Nashville, known as "Music City," has a deep-rooted connection to the entertainment industry, particularly music and arts.
Health care in both Nashville and Atlanta is top-tier, with each city hosting renowned and well-funded research hospitals. Vanderbilt University Medical Center in Nashville and Emory Healthcare in Atlanta are two laureates contributing to the cities' robust healthcare scenes.
Health (county statistics)
Type
Nashville-Davidson
Atlanta
General health status score of residents in this county from 1 (poor) to 5 (excellent)
Atlanta is more densely populated and has larger infrastructure compared to Nashville. This includes taller buildings and a more extensive highway system. Nashville, while smaller, also has a well-developed infrastructure in place.
HMDA - Conventional home purchase loans - Applications denied
Year
Nashville-Davidson
Atlanta
1999
2,397
1,775
2000
1,451
1,902
2001
1,130
1,552
2002
1,075
1,683
2003
2,231
3,212
2004
2,731
4,962
2005
3,231
9,078
2006
3,720
10,866
2007
2,419
6,626
2008
952
2,140
2009
532
731
Culture and Food
Culturally speaking, both cities boast a rich history and southern charm. Atlanta combines southern traditions with modern sophistication, while Nashville is synonymous with country music and southern hospitality. Both cities offer a wide array of food choices, with each city championing its unique style of southern cuisine.
Sports Teams
If you're a sports fan, both Nashville and Atlanta have you covered. Nashville is home to the NFL’s Tennessee Titans and the NHL’s Predators, while Atlanta hosts the NFL’s Falcons, the MLB’s Braves, and the NBA’s Hawks.


 Nashville-Davidson, TN and
  Atlanta, GA : 212.7 miles